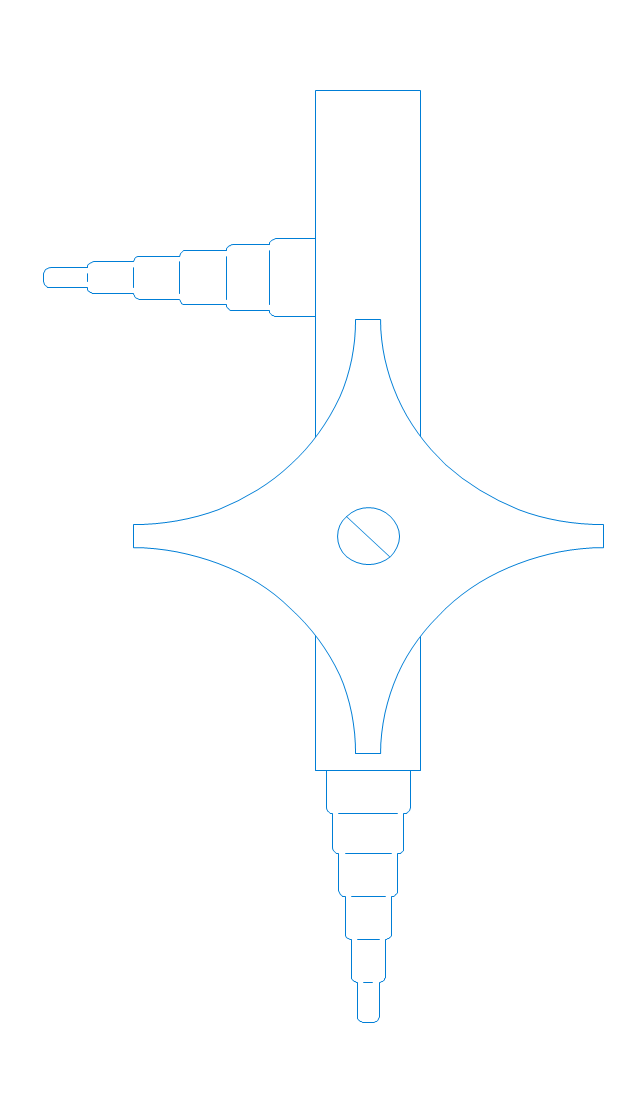
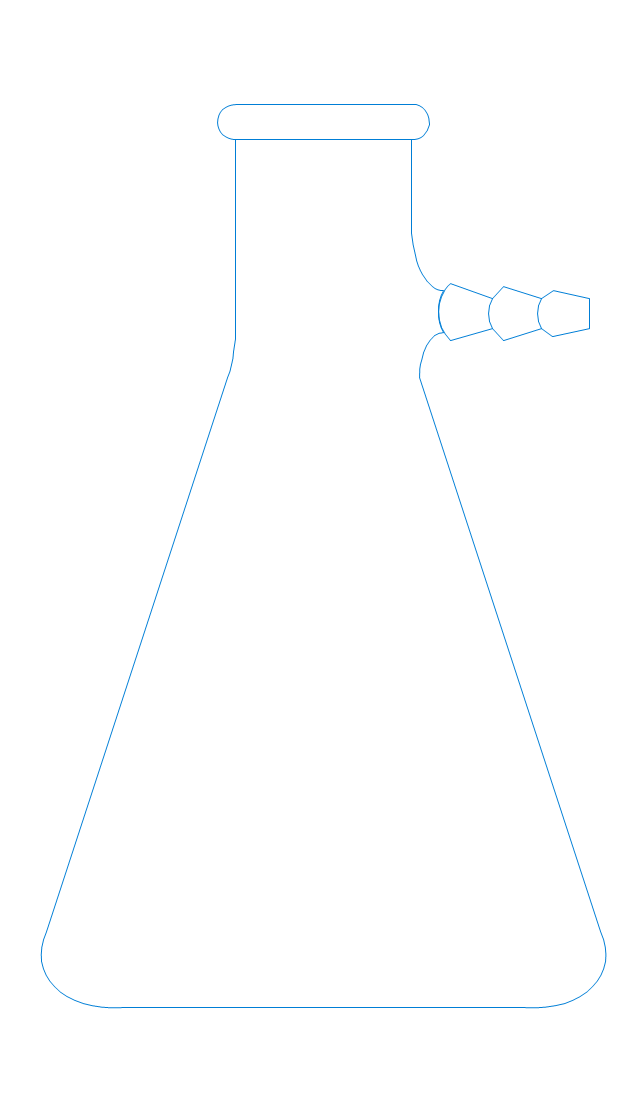
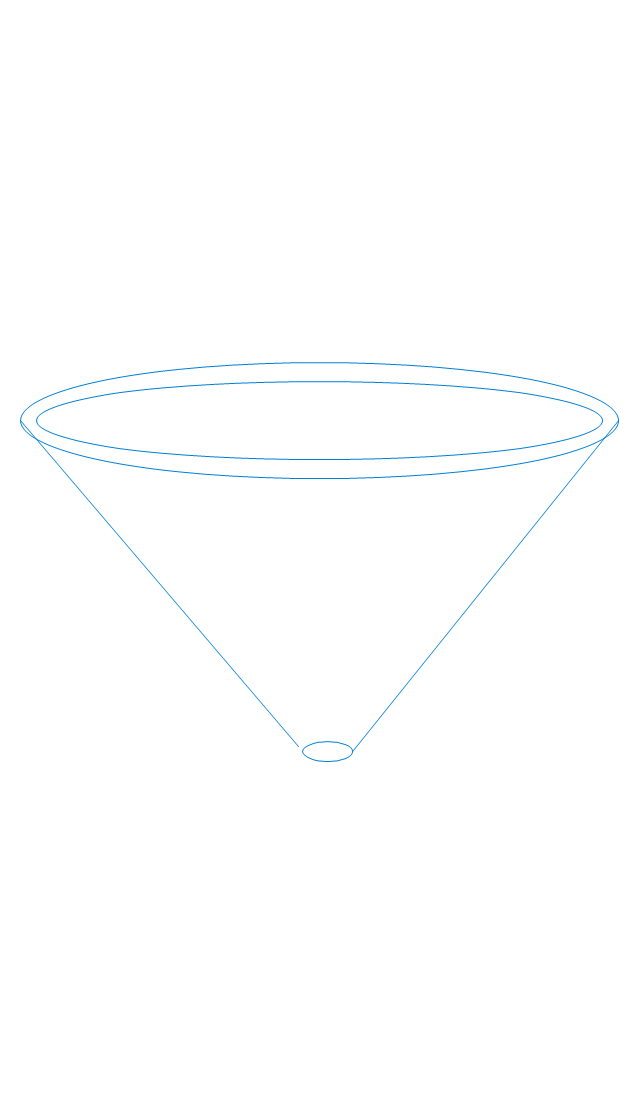
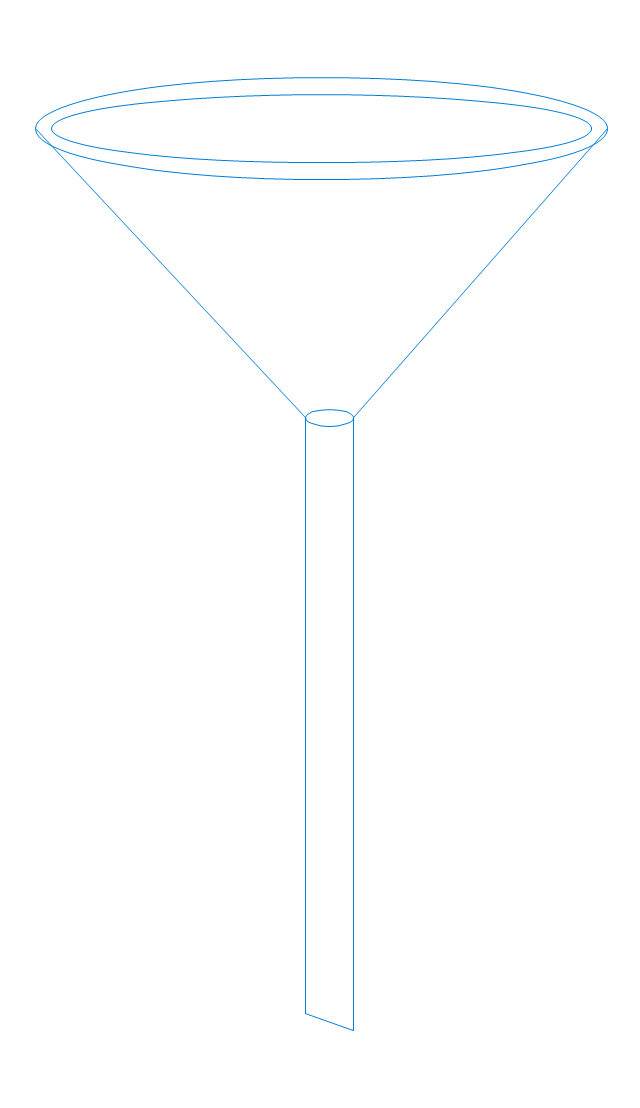
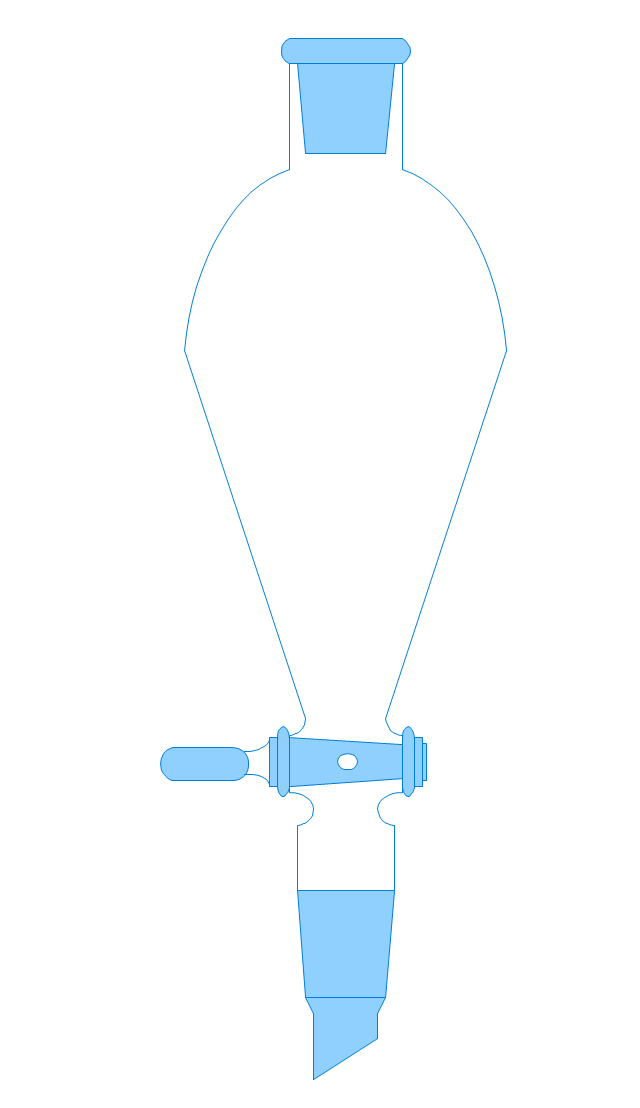
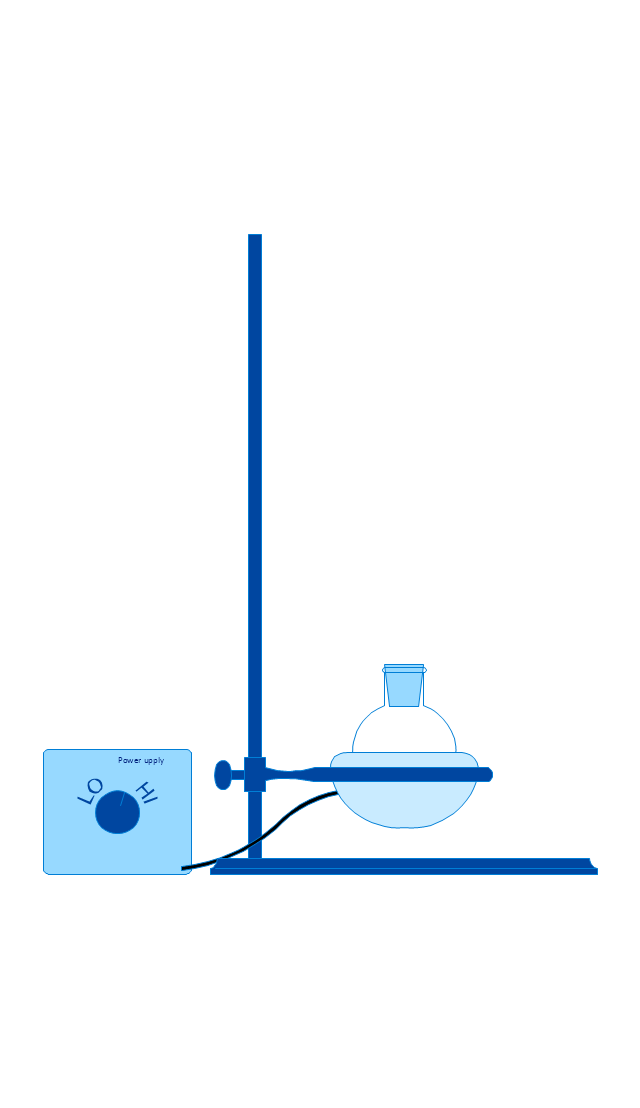
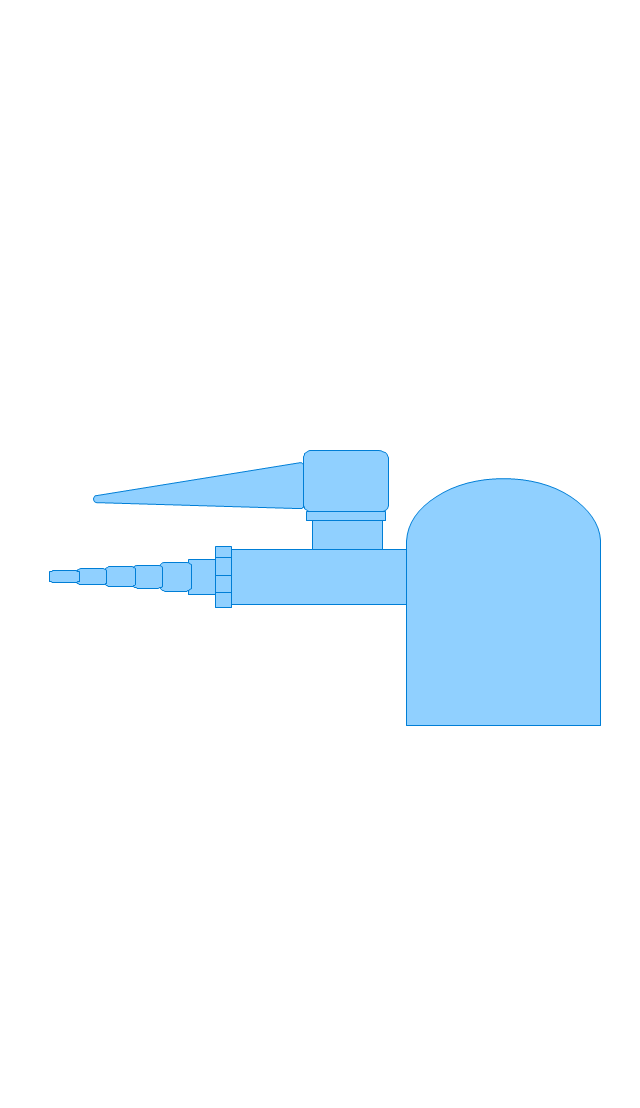
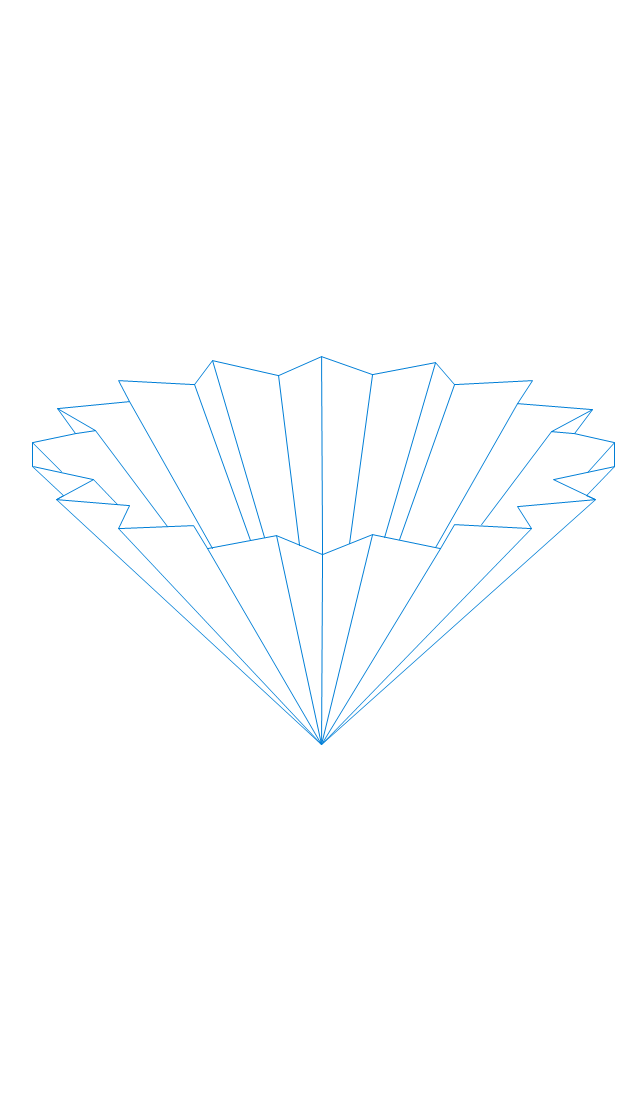
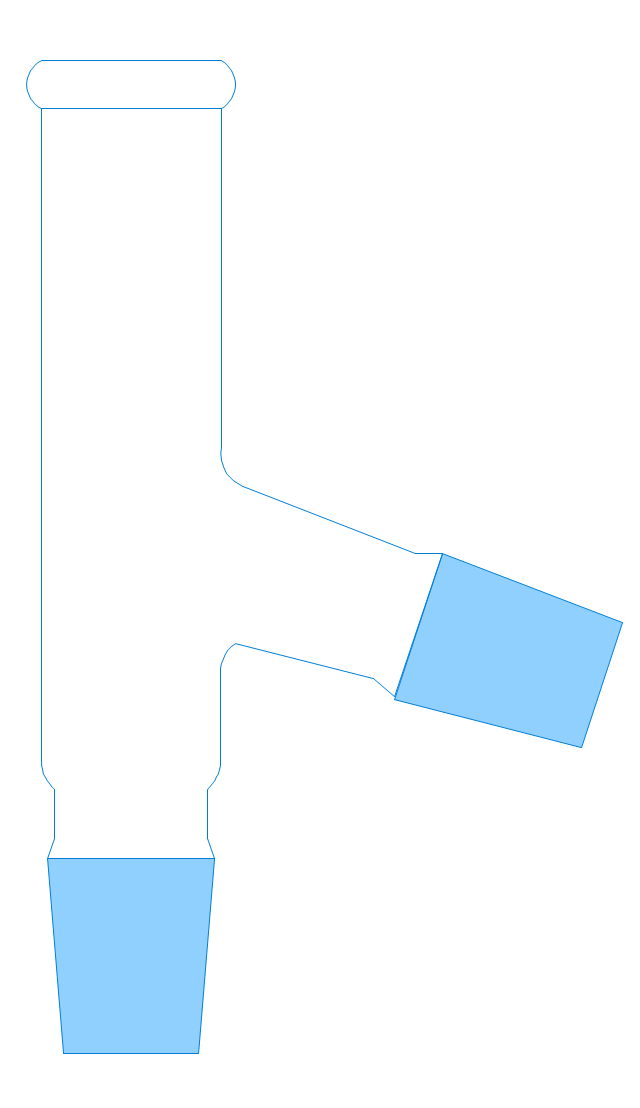
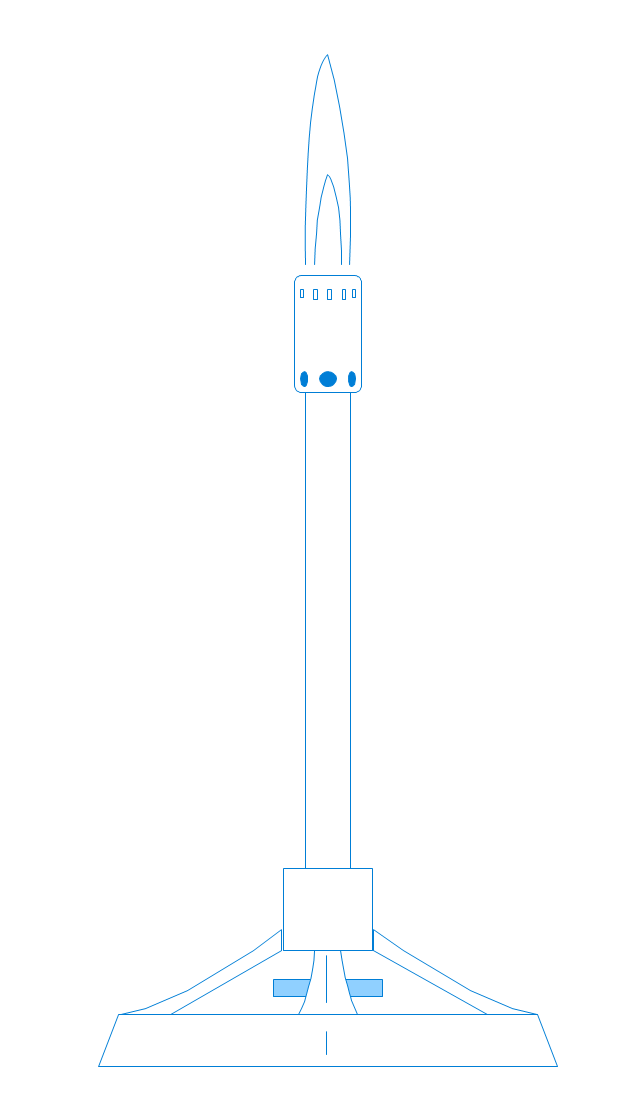
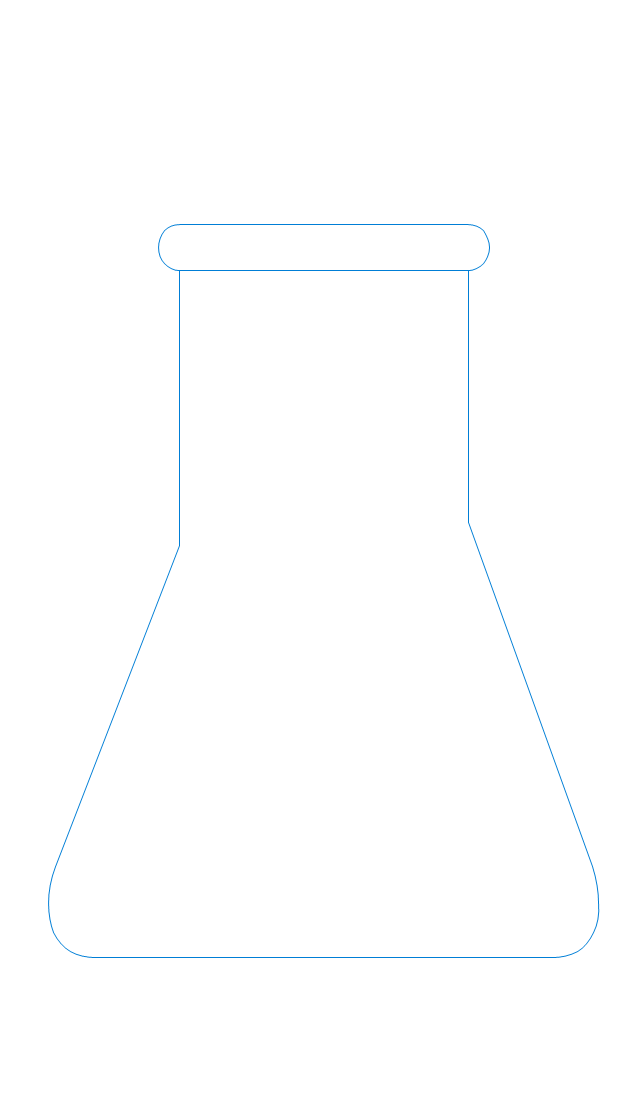
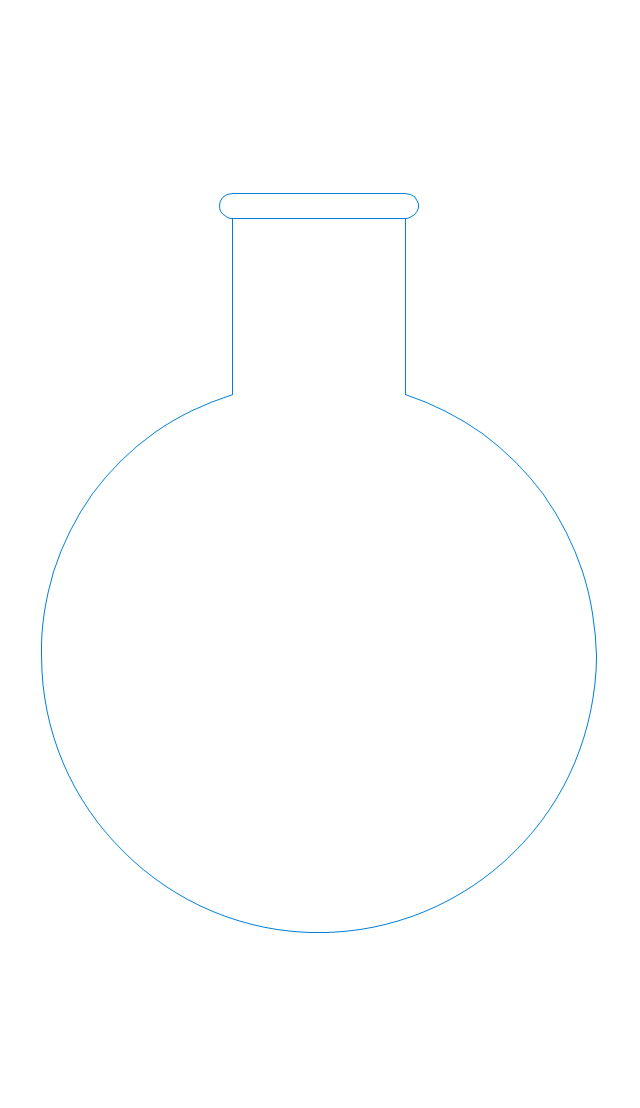
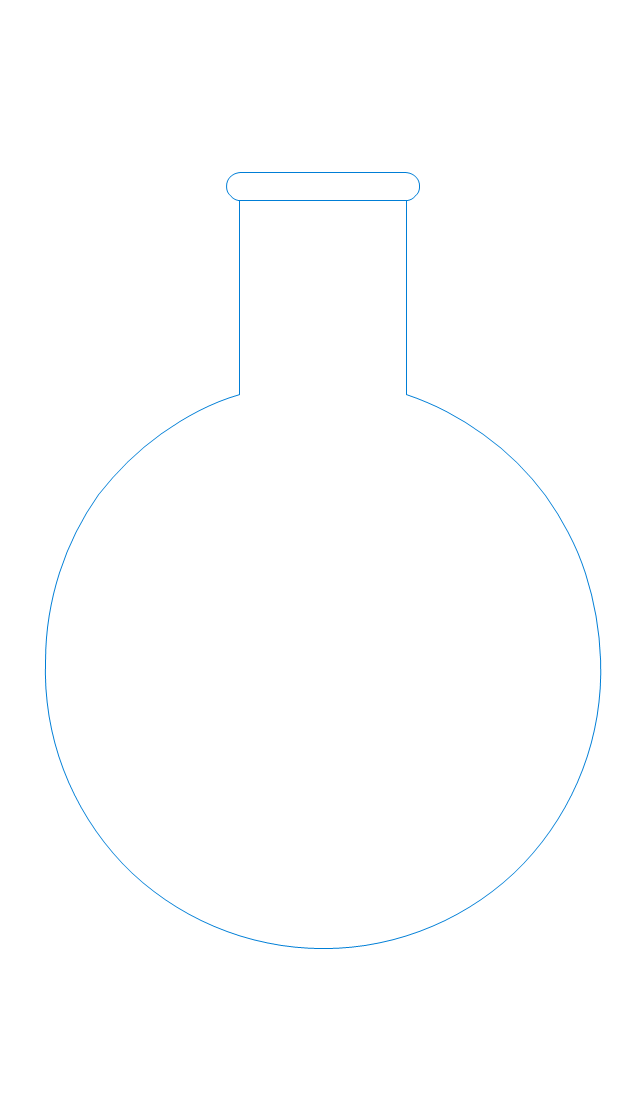
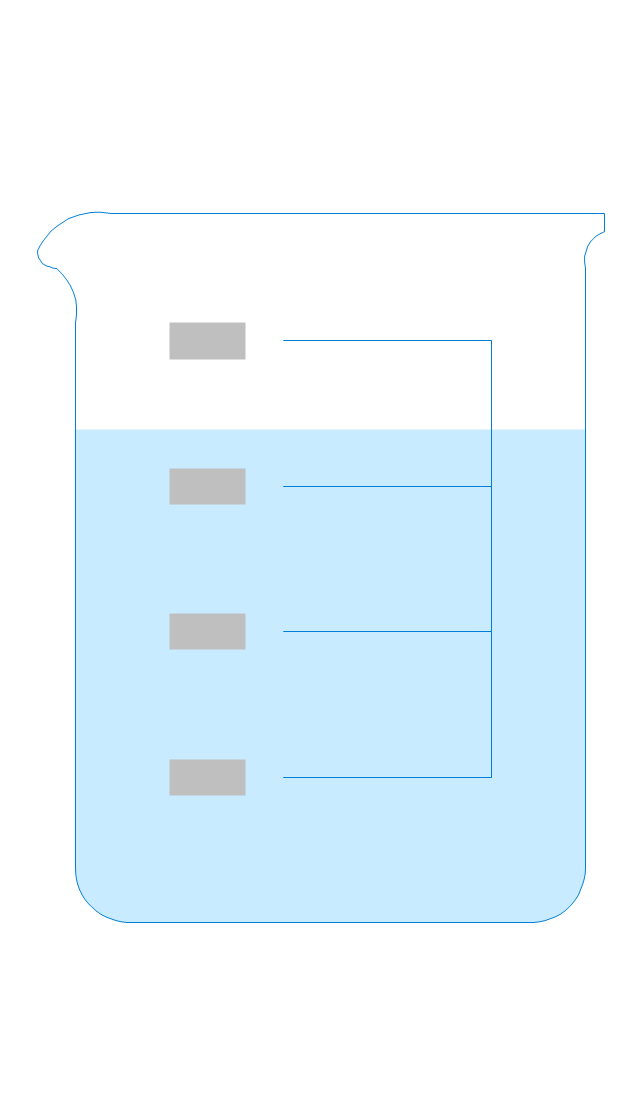
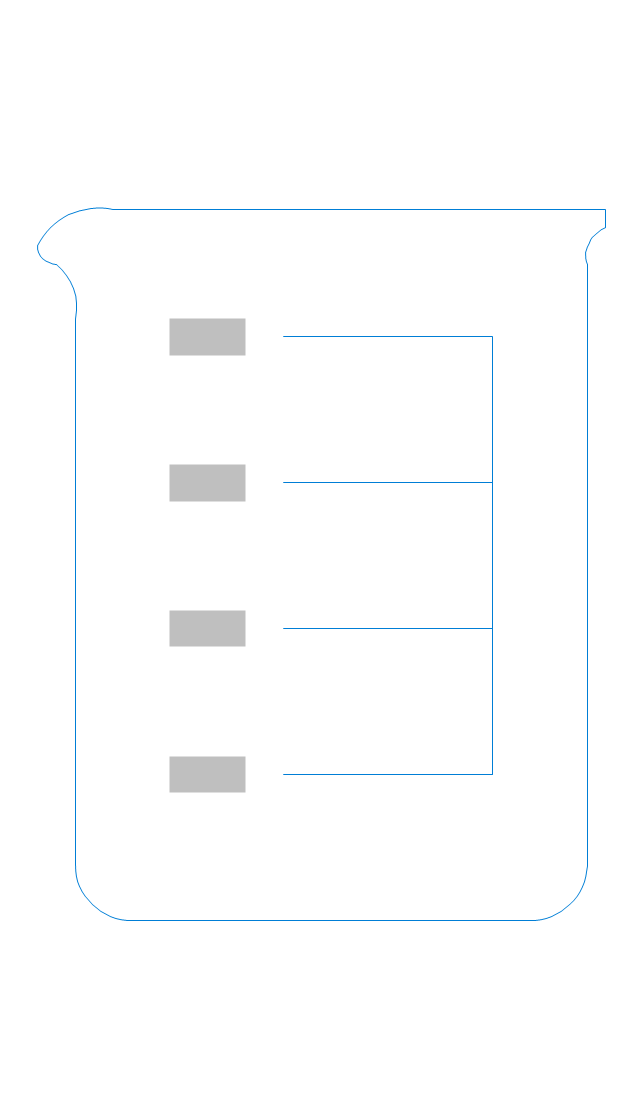
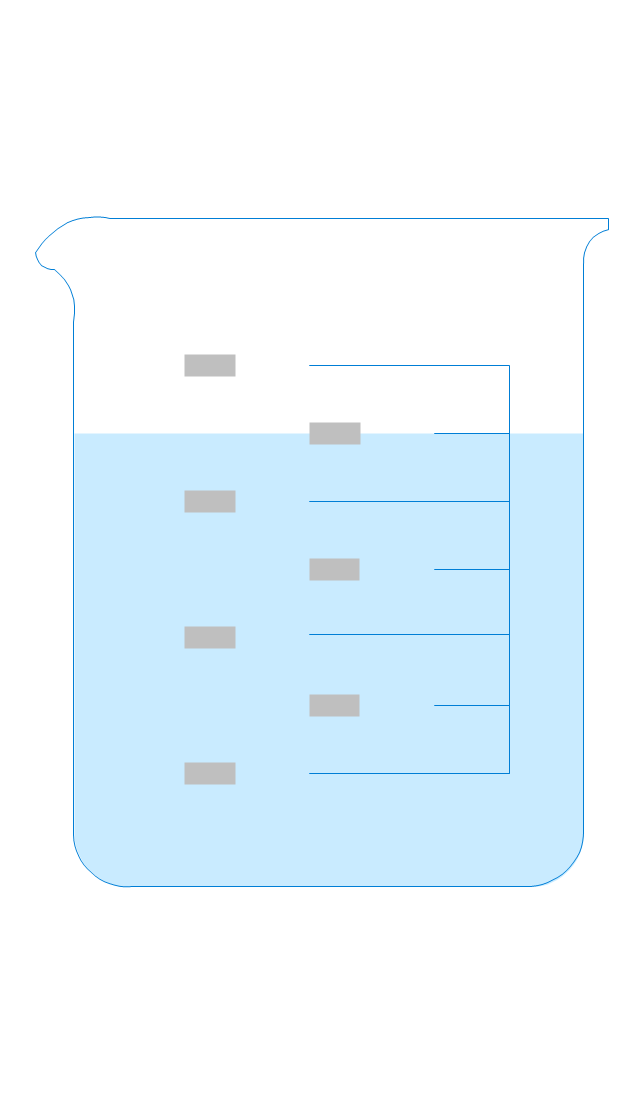
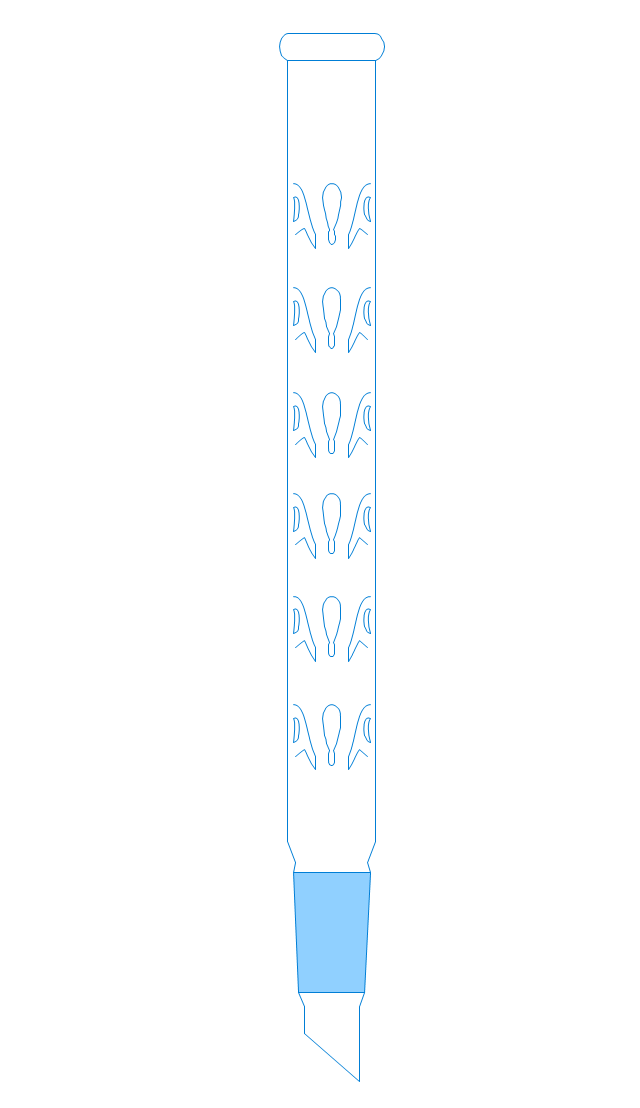
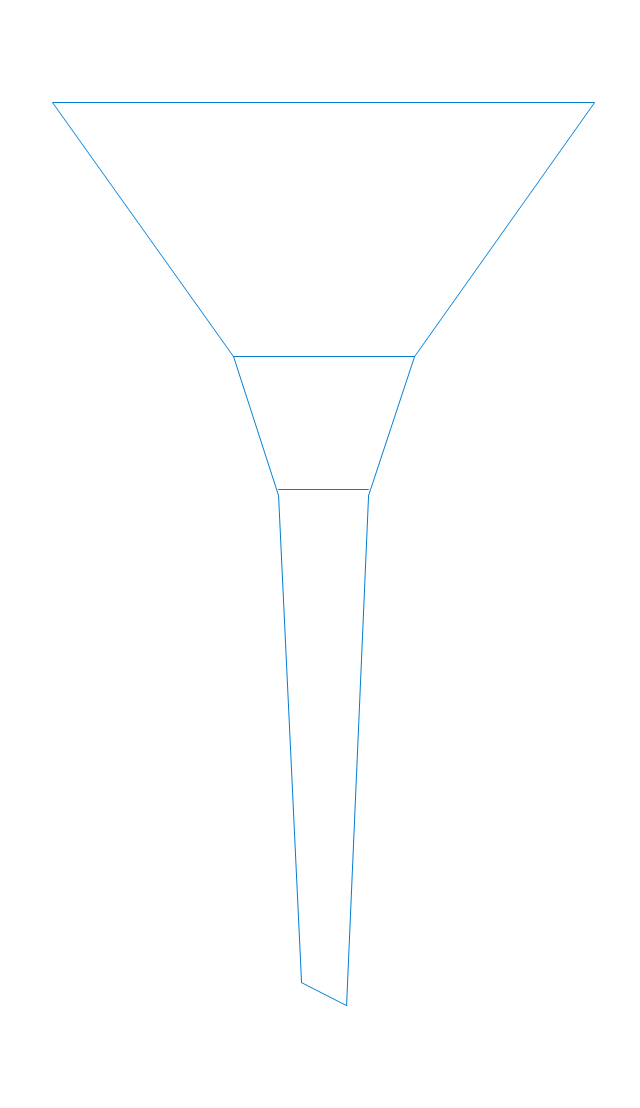
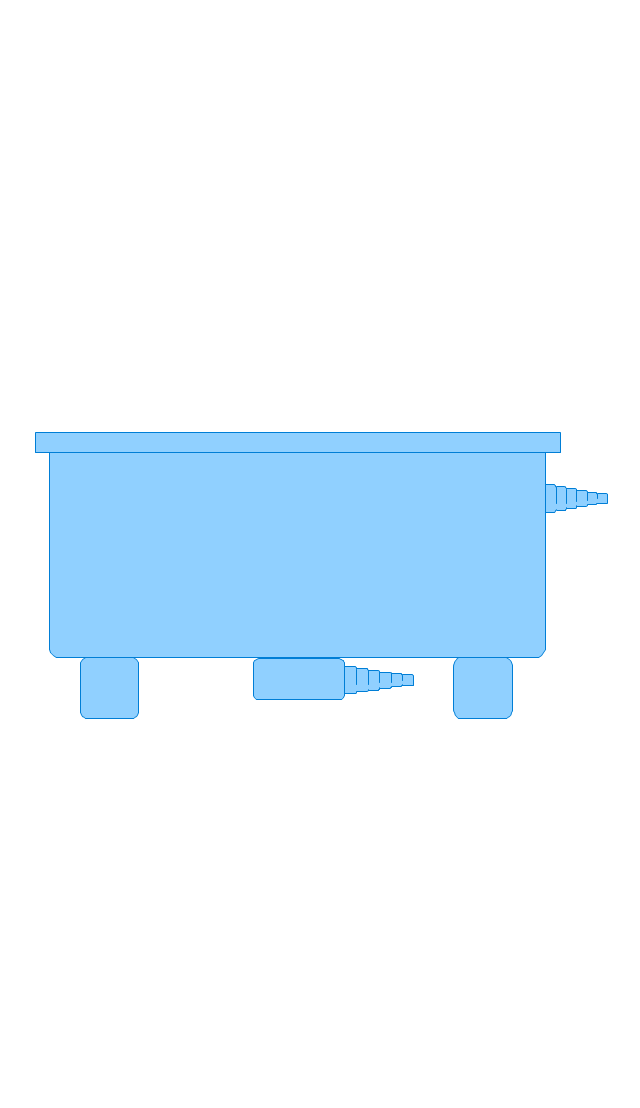
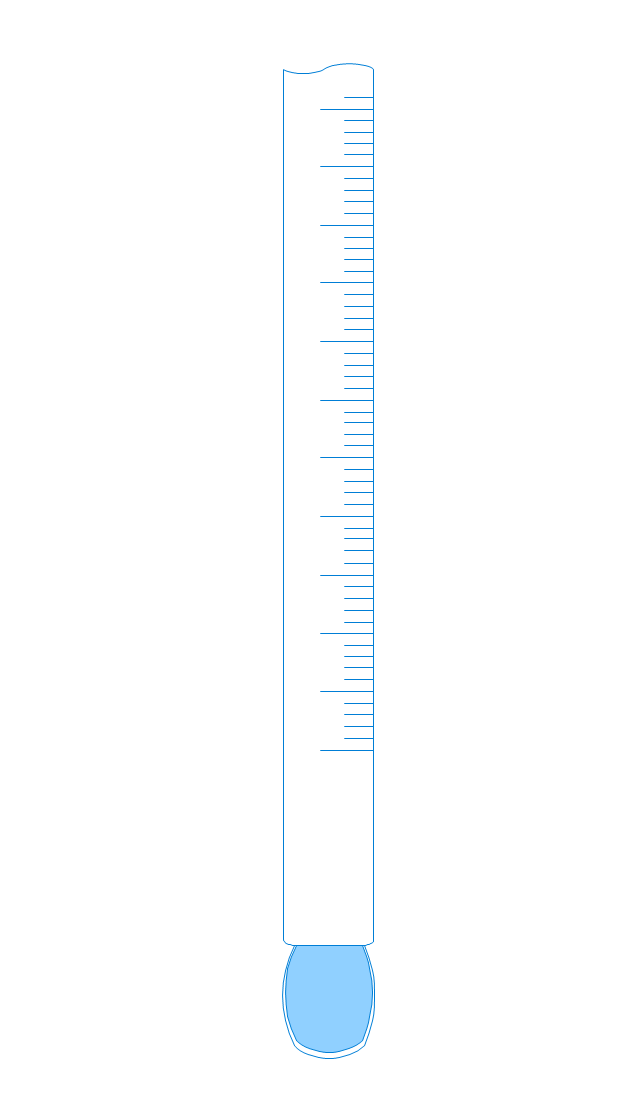
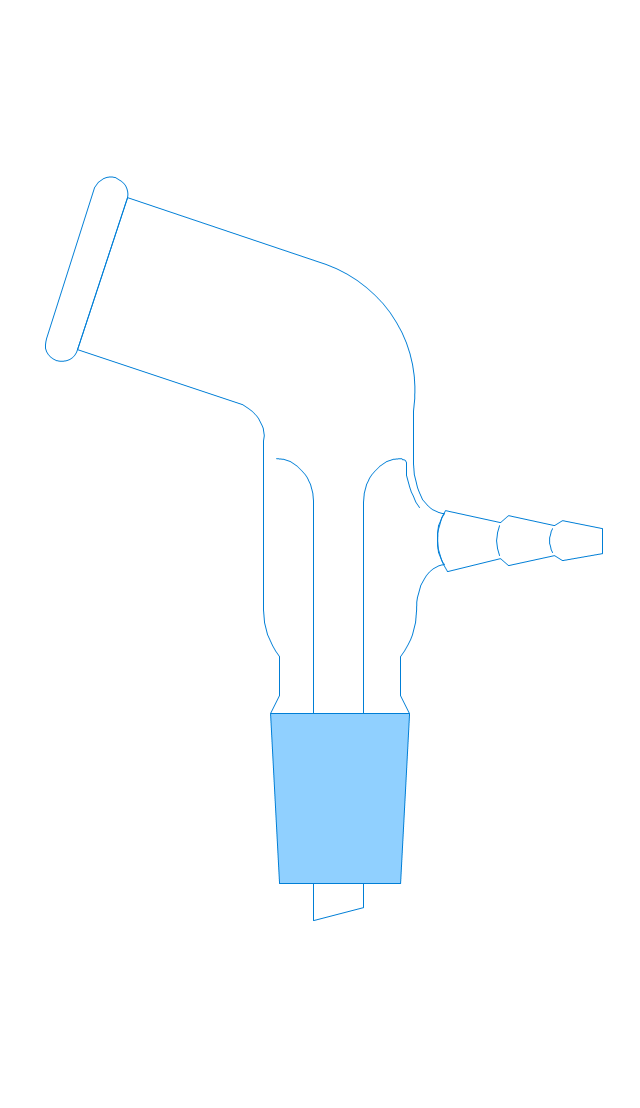
The vector stencils library "Laboratory equipment" contains 31 clipart icons of chemical laboratory equipment and labware.
Use these shapes for drawing part assembly and mounting schemes of glassware apparatus in chemical experiment diagrams and illustrations in the ConceptDraw PRO diagramming and vector drawing software extended with the Chemistry solution from the Science and Education area of ConceptDraw Solution Park.
Use these shapes for drawing part assembly and mounting schemes of glassware apparatus in chemical experiment diagrams and illustrations in the ConceptDraw PRO diagramming and vector drawing software extended with the Chemistry solution from the Science and Education area of ConceptDraw Solution Park.
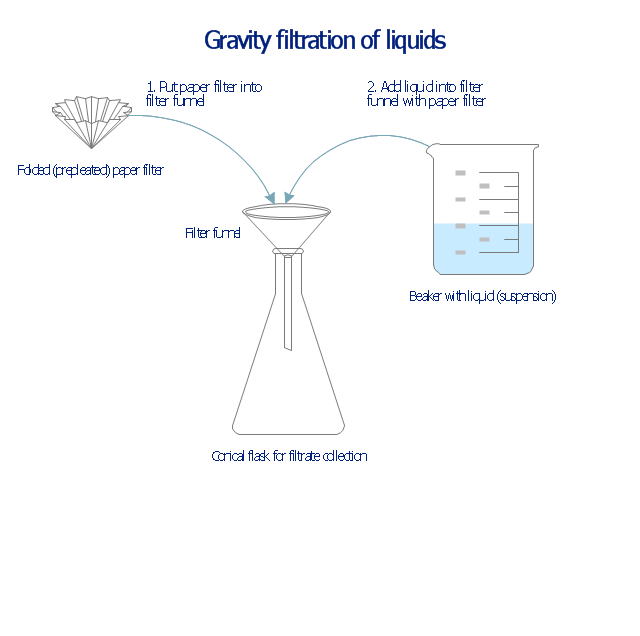
This chemical laboratory technique drawing depict gravity filtration of liquid through prepleated paper filter step-by-step.
1. Put folded filter paper cone into glass filter funnel inserted into neck of conical (Erlenmeyer) flask.
2. Add liquid suspension from the glass beaker with a spout into the funnel with paper filter.
3. Collect filtrate in the conical flask and solid on the paper filter in the funnel.
"Filtration is commonly the mechanical or physical operation which is used for the separation of solids from fluids (liquids or gases) by interposing a medium through which only the fluid can pass. The fluid that pass through is called a filtrate. Oversize solids in the fluid are retained, but the separation is not complete; solids will be contaminated with some fluid and filtrate will contain fine particles (depending on the pore size and filter thickness)." [Filtration. Wikipedia]
"Filter paper is a semi-permeable paper barrier placed perpendicular to a liquid or air flow. It is used to separate fine solids from liquids or air." [Filter paper. Wikipedia]
The chemical lab drawing example "Gravity filtration of liquids" was created using the ConceptDraw PRO diagramming and vector drawing software extended with the Chemistry solution from the Science and Education area of ConceptDraw Solution Park.
- Design elements - Laboratory equipment | Laboratory equipment ...
- Diagram Of Glassware In The Laboratory
- Diagram Of Glass Ware
- Diagrams Of All Lab Apparatuses
- Pyramid Diagram | Purchase funnel diagram | Funnel diagram ...
- Design elements - Laboratory equipment | Gravity filtration of liquids ...
- Diagrams Of Glasswares
- Engineering | Design elements - Laboratory equipment | Process ...
- Draw Diagram Of Glass Ware Apparatus Equipment
- Data Flow Diagrams | Garrett IA Diagrams with ConceptDraw PRO ...
- Diagram Of Glasswares
- Scientific Diagram Of Lab Equipment
- Diagramming Software for Design UML Activity Diagrams | Software ...
- Diagram Of Laboratory Equipments And Their Uses
- Scatter Diagrams | Correlation Dashboard | What is a Dashboard ...
- Basic Audit Flowchart. Flowchart Examples | TQM diagram template ...
- Event-driven Process Chain Diagrams EPC | MindWave for SAP ...
- Physics | Ray tracing diagram for convex lens | Physics Science
- Baseball Diagram – Basic Bunt Coverage – Runner at 1st | Basic ...
- Using Fishbone Diagrams for Problem Solving | Education ...

--laboratory-equipment---vector-stencils-library.png--diagram-flowchart-example.png)
-laboratory-equipment---vector-stencils-library.png--diagram-flowchart-example.png)
-laboratory-equipment---vector-stencils-library.png--diagram-flowchart-example.png)
