HelpDesk
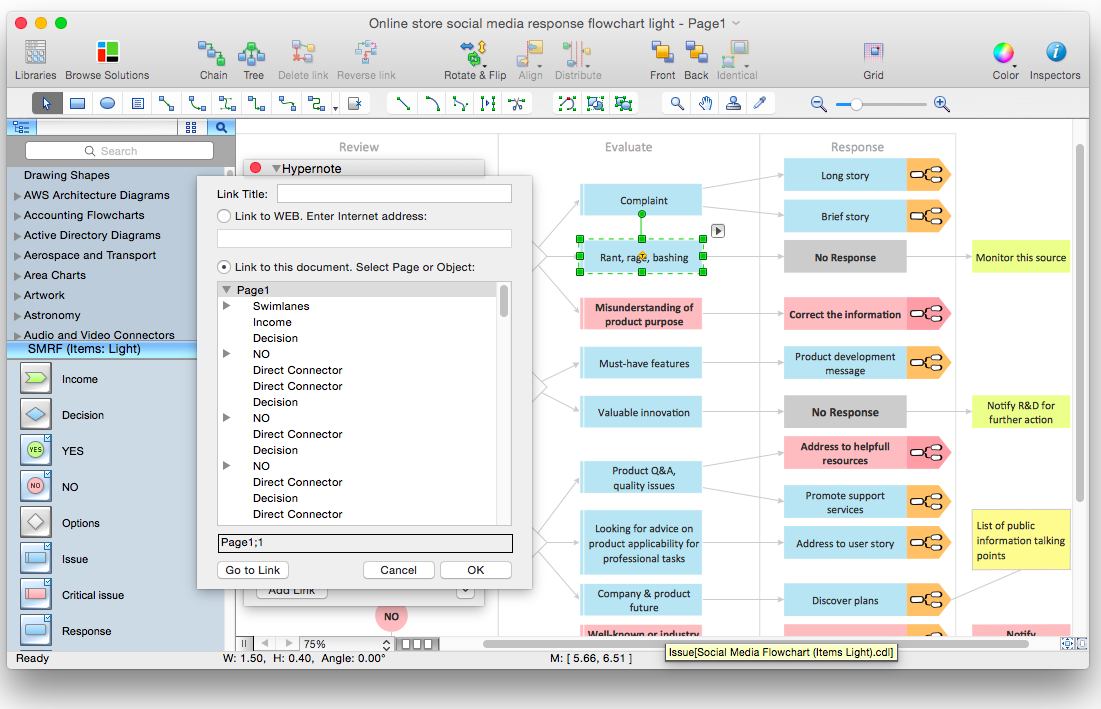
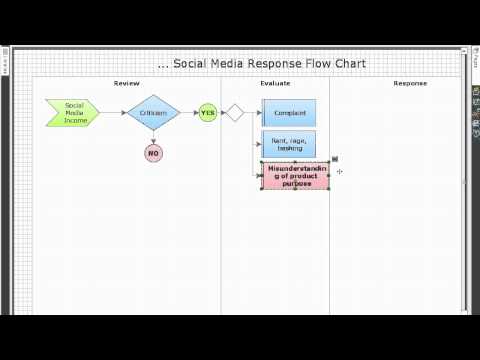
How to Organize a Social Media Activity Using Social Media Response Solution
 ConceptDraw Solution Park
ConceptDraw Solution Park collects graphic extensions, examples and learning materials
HelpDesk
How to Draw a Histogram in ConceptDraw PRO

 Accounting Flowcharts
Accounting Flowcharts solution extends ConceptDraw PRO software with templates, samples and library of vector stencils for drawing the accounting flow charts.
 Bar Graphs
The Bar Graphs solution enhances ConceptDraw PRO v10 functionality with templates, numerous professional-looking samples, and a library of vector stencils for drawing different types of Bar Graphs, such as Simple Bar Graph, Double Bar Graph, Divided Bar Graph, Horizontal Bar Graph, Vertical Bar Graph, and Column Bar Chart.
 Area Charts
Area Charts are used to display the cumulative totals over time using numbers or percentages; or to show trends over time among related attributes. The Area Chart is effective when comparing two or more quantities. Each series of data is typically represented with a different color, the use of color transparency in an object’s transparency shows overlapped areas and smaller areas hidden behind larger areas.
 Seven Management and Planning Tools
Seven Management and Planning Tools solution extends ConceptDraw PRO and ConceptDraw MINDMAP with features, templates, samples and libraries of vector stencils for drawing management mind maps and diagrams.
HelpDesk
How to Create a Timeline Diagram in ConceptDraw PRO

- Flow Chart Design - How to Design a Good Flowchart | Process ...
- Flow Chart Design - How to Design a Good Flowchart | Design ...
- Process Flowchart | Flow Chart Design - How to Design a Good ...
- Flow Chart Design - How to Design a Good Flowchart | Create
- Process Flow app for Mac | Basic Diagramming | Flow Chart Design ...
- Flow Chart Design - How to Design a Good Flowchart | Creating a ...
- Product life cycle graph | Good Flow Chart app for Mac | Design ...
- Flowchart - Selection sorting method | Flow Chart Design - How to ...
- Flowchart Software | Flow Chart Design - How to Design a Good ...
- Circular arrows diagram - Quality cycle | Design elements ...
- How to Design a Good Workflow | Work Flow Process Chart ...
- Cross-Functional Flowchart | Flow Chart Design - How to Design a ...
- Flowcharts | Flow Chart Design - How to Design a Good Flowchart ...
- Flow Chart Design - How to Design a Good Flowchart | How to Draw ...
- Flow Chart Design - How to Design a Good Flowchart | How Do You ...
- Creating a Simple Flowchart | Flow Chart Design - How to Design a ...
- Flow Chart Design - How to Design a Good Flowchart . Create
- Good Flow Chart app for Mac | Process Flow app for Mac | Best ...
- Process Flow app for Mac | Flow Chart Design - How to Design a ...