Sales Growth. Bar Graphs Example
This sample was created in ConceptDraw PRO diagramming and vector drawing software using the Bar Graphs Solution from Graphs and Charts area of ConceptDraw Solution Park. It is Bar Graphs example, Sales Growth example, Column Chart Example - Sales Report.Basic Diagramming
Create flowcharts, organizational charts, bar charts, line graphs, and more with ConceptDraw PRO.
Bar Diagrams for Problem Solving. Create event management bar charts with Bar Graphs Solution
Create bar charts for event management problem solving and visual data comparison using the ConceptDraw PRO diagramming and vector drawing software extended with the Bar Graphs Solution from the Graphs and Charts area of ConceptDraw Solition Park.
 Line Graphs
Line Graphs solution extends ConceptDraw PRO software with templates, samples and library of vector stencils for drawing the line charts.
Bar Diagrams for Problem Solving. Create manufacturing and economics bar charts with Bar Graphs Solution
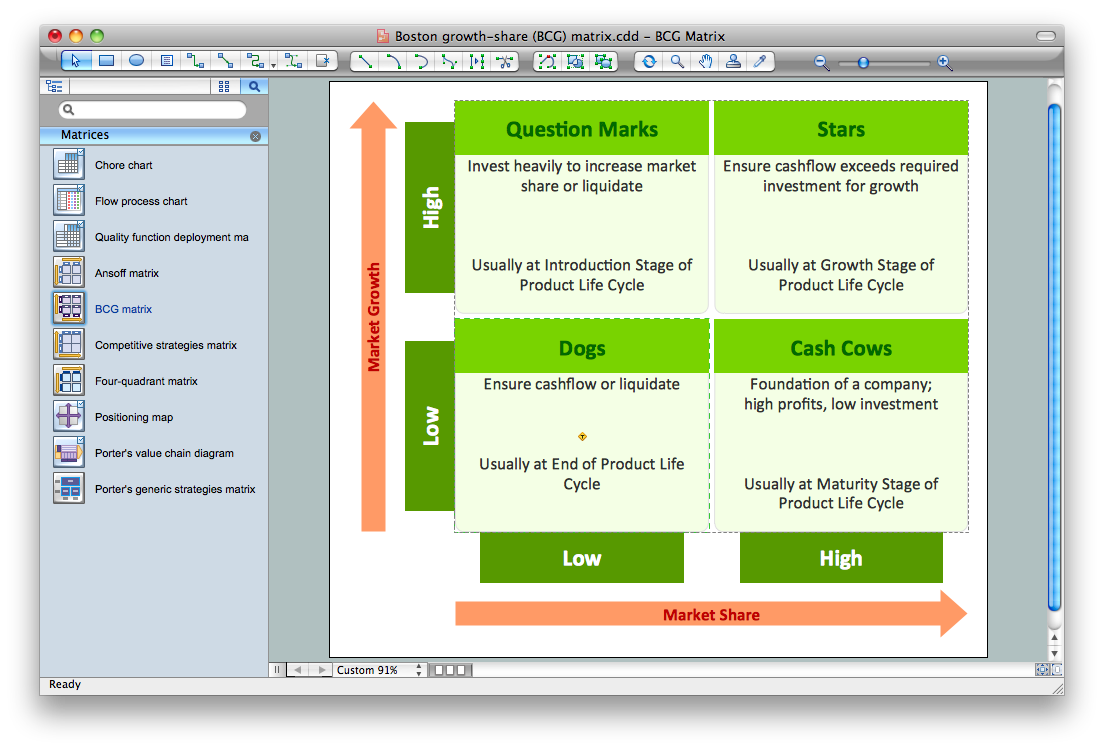
Create bar charts for visualizing problem solving in manufacturing and economics using the ConceptDraw PRO diagramming and vector drawing software extended with the Bar Graphs Solution from the Graphs and Charts area of ConceptDraw Solition Park.Growth-Share Matrix Software
Growth-Share Matrix Software - ConceptDraw PRO is a powerful diagramming and vector drawing software for creating professional looking Growth–Share Matrices. For simple and quick creating the Growth–Share Matrix ConceptDraw PRO offers the Matrices Solution from the Marketing Area of ConceptDraw Solution Park.The Matrices Solution also provides a wide variety of templates and samples that will help you to create the Matrix diagrams of any difficulty.
 Picture Graphs
Picture Graphs solution extends ConceptDraw PRO software with templates, samples and library of vector stencils for drawing the picture charts.
 Matrices
This solution extends ConceptDraw PRO software with samples, templates and library of design elements for drawing the business matrix diagrams.
Ansoff Matrix
ConceptDraw PRO software extended with Matrices Solution from the Marketing Area of ConceptDraw Solution Park offers you the possibility to develop the Ansoff Matrix of any complexity.BCG Matrix
The growth–share matrix (BCG Matrix) was created by Bruce D. Henderson for the Boston Consulting Group in 1970 to help corporations to analyze their business units and to help the company allocate resources. How is it easy design the BCG Matrices in ConceptDraw PRO diagramming and vector drawing software supplied with unique Matrices Solution from the Marketing Area of ConceptDraw Solution Park.Matrices
ConceptDraw PRO extended with Matrices Solution from the Marketing Area of ConceptDraw Solution Park is a powerful software for drawing various types of Marketing Matrices: Ansoff Matrix, BCG Matrix, Deployment Chart, Feature Comparison Chart, Competitive Strategies Matrix, Flow Process Chart, Porter's Value Chain Diagram, Positioning Map, and many others.
 Area Charts
Area charts solution extends ConceptDraw PRO with templates, samples and library of vector stencils for drawing the area graphs.
 Frequency Distribution Dashboard
Frequency distribution dashboard solution extends ConceptDraw PRO software with samples, templates and vector stencils libraries with histograms and area charts for drawing the visual dashboards showing frequency distribution of data.
 PM Dashboards
This solution extends ConceptDraw PRO and ConceptDraw PROJECT software with the ability to clearly display the identified key performance indicators for any project.
 Collaboration Area
The solutions from Collaboration area of ConceptDraw Solution Park extend ConceptDraw PRO and ConceptDraw MINDMAP software with features, samples, templates and vector stencils libraries for drawing diagrams and mindmaps useful for collaboration.
- Business Growth Chart Graph
- Sales Growth . Bar Graphs Example | Bar Chart Examples | Bar ...
- Business Chart Example
- Create Graphs and Charts | Sales Growth . Bar Graphs Example ...
- Organizational Chart Templates | Sales Growth . Bar Graphs ...
- Create Graphs and Charts | Basic Diagramming | Sales Growth . Bar ...
- Sales Growth . Bar Graphs Example | Seven Management and ...
- Sales Growth . Bar Graphs Example | Bar Chart Examples | Create ...
- Sales Growth . Bar Graphs Example | How to Create a Picture Graph ...
- Business process Flow Chart
- Sales Growth . Bar Graphs Example | Create Graphs and Charts ...
- Chart Maker for Presentations | Chart Software for Better ...
- Sales Growth . Bar Graphs Example | Sales Dashboard | Sales ...
- Create Graphs and Charts | Business Diagram Software | Create ...
- Free Business Charts And Graphs
- Quality In Manufacturing Pdf And Ppt
- Business Graph
- Flowchart Example: Flow Chart of Marketing Analysis
- Marketing Flow Chart | Marketing Organization Chart | Flowchart ...


