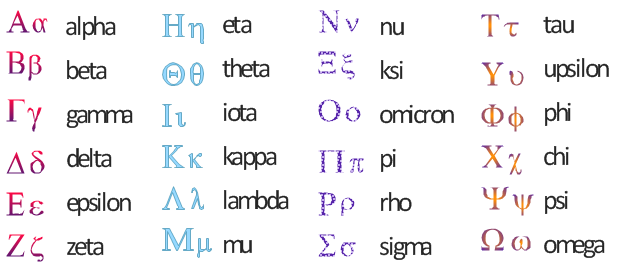
The vector stencils library "Greek letters" contains 87 symbols for creation of stylized text with special effects as gradient fill, shadows, textures, ornaments, outlines, character rotation, "bend" and "stretch" not available through the text formatting.
You can use it to design your own art titles and typography elements for your illustrations, presentation slides, infographics and diagrams using the ConceptDraw PRO diagramming and vector drawing software.
The vector typography example "Design elements - Greek letters" is included in the Artwork solution from the Illustration area of ConceptDraw Solution Park.
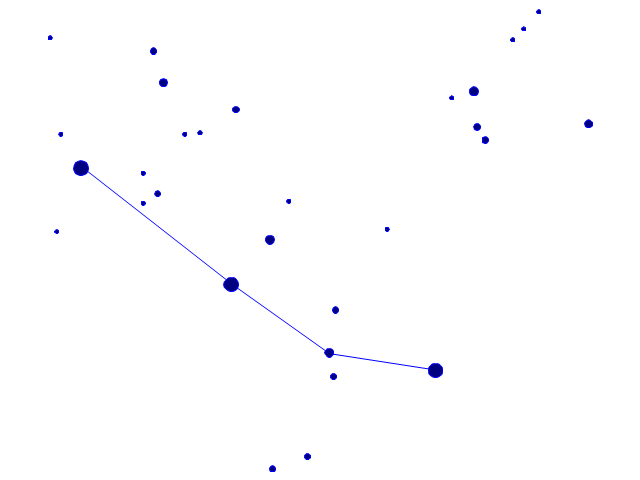
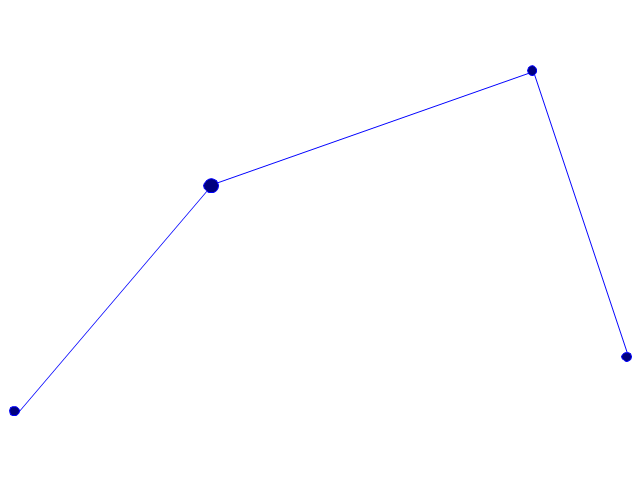
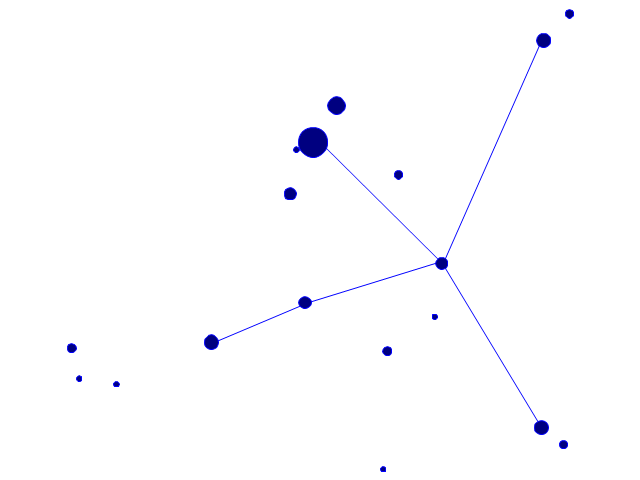
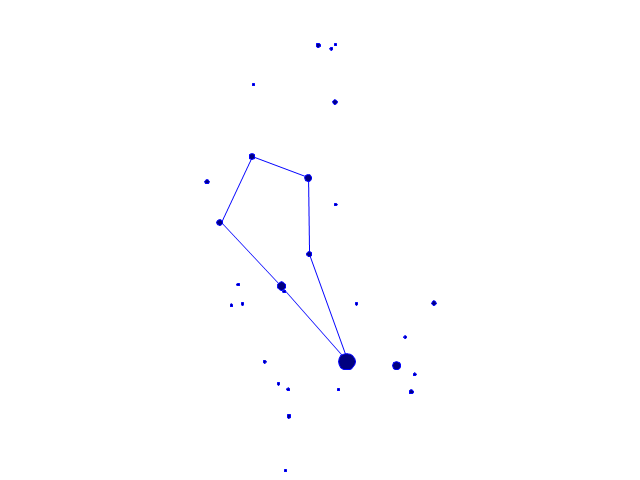
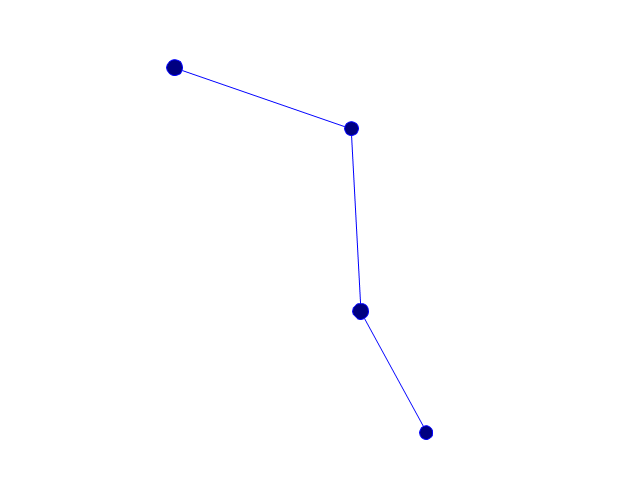
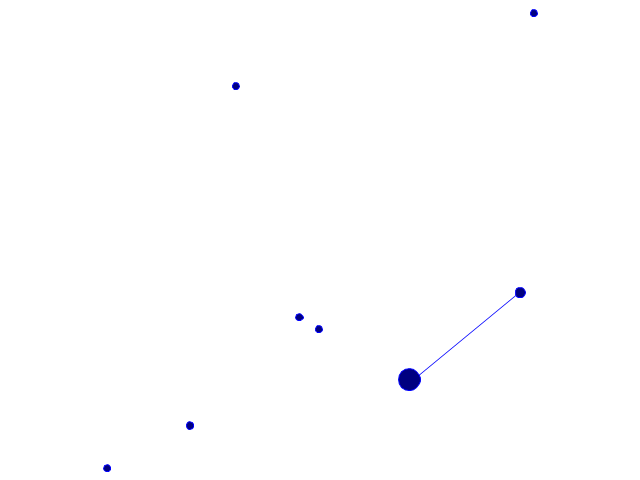
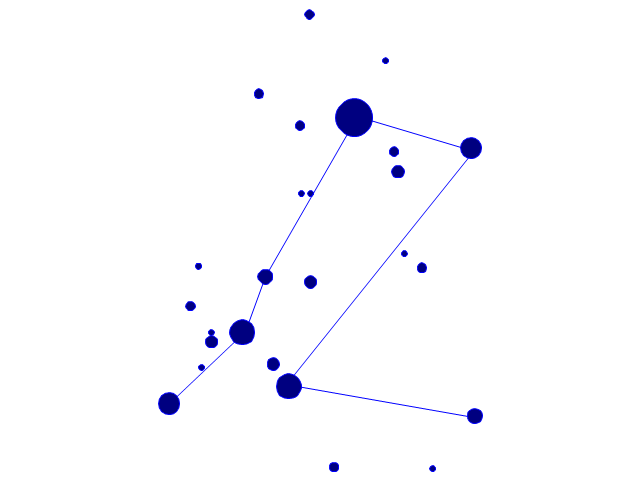
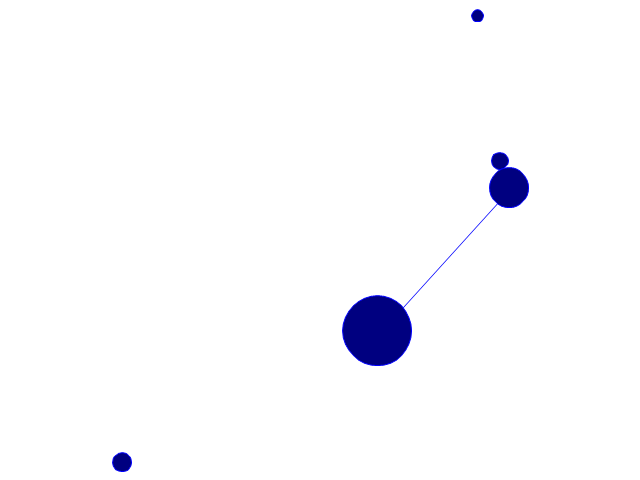
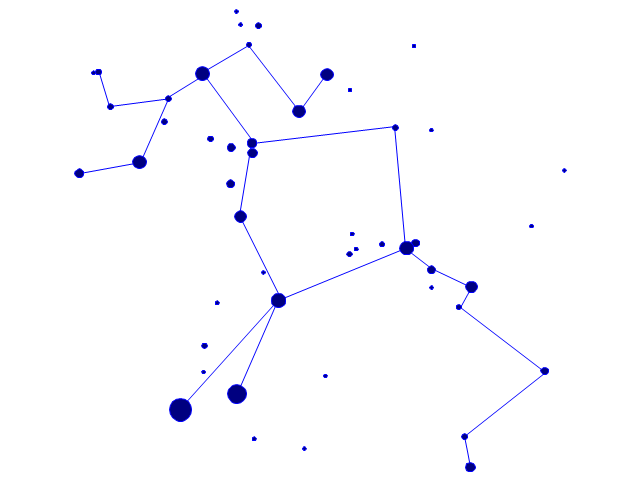
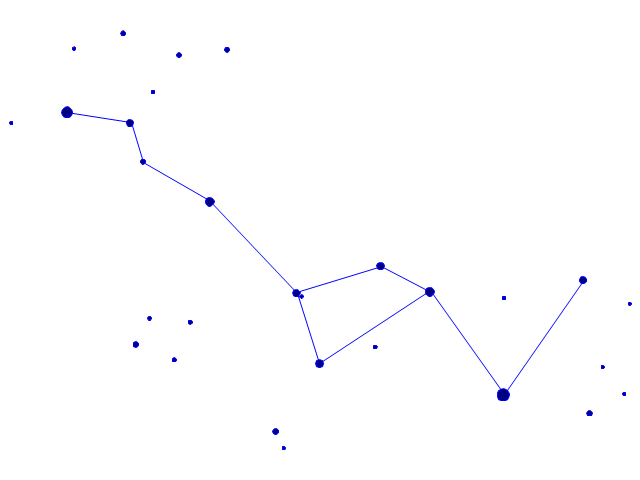
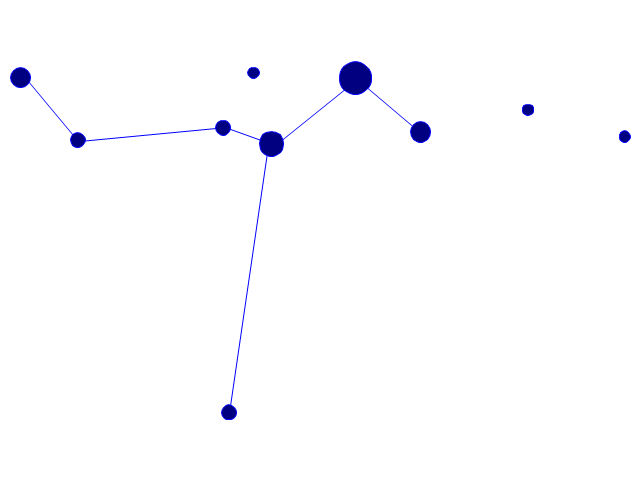
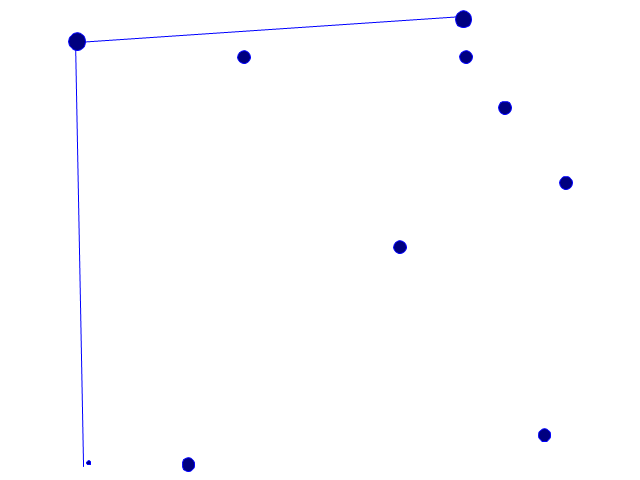
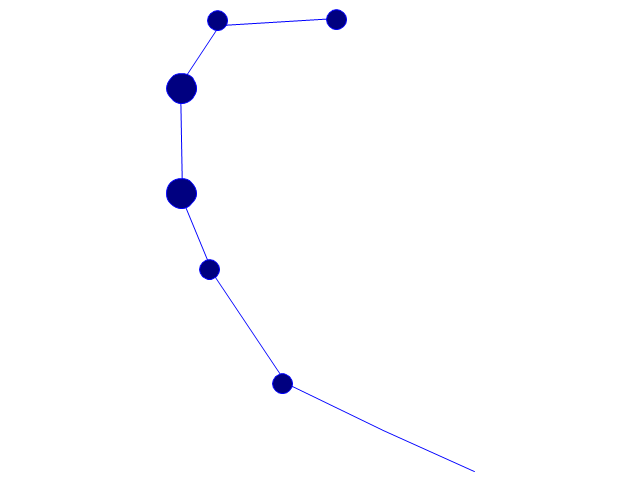
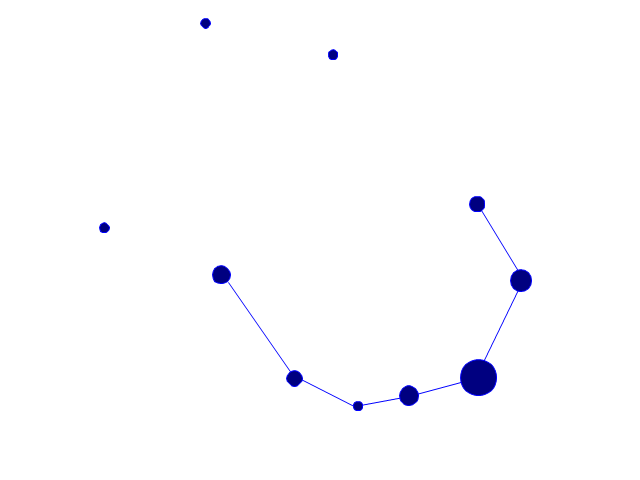
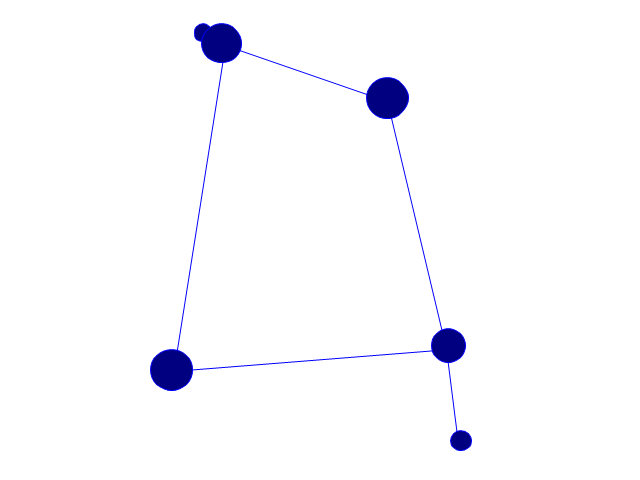
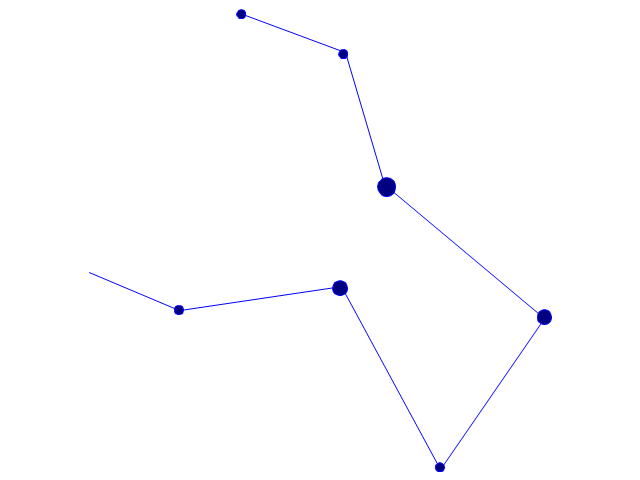
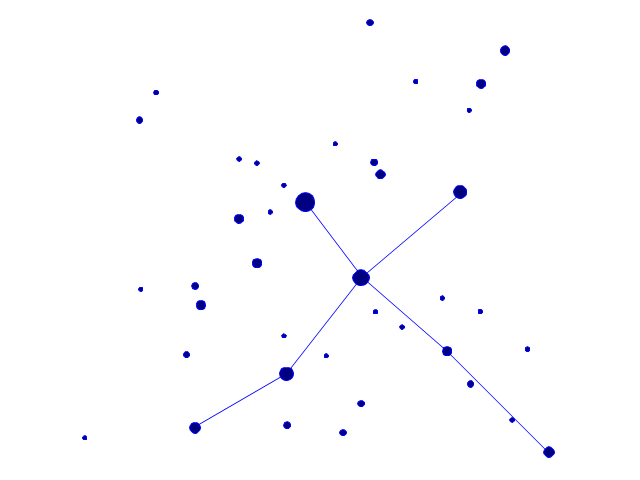
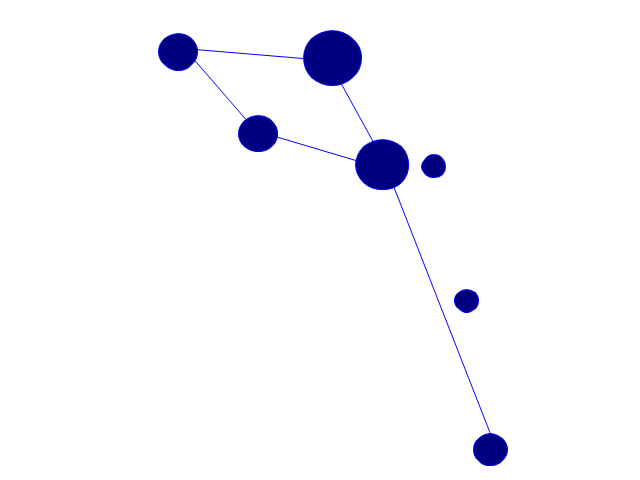
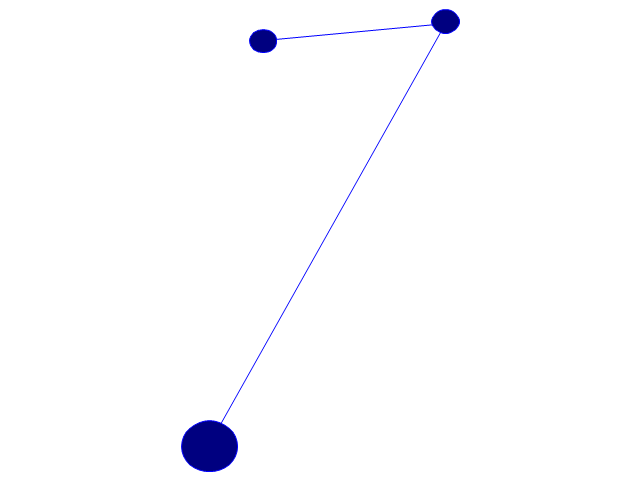
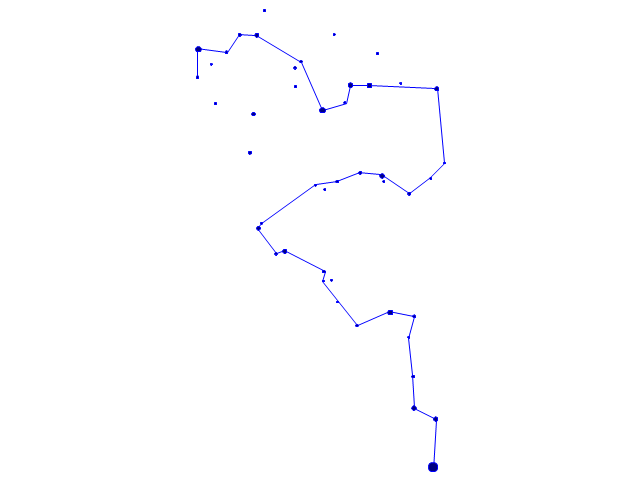
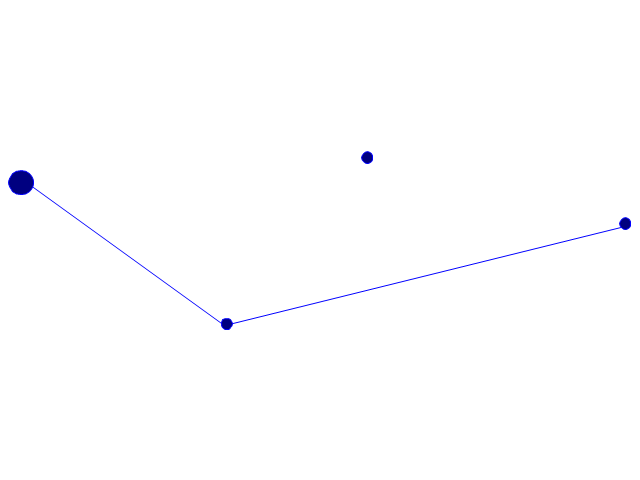
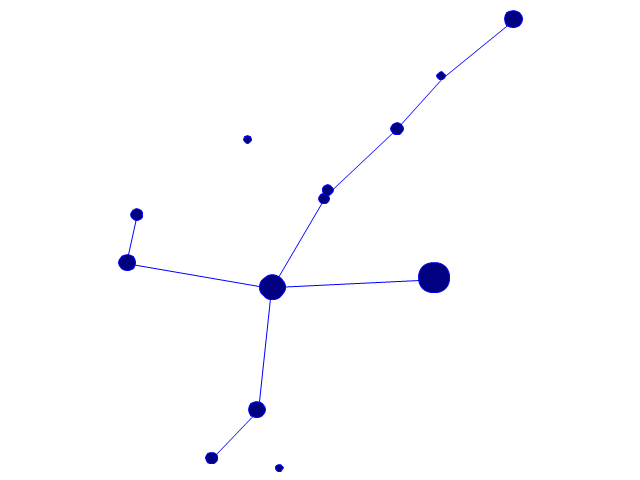
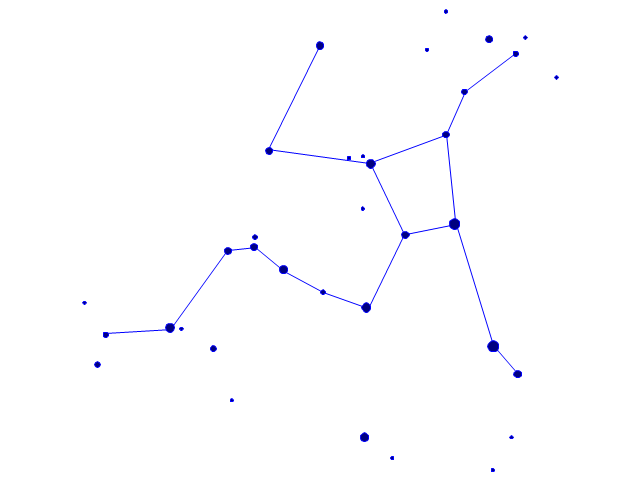
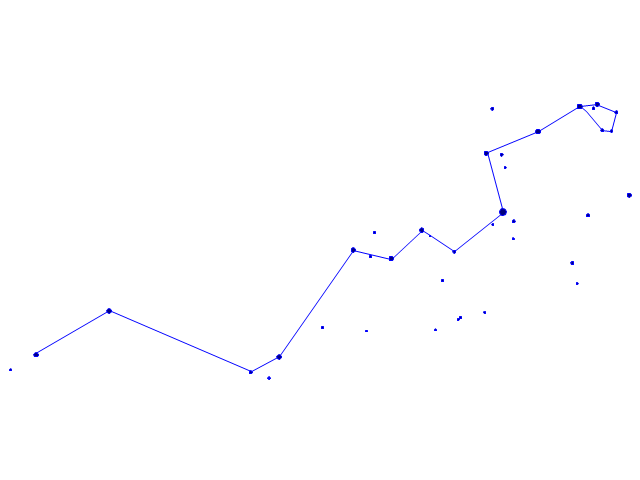
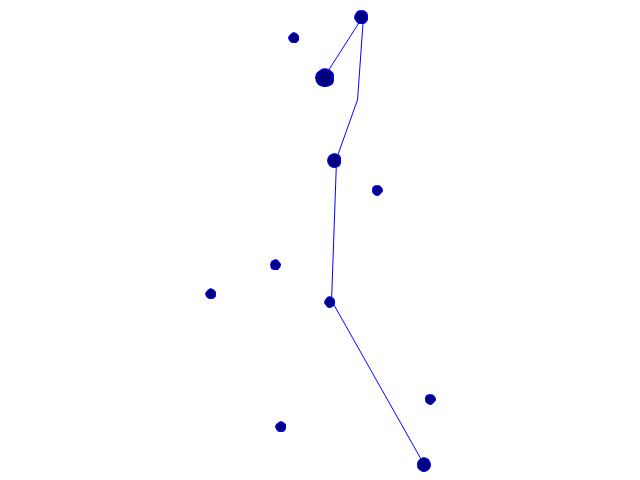
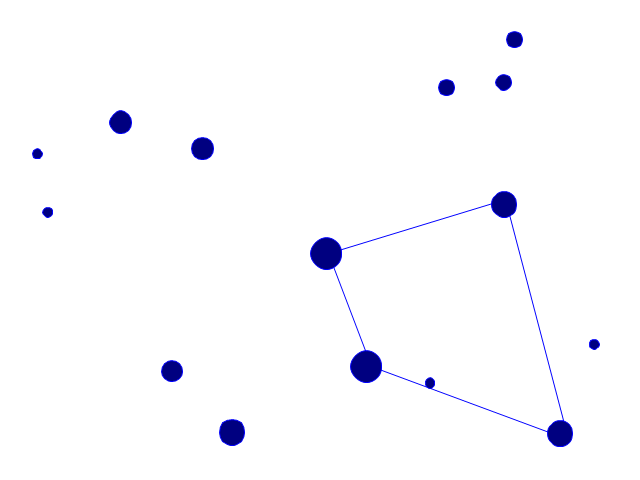
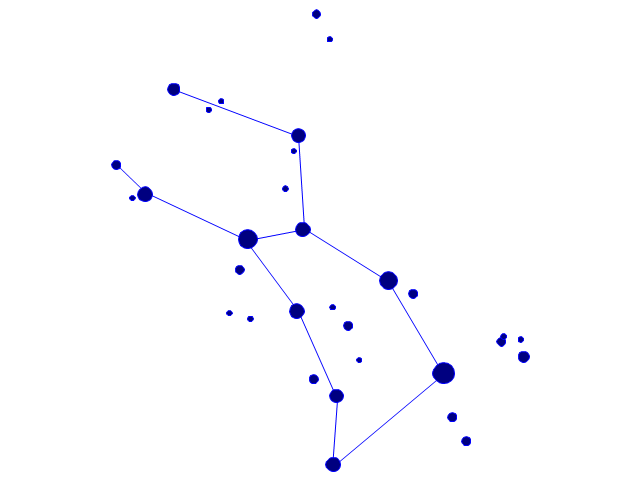
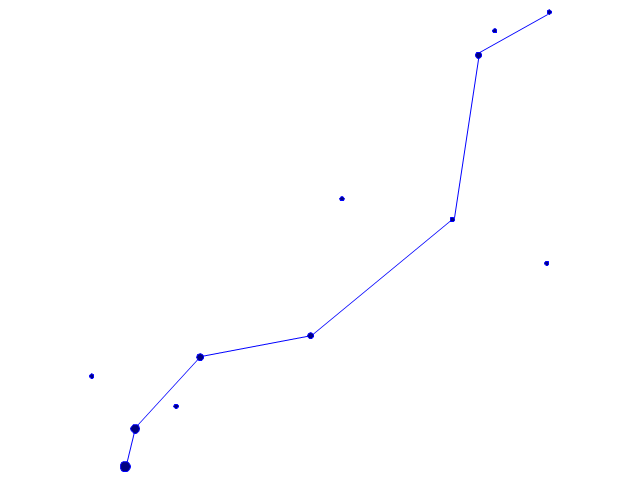
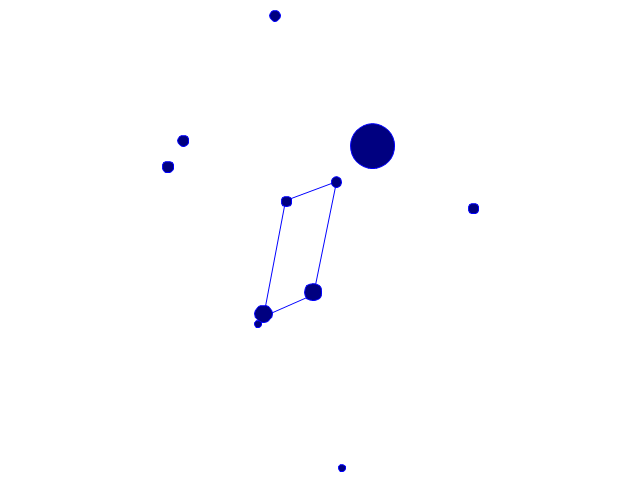
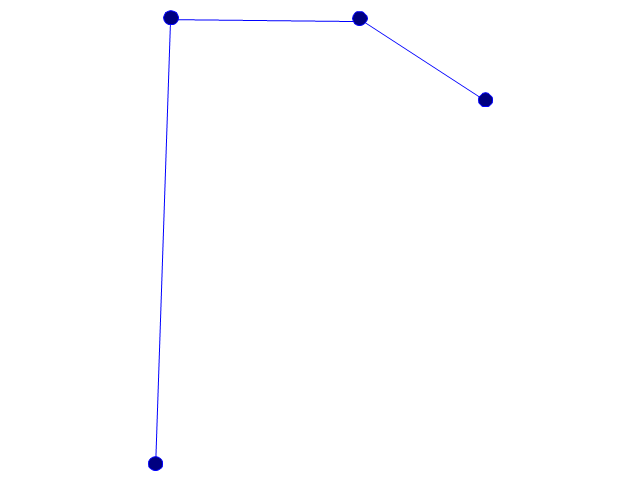
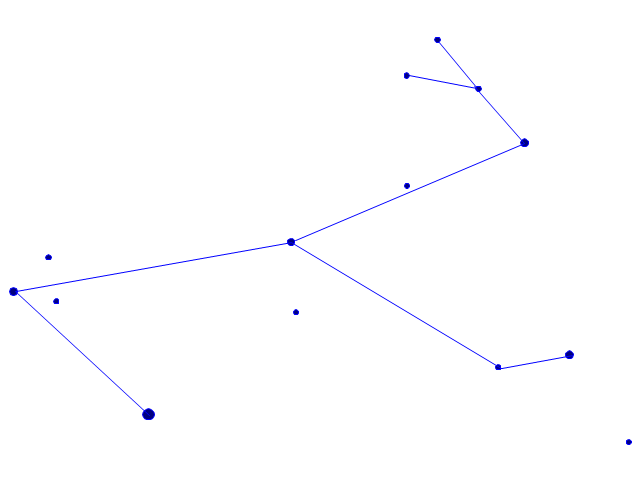
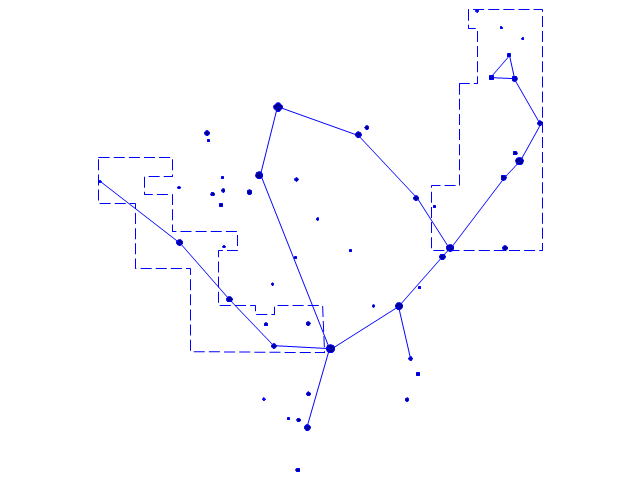
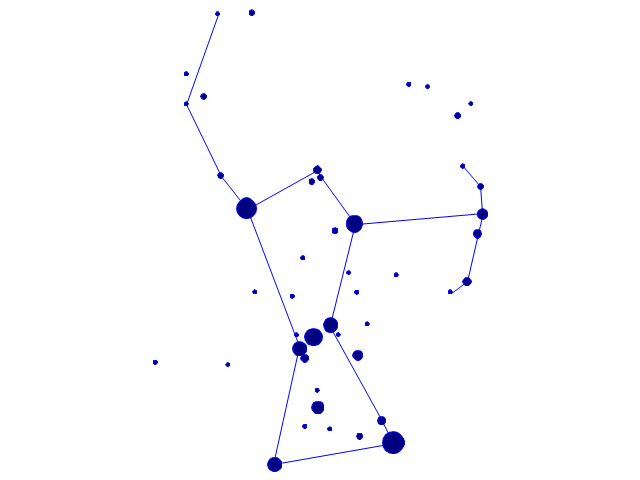
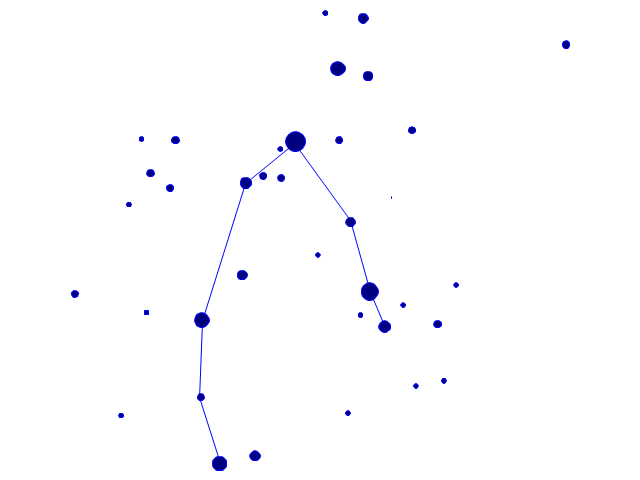
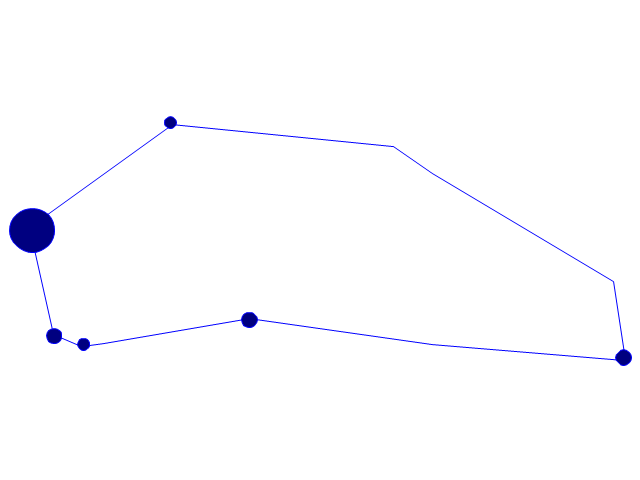
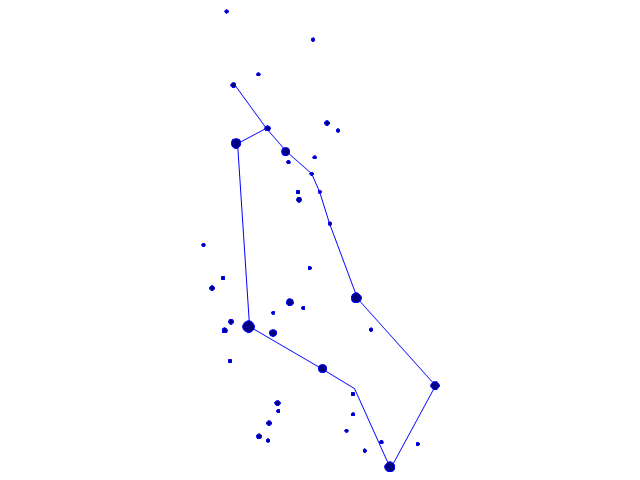
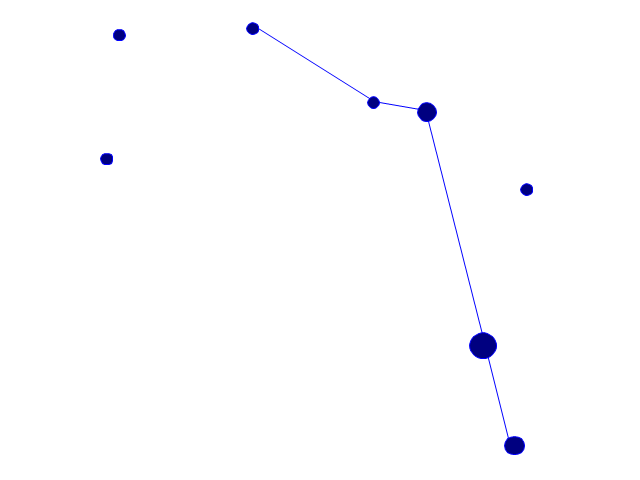
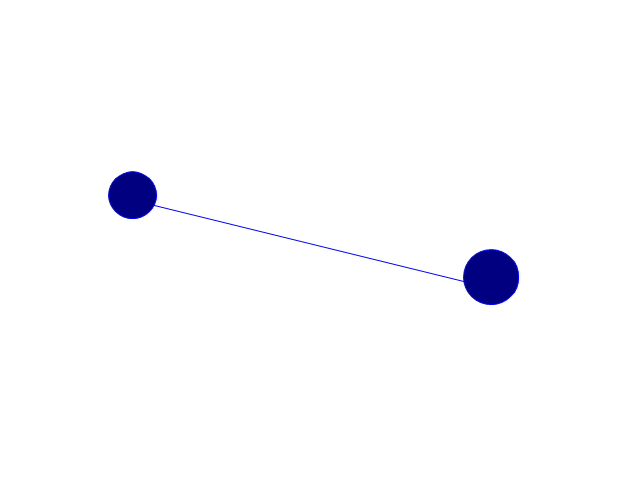
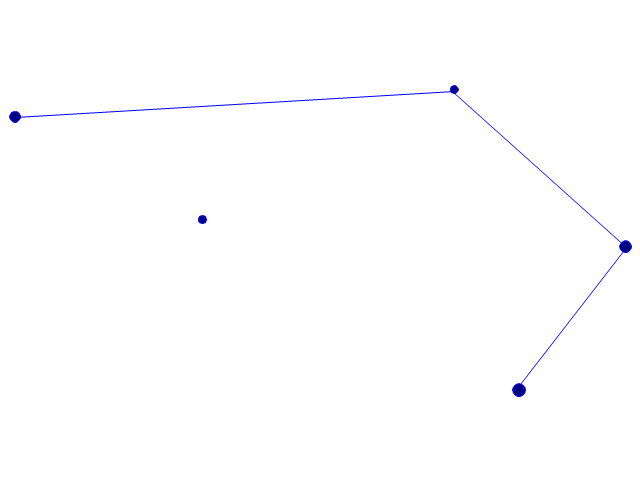
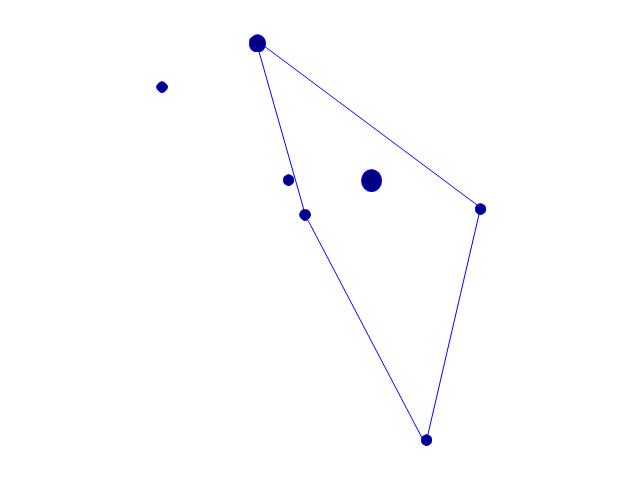
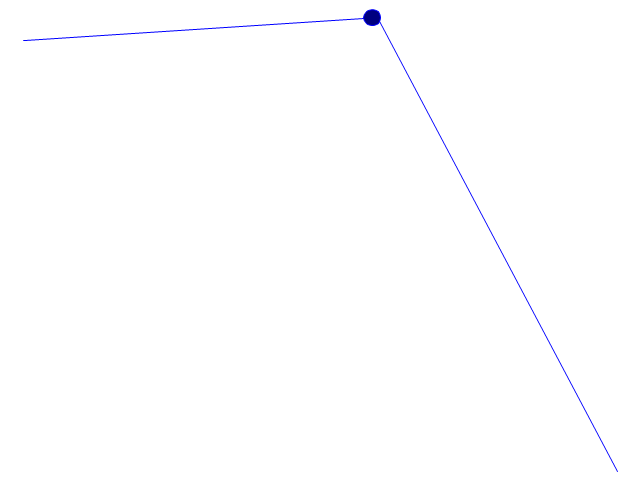
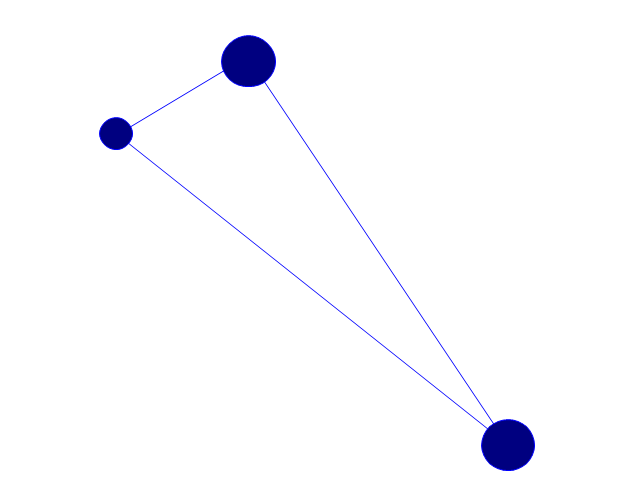
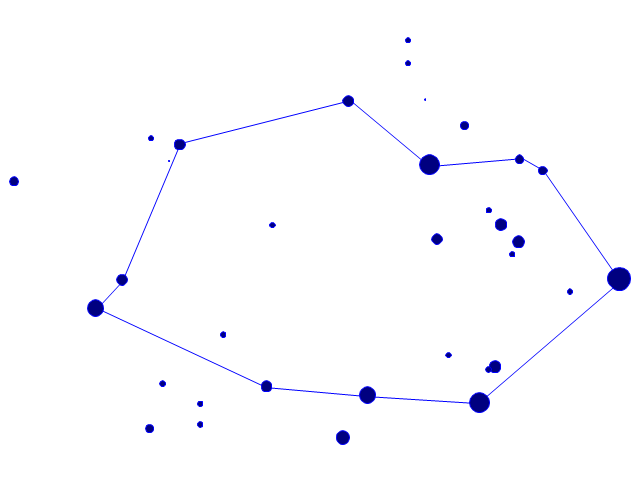
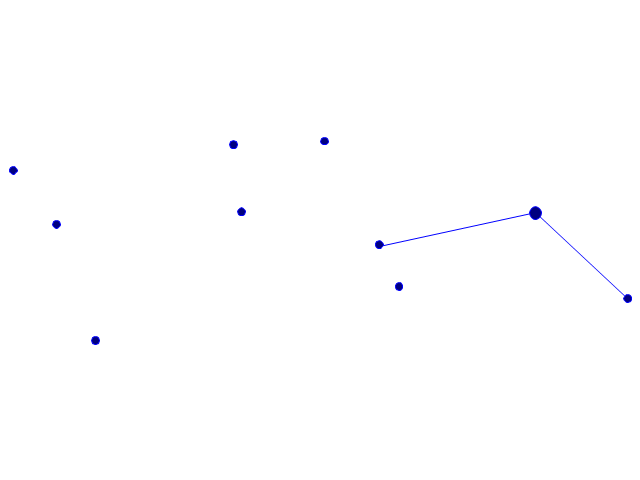
The vector stencils library "Constellations except Zodiac, Northern and Southern" contains 47 star constellation maps of all constellations except Zodiac, Northern (45-90 degrees) and Southern (45-90 degrees).
Use these shapes for drawing astronomical diagrams and illustrations in ConceptDraw PRO diagramming and vector drawing software extended with the Astronomy solution from the Science and Education area in ConceptDraw Solution Park.
Use these shapes for drawing astronomical diagrams and illustrations in ConceptDraw PRO diagramming and vector drawing software extended with the Astronomy solution from the Science and Education area in ConceptDraw Solution Park.
Audit Flowchart Symbols
The audit is a complex process consisting of defined quantity of steps, which have as a final goal the ensuring of success of a certain business project. It includes the independent examination of data, statements and financial performances of an enterprise for a stated purpose. It is convenient to construct the Audit Flowcharts or Audit Diagrams for visual representation and structuring the audit processes. ConceptDraw DIAGRAM diagramming software enhanced with Audit Flowcharts solution from the Finance and Accounting area of ConceptDraw Solution Park effectively helps to draw the Audit Diagrams for accounting, finance and money management, the Audit Flowcharts for fiscal information tracking, financial inventories and documenting Six Sigma, the decision making Flow Charts, etc. This solution provides the powerful drawing tools, numerous templates and samples, and large quantity of vector audit flowchart symbols that greatly facilitate the process of representation the audit steps and audit results, and designing efficient and visually appealing Audit Flowcharts.
 Education
This solution extends ConceptDraw DIAGRAM and ConceptDraw MINDMAP with specific content that helps illustrate educational documents, presentations, and websites quickly and easily with astronomy, chemistry, math and physics vector pictures and clip art.
Scientific Symbols Chart
ConceptDraw DIAGRAM is the beautiful design software that provides many vector stencils, examples and templates for drawing different types of illustrations and diagrams.Mathematics Solution from the Science and Education area of ConceptDraw Solution Park includes a few shape libraries of plane, solid geometric figures, trigonometrical functions and greek letters to help you create different professional looking mathematic illustrations for science and education.
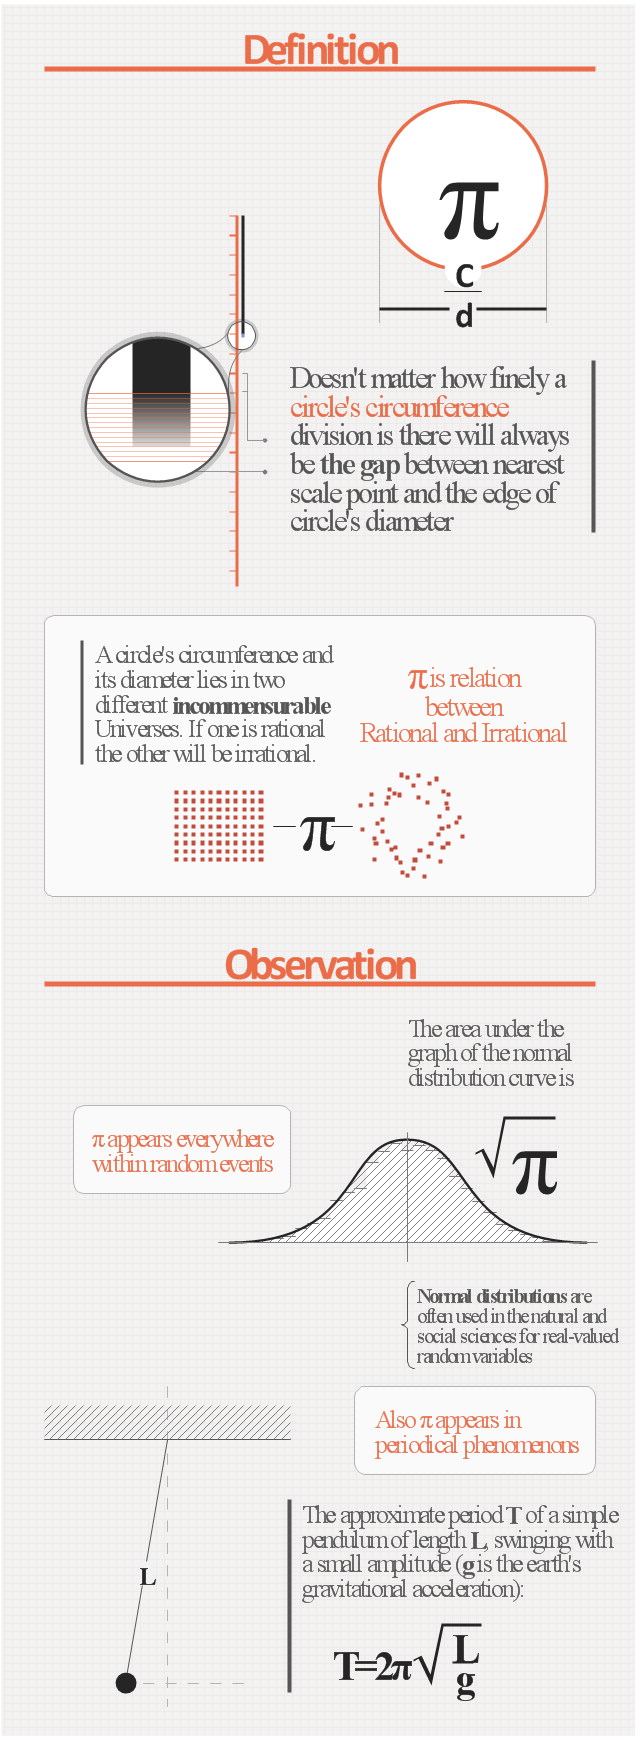
"The number π is a mathematical constant, the ratio of a circle's circumference to its diameter, commonly approximated as 3.14159. It has been represented by the Greek letter "π" since the mid-18th century, though it is also sometimes spelled out as "pi" (/ paɪ/ ).
Being an irrational number, π cannot be expressed exactly as a common fraction, although fractions such as 22/ 7 and other rational numbers are commonly used to approximate π. Consequently its decimal representation never ends and never settles into a permanent repeating pattern. The digits appear to be randomly distributed; however, to date, no proof of this has been discovered. Also, π is a transcendental number – a number that is not the root of any non-zero polynomial having rational coefficients. This transcendence of π implies that it is impossible to solve the ancient challenge of squaring the circle with a compass and straightedge.
For thousands of years, mathematicians have attempted to extend their understanding of π, sometimes by computing its value to a high degree of accuracy. Before the 15th century, mathematicians such as Archimedes and Liu Hui used geometrical techniques, based on polygons, to estimate the value of π. Starting around the 15th century, new algorithms based on infinite series revolutionized the computation of π. In the 20th and 21st centuries, mathematicians and computer scientists discovered new approaches that, when combined with increasing computational power, extended the decimal representation of π to, as of late 2013, over 12 trillion (10^13) digits. Scientific applications generally require no more than 40 digits of π so the primary motivation for these computations is the human desire to break records. However, the extensive calculations involved have been used to test supercomputers and high-precision multiplication algorithms." [Pi. Wikipedia]
The educational infogram "Pi" was created using the ConceptDraw PRO diagramming and vector drawing software extended with the Education Infographics solition from the area "Business Infographics" in ConceptDraw Solution Park.
Sales Process Flowchart Symbols
The most easier way of creating the visually engaging and informative Sales Process Flowchart is to create the new ConceptDraw document and to use the predesigned vector symbols offered in 6 libraries of the Sales Flowchart Solution. There are more than six types of sales process flow diagrams, ConceptDraw DIAGRAM software is flowchart maker which include six collections of extended flowchart symbols for effective diagramming. There are main collections of color coded flowchart symbols: Sales Department, Sales Steps, Sales Workflow, Sales Symbols and special set of Sales Arrows and Sales Flowchart.Physics Symbols
ConceptDraw DIAGRAM diagramming and vector drawing software extended with Physics solution from the Science and Education area is a powerful software for creating various physics diagrams. Physics solution provides all tools that you can need for physics diagrams designing. It includes 3 libraries with predesigned vector physics symbols: Optics Library, Mechanics Library and Nuclear Physics Library.Astronomy Symbols
Are you an astronomer, astronomy teacher or student? And you need to draw astronomy pictures quick and easy? ConceptDraw DIAGRAM diagramming and vector drawing software extended with Astronomy solution from the Science and Education area will help you! Astronomy solution provides 7 libraries with wide variety of predesigned vector objects of astronomy symbols, celestial bodies, solar system symbols, constellations, etc.Mathematics Symbols
ConceptDraw DIAGRAM extended with Mathematics solution from the Science and Education area is a powerful diagramming and vector drawing software that offers all needed tools for mathematical diagrams designing. Mathematics solution provides 3 libraries with predesigned vector mathematics symbols and figures: Solid Geometry Library, Plane Geometry Library and Trigonometric Functions Library.Mathematical Diagrams
ConceptDraw DIAGRAM diagramming and vector drawing software extended with Mathematics solution from the Science and Education area is the best for creating: mathematical diagrams, graphics, tape diagrams various mathematical illustrations of any complexity quick and easy. Mathematics solution provides 3 libraries: Plane Geometry Library, Solid Geometry Library, Trigonometric Functions Library.Process Flow Chart
A Process Flow Chart is a type of flowchart which is mostly used in industrial, chemical and process engineering for illustrating high-level processes, major plant processes and not shows minor details. ConceptDraw DIAGRAM diagramming and vector drawing software extended with Flowcharts Solution from the "Diagrams" Area of ConceptDraw Solution Park is the best way to create Process Flow Chart and other types of flowcharts.- Design elements - Greek letters | Education | Scientific Symbols ...
- ABC - Vector stencils library | Greek Letter Capital Alpha
- Design elements - Greek letters | Artwork | How to Draw a Natural ...
- Design elements - Greek letters | ABC - Vector stencils library ...
- Design elements - Greek letters | Geo Map - Europe - Italy | Geo Map ...
- Free Sentence Diagrammer | Greek Letters Font
- Typographic Artwork
- Constellations except Zodiac, Northern and Southern - Vector ...
- Constellations except Zodiac, Northern and Southern - Vector ...
- English Letters
- Mathematical Diagrams | Mathematics | Mathematics Symbols ...
- Pi - Education infogram | Nuclear physics - Vector shapes library ...
- Mathematics Symbols | Mathematical Diagrams | Basic Flowchart ...
- Basic Diagramming | Basic Flowchart Symbols and Meaning ...
- Biology Drawing Software | Physics Diagrams | Scientific Symbols ...
- Basic Flowchart Symbols and Meaning | Chemistry Symbols and ...
- ABC - Vector stencils library | Design elements - Callouts | Design ...
- Mathematics | Mathematics Symbols | Mathematical Diagrams ...
- Scientific Symbols Chart | Basic Flowchart Symbols and Meaning ...
- Basic Diagramming | Mathematical Diagrams | Mathematics ...
