Sales Growth. Bar Graphs Example

TQM Diagram Example

Basic Diagramming


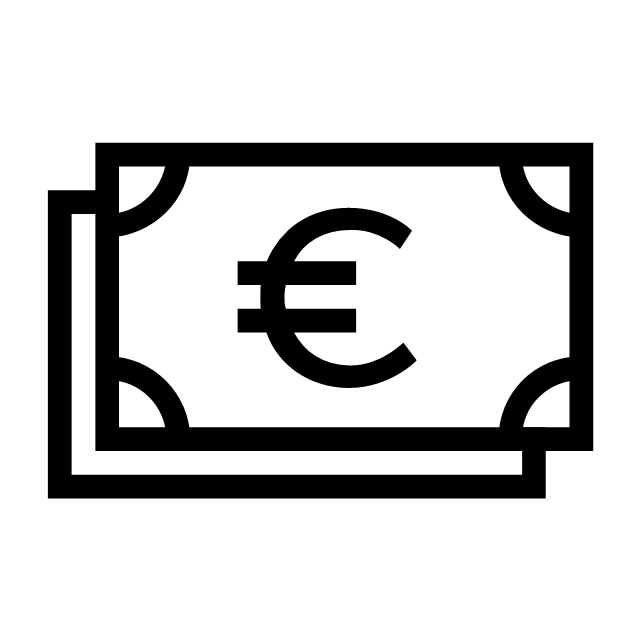
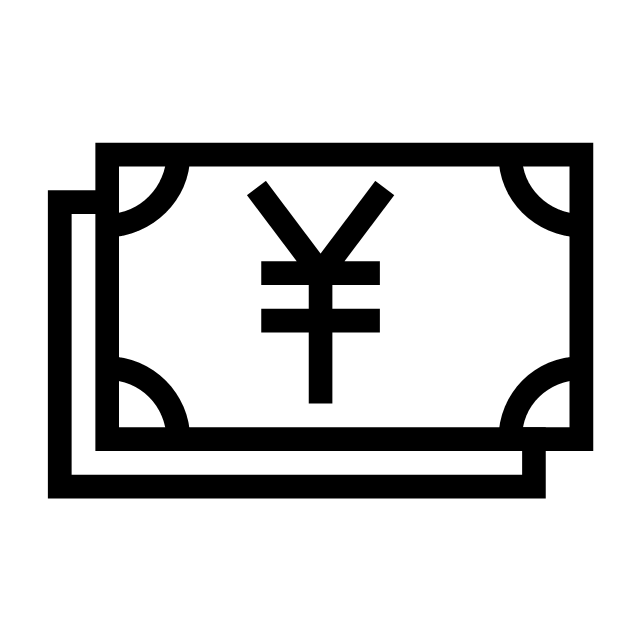
The vector stencils library "Currency" contains 28 currency and money icons.
Use it to design your business and finance illustrations and infographics with ConceptDraw PRO diagramming and vector drawing software.
The vector stencils library "Currency" is included in the Business and Finance solution from the Illustration area of ConceptDraw Solution Park.
Use it to design your business and finance illustrations and infographics with ConceptDraw PRO diagramming and vector drawing software.
The vector stencils library "Currency" is included in the Business and Finance solution from the Illustration area of ConceptDraw Solution Park.
Dollar

Euro

Pound

Yen

Dollar banknotes

Euro banknotes
Pound banknotes

Yen banknotes
Coins

Money bags

Money in jar

Credit cards

Money box

Financial transaction

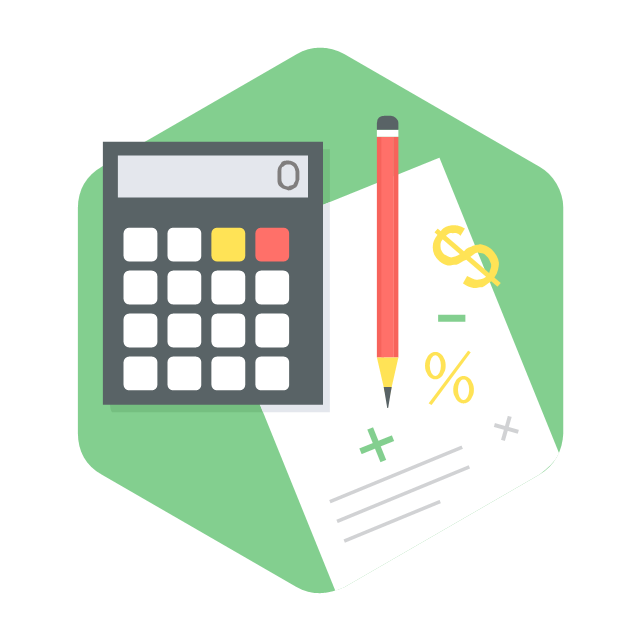
Calculation
Budget measures

Financial growth

Cash register finance calculation

Electronic funds

Credit card payment

Cash payment

Donation

Cheque book

Invoice

Money management

Time is money

Estimate

Financial security

Create Process Flowcharts

Best Vector Drawing Application for Mac OS X

The vector clipart library "Presentation design elements" contains 45 presentation symbols and arrows which you can easy use in your slides and illustrations.
"A presentation is the process of presenting a topic to an audience. It is typically a demonstration, lecture, or speech meant to inform, persuade, or build good will. ... the use of visuals reduced meeting times... audiences believe presenters who use visuals are more professional and credible than presenters who merely speak. ... meetings and presentations reinforced with visuals help participants reach decisions and consensus more quickly." [Presentation. Wikipedia]
The clip art example "Presentation design elements - Vector clipart library" was created in the ConceptDraw PRO diagramming and vector drawing software using the Presentation Clipart solution from the Illustration area of ConceptDraw Solution Park.
Advance Direction Sign

Circuit

Growth

Master Link

Comparison

Plus

Minus

Multiplication

Division

Loupe

Plus sign

Minus sign

Pros and Cons

Balance Lever

Balance

Scientific Research

Business People

Hand

Financial Growth

Wallet

Increase

Decrease

Clock

Mechanism

Interaction

Small Company

Big Company

Company Expansion

Foreign Market Entry

Time

Close Cooperation

Company

Company Merger

Company Extension

Foreign Market Penetration

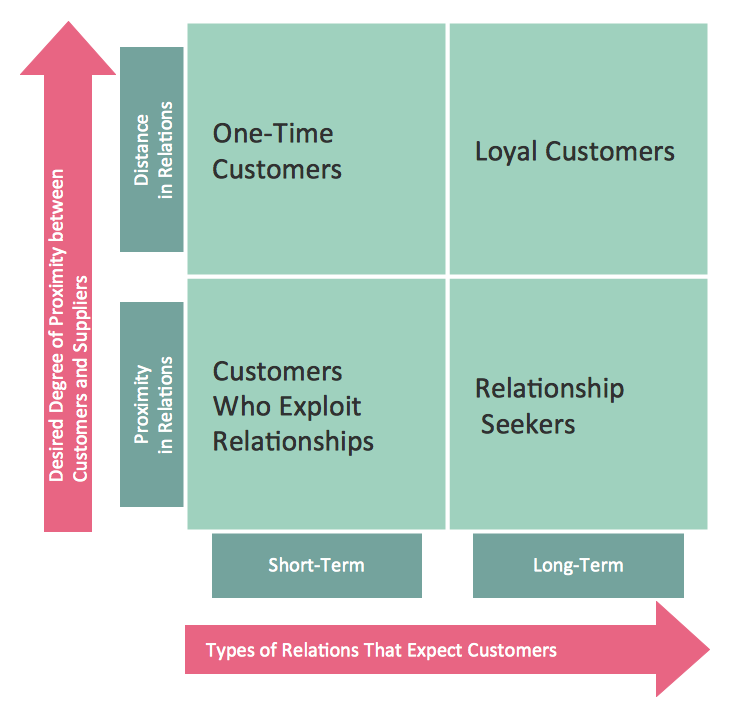
Business Relations

Profits

Frame 1

Frame 2

Background 1

Background 2

Background 3

Background 4

Background 5

Title block

Matrices
Polar Graph

HelpDesk
How to Make an Ansoff Matrix Template

Draw Flowcharts with ConceptDraw

How To use House Electrical Plan Software


The vector stencils library "HR department" contains 50 workflow symbols.
Use this department icon set to draw your HR process flowcharts, workflow diagrams and infographics with the ConceptDraw PRO diagramming and vector drawing software.
The HR pictograms library "HR department" is included in the HR Flowcharts solution from the Management area of ConceptDraw Solution Park.
Accounting

Accounts payable

Accounts receivable

Audit

Bank

Board of directors

Career center

Copy center

Customer service operator

Customer service technician

Data center

Delivery

Design

Devices management

Distribution

Distribution 2

Employee

Engineering

Facilities

Finance

Human resource

Information services

Information systems

International division

International marketing

International sales

Inventory

Legal department

Mail room

Mail service

Management

Manufacturing

Marketing

Motorpool

Online service

Packaging

Payroll

Publications

Purchasing

Quality assurance

Receiving

Reception

Research and development

Scales

Sales growth

Security

Shipping

Suppliers

Telecommunication

Warehouse

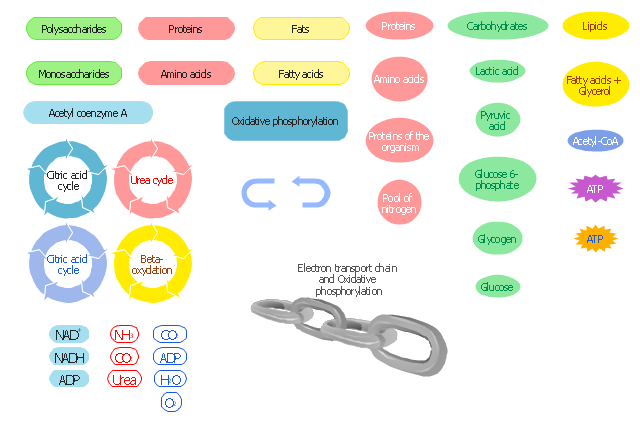
The vector stencils library " Biochemistry of metabolism" contains 46 metabolite symbols for drawing metabolic pathways maps, biochemical diagrams and metabolism process flow charts using the ConceptDraw PRO diagramming and vector drawing software.
"Metabolites are the intermediates and products of metabolism. The term metabolite is usually restricted to small molecules. Metabolites have various functions, including fuel, structure, signaling, stimulatory and inhibitory effects on enzymes, catalytic activity of their own (usually as a cofactor to an enzyme), defense, and interactions with other organisms (e.g. pigments, odorants, and pheromones). A primary metabolite is directly involved in normal "growth", development, and reproduction. Alcohol is an example of a primary metabolite produced in large-scale by industrial microbiology. A secondary metabolite is not directly involved in those processes, but usually has an important ecological function. Examples include antibiotics and pigments such as resins and terpenes etc. ...
The metabolome forms a large network of metabolic reactions, where outputs from one enzymatic chemical reaction are inputs to other chemical reactions." [Metabolite. Wikipedia]
The shapes example "Design elements - Biochemistry of metabolism" is included in the Biology solution from the Science and Education area of ConceptDraw Solution Park.
Metabolic pathway symbols
Bar Diagrams for Problem Solving. Create manufacturing and economics bar charts with Bar Graphs Solution

- Career Growth Symbol
- Sales Dashboards for Your Company | Sales Growth . Bar Graphs ...
- Bar Diagram Math | Rainfall Bar Chart | Sales Growth . Bar Graphs ...
- Sales Growth . Bar Graphs Example | Sales Process Flowchart ...
- Sales Growth . Bar Graphs Example | Sales Process Flowchart ...
- Sales Growth . Bar Graphs Example | Chart Maker for Presentations ...
- Percentage Pie Chart. Pie Chart Examples | Sales Growth . Bar ...
- Sales Growth . Bar Graphs Example | Create Graphs and Charts ...
- Process Flowchart | Sales Growth . Bar Graphs Example | Top 5 ...
- Sales Growth . Bar Graphs Example | TQM Diagram Example ...
- Sales Growth . Bar Graphs Example | Sales Dashboard | Line Chart ...
- Sales Growth . Bar Graphs Example | Bar Diagrams for Problem ...
- Bar Graphs | Picture Graphs | Line Graphs | Graphs
- Sales Growth . Bar Graphs Example | Bar Chart Examples | Online ...
- Create Graphs and Charts | Sales Growth . Bar Graphs Example ...
- Bar Diagrams for Problem Solving. Create business management ...
- Multiplication Symbol Clip Art
- Pie Chart Software | Create Graphs and Charts | Sales Growth . Bar ...
- Business Report Pie. Pie Chart Examples | Percentage Pie Chart ...
- Bar Graphs | Sales Growth . Bar Graphs Example | Line Graphs ...