HelpDesk
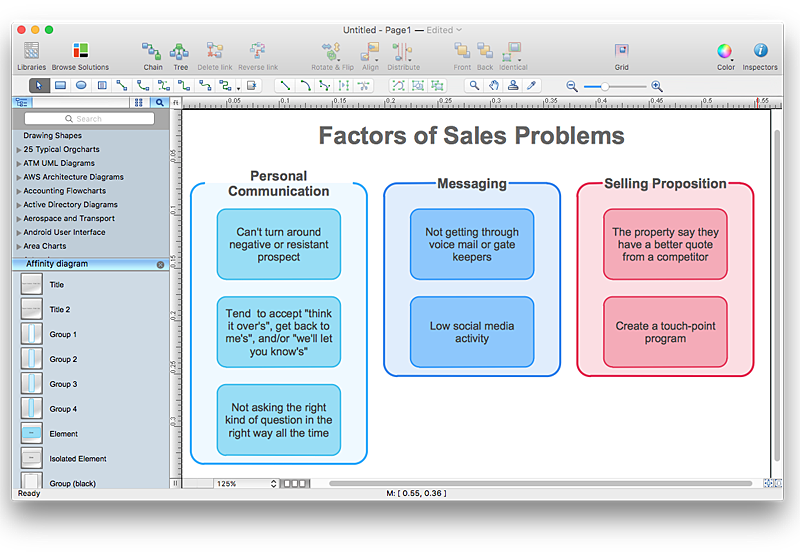
How To Create an Affinity Diagram Using ConceptDraw Office
Affinity diagram is designed to prepare the data for further analysis of the cause-effect relationships.The Affinity diagram shows the structure of large, complex factors that have an influence on a problem, and then divides them up into a smaller and simpler structure. We recommend using a mind map for Brainstorming and collecting the factors affecting the problem. The ability to create an Affinity diagram from a mind map is supported by the ConceptDraw Seven Management and Planning Tools solution.HelpDesk
How to Create a Fault Tree Analysis Diagram (FTD) in ConceptDraw PRO
Fault Tree Diagram are logic diagram that shows the state of an entire system in a relationship of the conditions of its elements. Fault Tree Diagram are used to analyze the probability of functional system failures and safety accidents. ConceptDraw PRO allows you to create professional Fault Tree Diagrams using the basic FTD symbols. An FTD visualize a model of the processes within a system that can lead to the unlikely event. A fault tree diagrams are created using standard logic symbols . The basic elements in a fault tree diagram are gates and events.HelpDesk
How To Create Root Cause Analysis Diagram Using ConceptDraw Office
Root Cause Analysis (RCA) is used to determine the main causes of the problem. If the certain factor is the root cause, this mean that its vanishing will help to prevent the further recurrence of the problem. Root Cause Analysis diagram is used to analyze the root causes of factors that influence the problem. It helps to identify the root causes for a factor and then propose possible corrective actions. A diagram is constructed separately for each high priority factor. The ability to create a RCA tree diagram from a mind map is supported by the ConceptDraw Seven Management and Planning Tools solution.
 Fault Tree Analysis Diagrams
This solution extends ConceptDraw PRO v9.5 or later with templates, fault tree analysis example, samples and a library of vector design elements for drawing FTA diagrams (or negative analytical trees), cause and effect diagrams and fault tree diagrams.
- Affinity diagram - Template | How To Create an Affinity Diagram ...
- How To Create an Affinity Diagram Using ConceptDraw Office ...
- Affinity Diagram | How To Create an Affinity Diagram Using ...
- PROBLEM ANALYSIS. Root Cause Analysis Tree Diagram | How To ...
- PDPC | Affinity Diagram | How To Create Risk Diagram (PDPC ...
- How To Create an Affinity Diagram Using ConceptDraw Office ...
- Seven Management and Planning Tools | How To Create an Affinity ...
- How To Create an Affinity Diagram Using ConceptDraw Office ...
- Root cause analysis tree diagram - Template | PROBLEM ...
- How To Create an Affinity Diagram Using ConceptDraw Office ...
- Root cause analysis tree diagram - Template | How To Create Root ...
- Decision tree diagram | Marketing Diagrams | How To Create Root ...
- Cause and Effect Analysis | Fault Tree Analysis Diagrams | How To ...
- How To Create Cause Tree Diagram
- CORRECTIVE ACTIONS PLANNING. Risk Diagram (PDPC) | How ...
- Affinity Diagram | Affinity Diagram Software | Affinity diagram ...
- PROBLEM ANALYSIS. Root Cause Analysis Tree Diagram ...
- Root cause analysis tree diagram - Template | Cause and Effect ...
- PROBLEM ANALYSIS. Root Cause Analysis Tree Diagram | How to ...


