 25 Typical Orgcharts
The 25 Typical Orgcharts solution contains powerful organizational structure and organizational management drawing tools, a variety of professionally designed organization chart and matrix organization structure samples, 25 templates based on various orga
HelpDesk
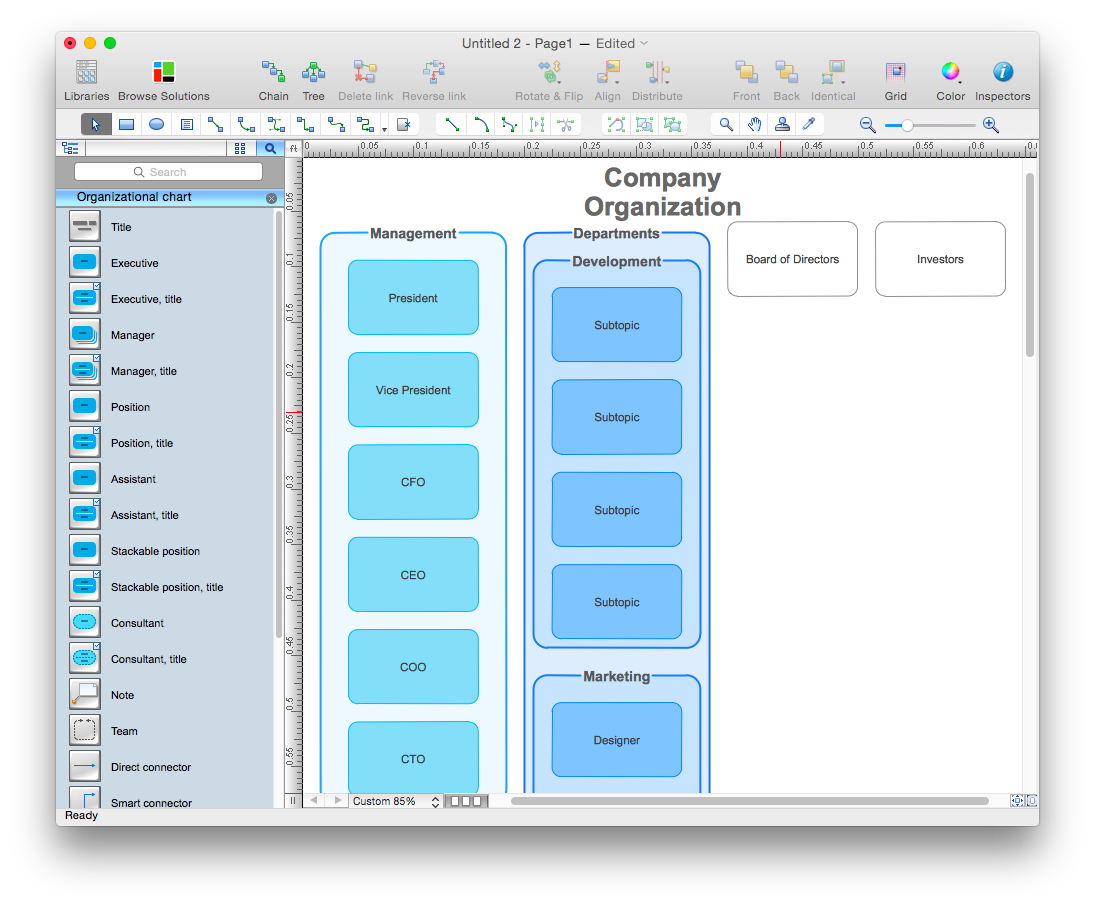
How to Create Organizational Chart Using Management Solution
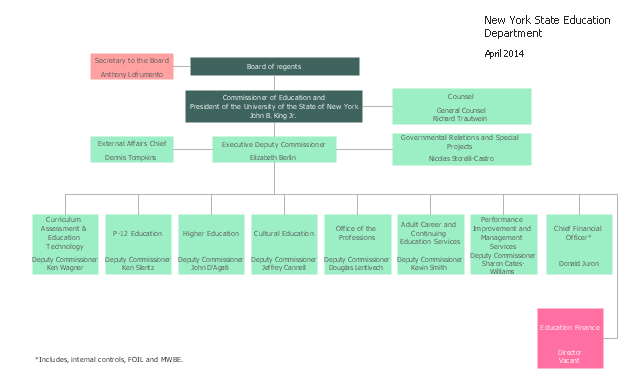
Use ConceptDraw MINDMAP for generating structured data on organization structure and then ConceptDraw PRO for presenting the results as chart.This organization chart sample was created on the base of the figure from the website of New York State Education Department (NYSED).
"The New York State Education Department is part of the University of the State of New York (USNY), one of the most complete, interconnected systems of educational services in the United States."
[oms.nysed.gov/ orgchart/ ]
The organizational chart example "New York State Education Department" was created using the ConceptDraw PRO diagramming and vector drawing software extended with the Organizational Charts solution from the Management area of ConceptDraw Solution Park.
Cubetto Flowchart
Create flowcharts in a breath with Cubetto Flow on your iPad and iPhone wherever you are.
 ConceptDraw Solution Park
ConceptDraw Solution Park collects graphic extensions, examples and learning materials
 Management Area
The solutions from Management area of ConceptDraw Solution Park collect templates, samples and libraries of vector stencils for drawing the management diagrams and mind maps.
HelpDesk
How to Draw a Pyramid Diagram in ConceptDraw PRO
Pyramid diagram (triangle diagram) is used to represent data, which have hierarchy and basics. Due to the triangular form of diagram, each pyramid section has a different width. The width of the segment shows the level of its hierarchy. Typically, the top of the pyramid is the data that are more important than the base data. Pyramid scheme can be used to show proportional and hierarchical relationships between some logically related items, such as departments within an organization, or successive elements of any process. This type of diagram is often used in marketing to display hierarchical related data, but it can be used in a variety of situations. ConceptDraw PRO allows you to make a pyramid diagram, quickly and easily using special libraries.- Organizational Charts with ConceptDraw PRO | How to Draw an ...
- Organizational Structure | Organizational Charts with ConceptDraw ...
- Data structure diagram with ConceptDraw PRO | Organizational ...
- Organizational Charts with ConceptDraw PRO | How to Draw an ...
- How to Draw an Organization Chart | Organizational Structure ...
- Horizontal Org Flow Chart | ConceptDraw PRO - Organizational ...
- Venn Diagram Examples for Problem Solving. Computer Science ...
- Development of software with ConceptDraw PRO | Organizational ...
- Active Directory Domain Services diagram | Data structure diagram ...
- Pyramid Diagram | Venn Diagram Examples for Problem Solving ...
- Flowcharts | Cross-Functional Process Map Template | Data Flow ...
- Pyramid Chart Examples | Pyramid Diagram | DIKW hierarchy - 3D ...
- ConceptDraw PRO - Organizational chart software | Examples of ...
- Pyramid Diagram | Pyramid Diagram | Pyramid Diagram | Chart Of
- Organizational Chart Template | Horizontal Org Flow Chart ...
- Organizational Structure | Business diagrams & Org Charts with ...
- Organizational Chart Template | ConceptDraw PRO - Organizational ...
- Pyramid Chart Examples | Knowledge hierarchy triangle diagram ...
- Venn Diagram Examples for Problem Solving. Computer Science ...


