Venn Diagram Examples for Problem Solving. Computer Science. Chomsky Hierarchy
A Venn diagram, sometimes referred to as a set diagram, is a diagramming style used to show all the possible logical relations between a finite amount of sets. In mathematical terms, a set is a collection of distinct objects gathered together into a group, which can then itself be termed as a single object. Venn diagrams represent these objects on a page as circles or ellipses, and their placement in relation to each other describes the relationships between them. The Venn diagram example below visualizes the the class of language inclusions described by the Chomsky hierarchy.Hierarchical Network Topology
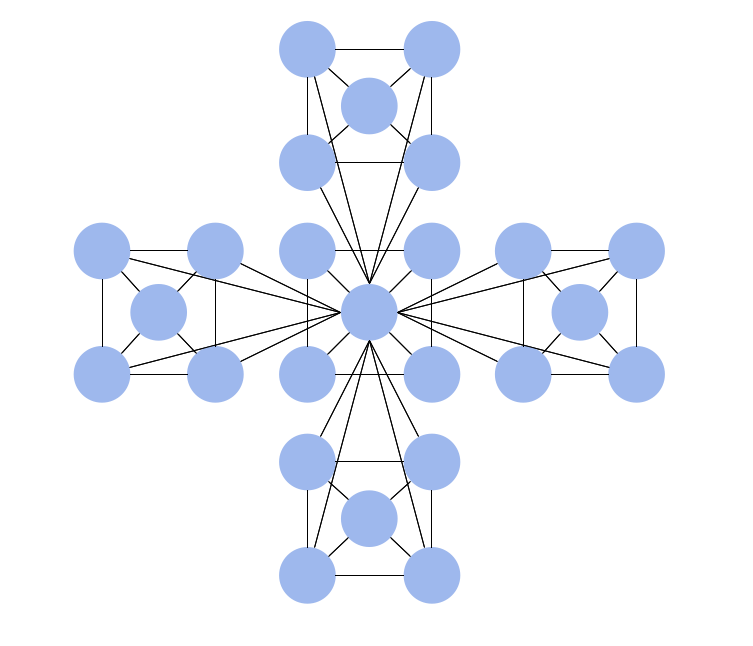
This sample was created in ConceptDraw PRO diagramming and vector drawing software using the Computer and Networks solution from Computer and Networks area of ConceptDraw Solution Park. This sample shows the Hierarchical network topology. A Hierarchical network topology interconnects multiple groups that are located on the separate layers to form a larger network. Each layer concentrates on the specified functions, this allows to choose the right equipment for the layer.Venn Diagram Examples for Problem Solving
Venn diagrams are illustrations used in the branch of mathematics known as set theory. They show the mathematical or logical relationship between different groups of things (sets). A Venn diagram shows all the possible logical relations between the sets.Venn Diagram Maker
ConceptDraw PRO diagramming and vector drawing software extended with Venn Diagrams solution from the "Diagrams" area of ConceptDraw Solution Park is a powerful Venn Diagram maker. Create fast and easy your own Venn Diagrams to visualize: all the possible logical relations between sets, simple set relationships in logic, statistics, mathematics, sociology, marketing, summarize the status and future viability of a project.Pyramid Chart Examples
Pyramid Charts and Triangle Diagrams are used to visually structure the topics and progressively order the quantitative data. They allow to illustrate hierarchical structure of the topics, proportional, interconnected and containment relations among the topics. The multilevel Pyramids and Triangle diagrams are constructed oriented up or down and divided into several horizontal slices. They are effectively used to represent marketing strategies, social strategies, information systems, market value, etc., to illustrate presentations, websites, documents, reports in business, finances, sales, management, marketing, media, training, consulting, and many other fields. To maximize the efficiency in drawing the Pyramid Charts, use the ConceptDraw PRO diagramming and vector drawing software extended with Pyramid Diagrams solution from Marketing area, which contains the set of Pyramid Chart examples, samples, templates and vector design elements of triangular diagrams and pyramids with different quantity of levels for various needs.HelpDesk
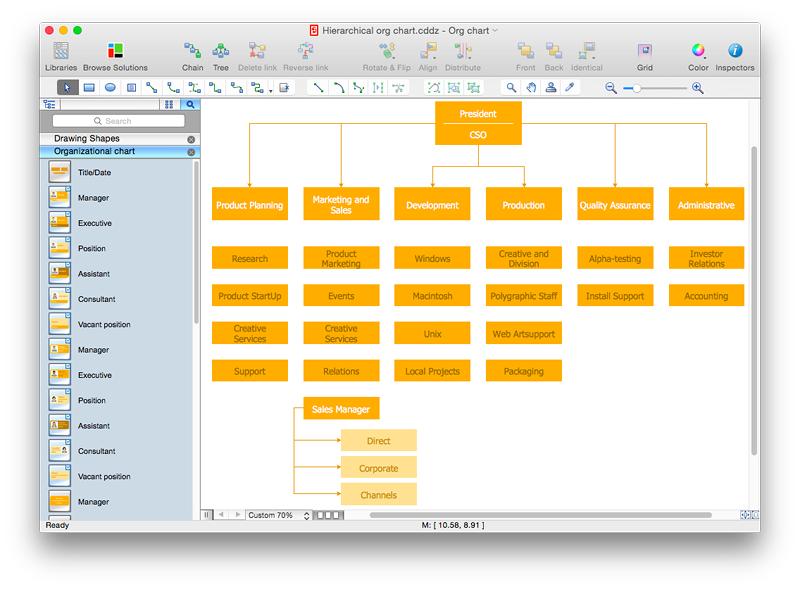
How to Draw a Hierarchical Organizational Chart with ConceptDraw PRO
There are a number of different organisational structures. The most appropriate structure will depend on the size of the business and the type of business. A hierarchical organizational structure is one of the most typical organizational structure. This structure can be represented as a pyramid, with a single entity in authority at the top, with subsequent levels of power beneath them. Each member of the pyramid reports only to their direct subordinates or superiors, limiting the amount of communication overhead, which can be seen both as an asset or a limitation. It is easy to see where a hierarchical structure would be an effective solution; companies that have offices based in disparate locations, a business that focuses on diversified markets, any organization with need for multiple levels of middle management. You can easily create a clear hierarchical organizational chart using ConceptDraw solution that contains templates of the 25 Typical Orgcharts.Examples of Flowcharts, Org Charts and More
ConceptDraw PRO covers a broad spectrum of business graphics categories and offers at ConceptDraw STORE enormous online collection of pictorial examples and samples for different thematics and application areas. It is a plentiful source of inspiration and wonderful examples of professionally designed diagrams, flowcharts, UML diagrams, organizational charts, databases, ERDs, network diagrams, business charts, different thematic charts, schematics, infographics and plans developed specially for knowledge workers, engineers, managers, businessmen, marketing specialists, analytics, scientists, students, professors, journalists and also for a large number of other people that every day use various diagrams and drawings in their work and life activity. Each of these examples is a real art, all they are well thought-out and designed without efforts with help of powerful tools of ConceptDraw PRO software. ConceptDraw examples display all variety of tasks, possibilities and results that ConceptDraw Product Line lets achieve fast and easy. ConceptDraw is one of the best Visio alternatives for Mac. It open all Visio formats like .vsdx, .vss, .vdx files and allows you to export files to Visio formats.
Data Flow Diagram Symbols. DFD Library
Data Flow Diagrams graphically represent the information transfers and process steps of a system. They visually depict how data are processed by a system in terms of inputs and outputs, how occurs the input in a system, how the data flow through an information system and where they are stored, and how occurs output from the system. DFDs give the overview of the system and models the processes aspects, they are maintained with other methods of structured systems analysis. The main goal of DFDs is achievement of understanding between developers and users. For their construction are used two notations - Gane-Sarson and Yourdon, each of them uses its own set of symbols. Data Flow Diagrams solution from Software Development area extends the ConceptDraw PRO software with templates, samples, and predesigned libraries of data flow diagram symbols for both notations, allowing you easy design the process-oriented and data-oriented models, draw the Data Flow Diagrams, Data Flowcharts, Data Process Diagrams, Information Flow Diagrams, Structured Analysis Diagrams, etc.The vector stencils library "HR symbols" contains 45 HR pictograms.
Use this icon set with HR symbols to draw your HR flowcharts, workflow diagrams, process charts and infographics with the ConceptDraw PRO diagramming and vector drawing software.
The HR pictograms library "HR symbols" is included in the HR Flowcharts solution from the Management area of ConceptDraw Solution Park.
Program Structure Diagram
Program Structure Diagram - The Software Development solution from ConceptDraw Solution Park provides the stensils libraries of language level shapes and memory objects for drawing the structural diagrams of programs and memory objects using the ConceptDraw PRO diagramming and vector drawing software.- Venn Diagram Examples for Problem Solving . Computer Science ...
- Block Diagrams | Hierarchical Network Topology | Venn Diagram ...
- Venn Diagram Examples for Problem Solving . Computer Science ...
- Hierarchical Diagram Of The Computer System
- Network Gateway Router | Construct A Hierarchical Diagram Of ...
- Hierarchical Diagram Of The Computer
- Network Gateway Router | Pyramid Diagrams | Computer Hierarchy ...
- Venn Diagram Examples for Problem Solving . Computer Science ...
- Network Drawing Software | Draw Hierarchy In Computer
- Hierarchical Diagram Showing The Different Components Of The

