HelpDesk
How to Draw a Histogram

The vector stencils library "Histograms" contains 8 templates of histograms for visualizing frequency distribution data.
Drag a template from the library to your document and enter your data.
Use these shapes to draw your histograms in ConceptDraw PRO diagramming and vector drawing software.
The vector stencils library "Histograms" is included in the Histograms solution from the Graphs and Charts area of ConceptDraw Solution Park.
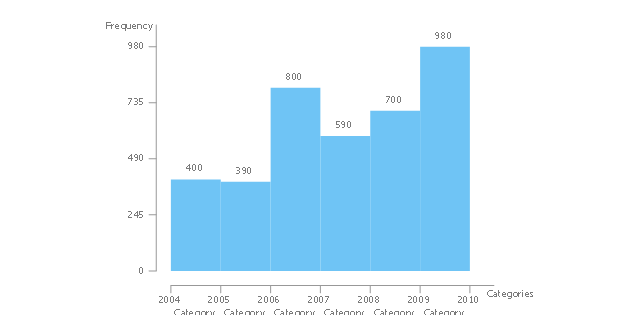
Frequency histogram
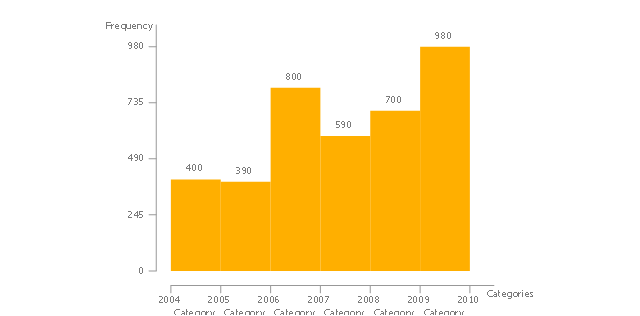
Frequency histogram 2
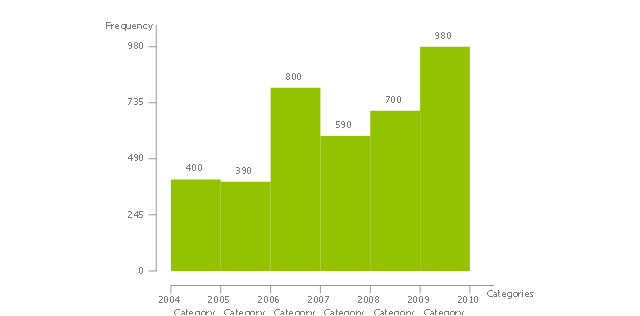
Frequency histogram 3
Frequency histogram (table)
-histograms---vector-stencils-library.png--diagram-flowchart-example.png)
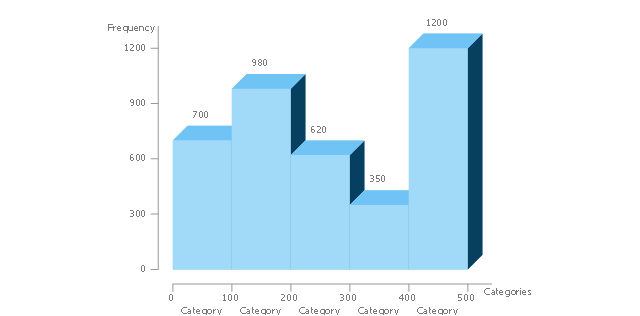
3D frequency histogram
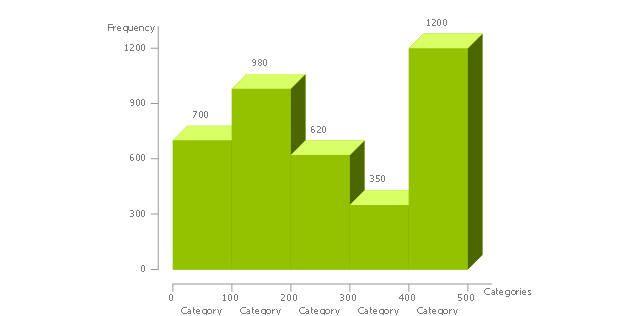
3D frequency histogram 2
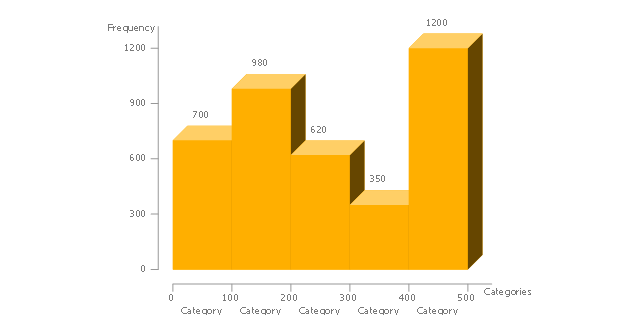
3D frequency histogram 3
3D frequency histogram (table)
-histograms---vector-stencils-library.png--diagram-flowchart-example.png)
The vector stencils library "Histograms" contains 8 templates of histograms for visualizing frequency distribution data.
Drag a template from the library to your document and enter your data.
Use these shapes to draw your histograms in ConceptDraw PRO diagramming and vector drawing software.
The vector stencils library "Histograms" is included in the Histograms solution from the Graphs and Charts area of ConceptDraw Solution Park.
Drag a template from the library to your document and enter your data.
Use these shapes to draw your histograms in ConceptDraw PRO diagramming and vector drawing software.
The vector stencils library "Histograms" is included in the Histograms solution from the Graphs and Charts area of ConceptDraw Solution Park.
Frequency histogram
Frequency histogram 2
Frequency histogram 3
Frequency histogram (table)
3D frequency histogram
3D frequency histogram 2
3D frequency histogram 3
3D frequency histogram (table)
 Histograms
How to make a Histogram? Making a Histogram is an incredibly easy process when it is done with ConceptDraw DIAGRAM. The Histograms Solution enhances ConceptDraw DIAGRAM functionality with extensive drawing tools, numerous samples, and examples; also a quick-start template and library of ready vector stencils for visualization the data and professional drawing Histograms.
 Basic Diagramming
This solution extends ConceptDraw DIAGRAM software with the specific tools you need to easily draw flowcharts, block diagrams, histograms, pie charts, divided bar diagrams, line graphs, circular arrows diagrams, Venn diagrams, bubble diagrams and concept maps
Pyramid Diagram

Chart Examples

Pyramid Diagram

Examples of Flowcharts, Org Charts and More


Bar Chart Software

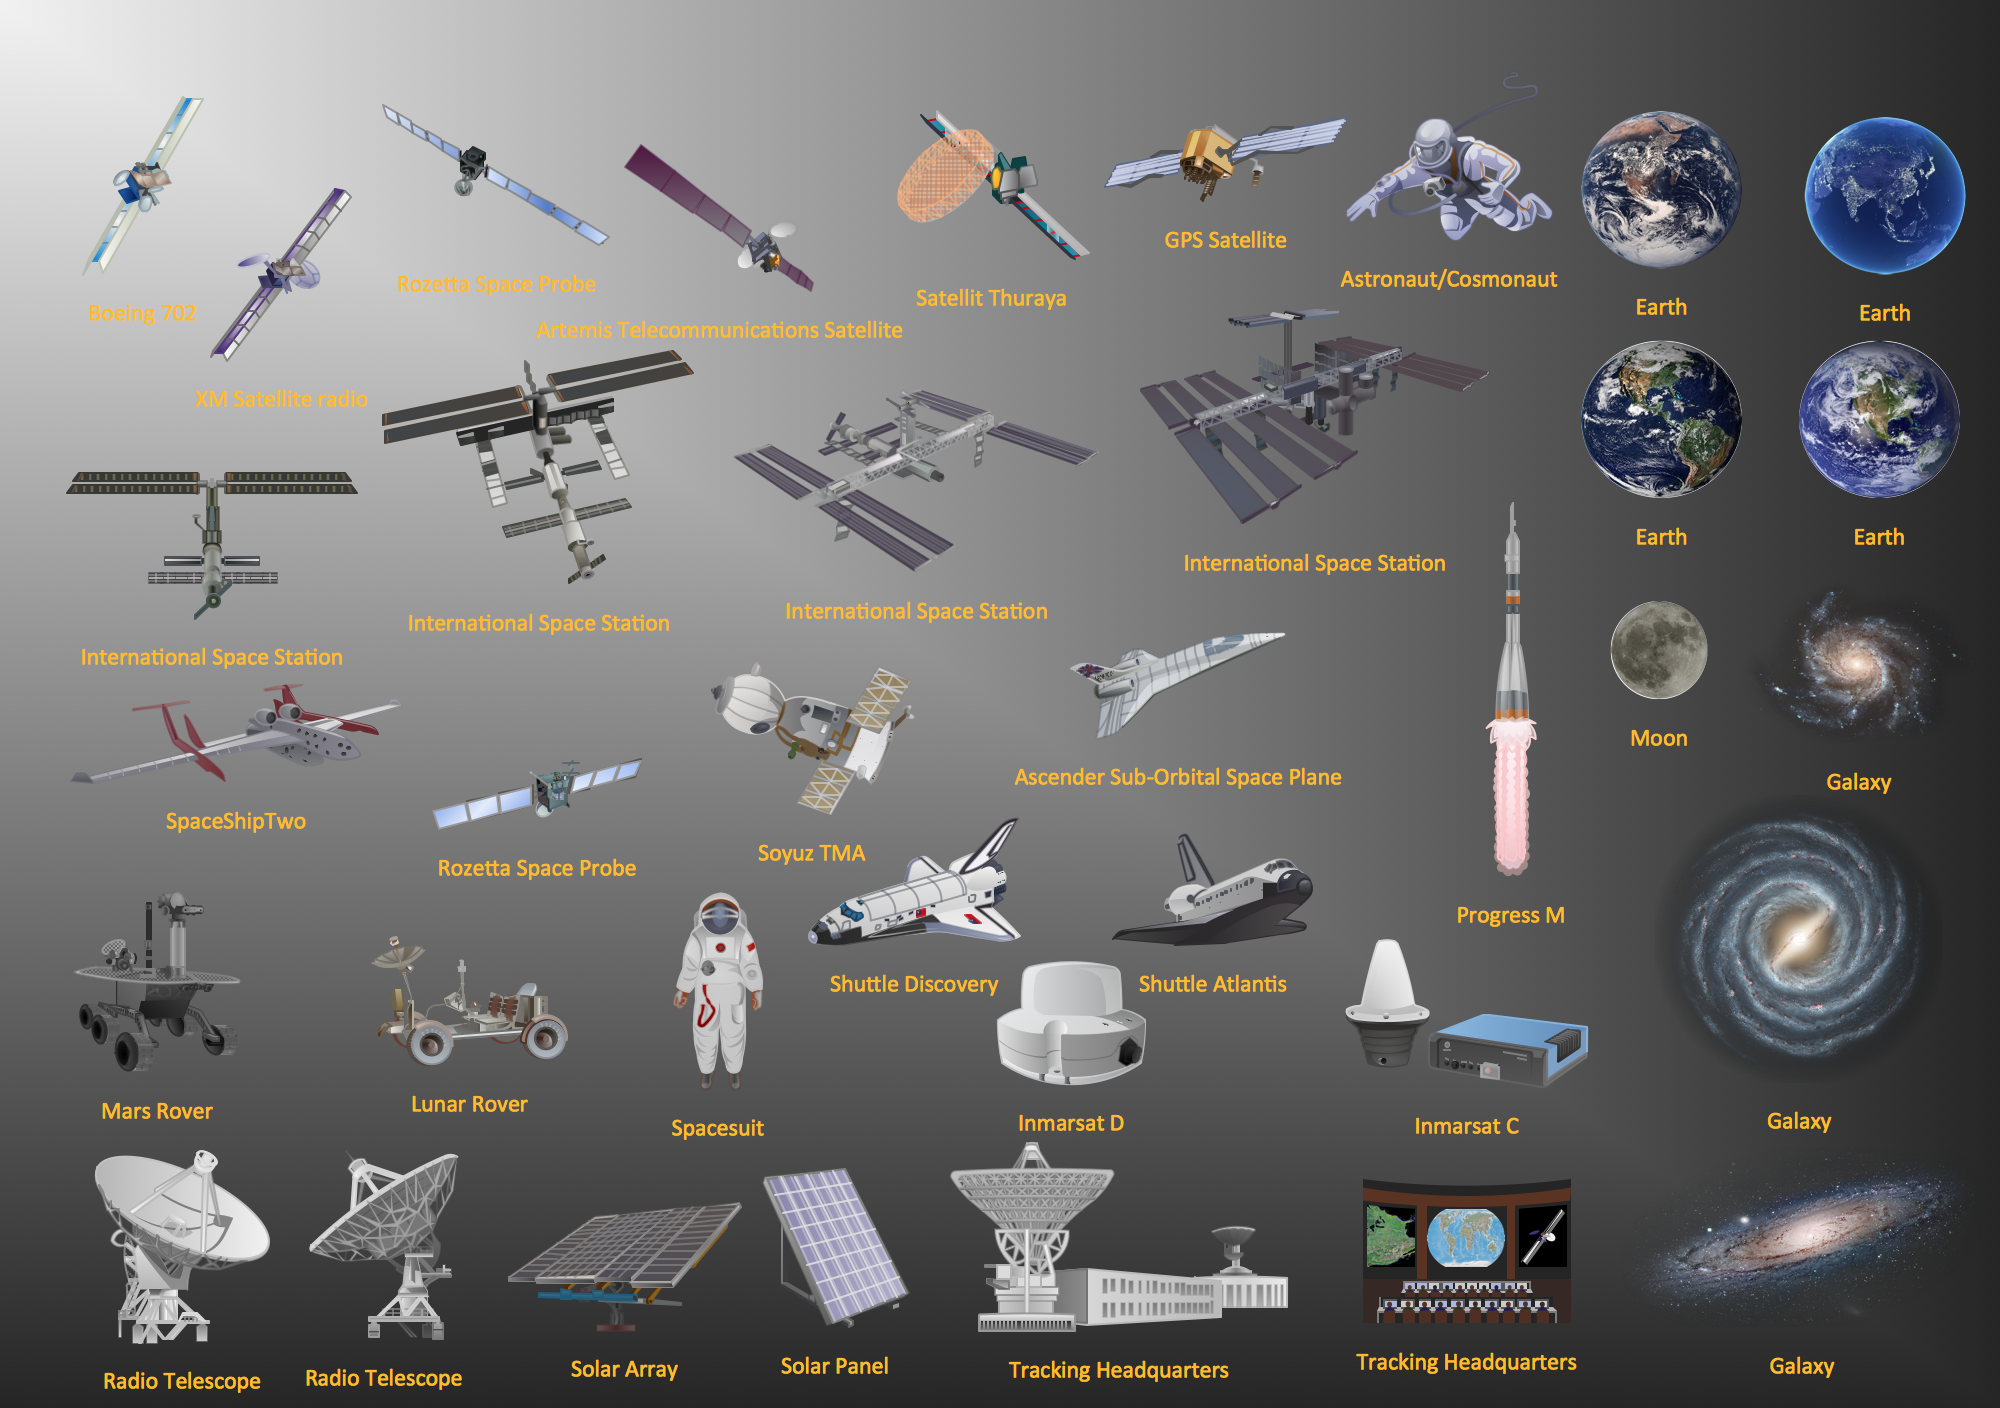
Aerospace - Design Elements
 Directional Maps
Directional Maps solution extends ConceptDraw DIAGRAM software with templates, samples and libraries of vector stencils for drawing the directional, location, site, transit, road and route maps, plans and schemes.
- Histogram 3d
- Histograms - Vector stencils library | Design elements - Histogram ...
- Directional Maps | How to Draw a Histogram in ConceptDraw PRO ...
- 3D Block diagram - Template | Basic Diagramming | Block Diagrams ...
- Histograms - Vector stencils library
- Histograms - Vector stencils library | How to Draw a Histogram in ...
- 3D frequency histogram 2
- Histograms - Vector stencils library
- 3D frequency histogram
- Histograms - Vector stencils library | Graphs and Charts Area ...
- Histograms | How To Make a Histogram ? | How to Draw a Histogram ...
- Histograms - Vector stencils library
- Pyramid diagrams - Vector stencils library | Histograms - Vector ...
- 3D Block diagram - Template | Block Diagram | Basic Diagramming ...
- 3D Network Diagram Software | Directional Maps | Pyramid Diagram ...
- Histogram Chart | Make a Histogram | Histogram | Histogram Visio
- Design elements - Histogram | Histogram | How To Make Histogram ...
- Drawing Bubble Diagrams In 3d
- Shapes 3d