Bar Graph
You need to draw the Bar Graph? The automated tool can be useful for you. ConceptDraw PRO diagramming and vector drawing software extended with Bar Graphs solution from Graphs and Charts area of ConceptDraw Solution Park will help you create any Bar Graph.Bar Chart Software
The best bar chart software ever is ConceptDraw. ConceptDraw bar chart software provides an interactive bar charting tool and complete set of predesigned bar chart objects.Chart Maker for Presentations
Easy charting software comes with beautiful chart templates and examples. This makes it easy to create professional charts without prior experience.How Do You Make a Histogram?
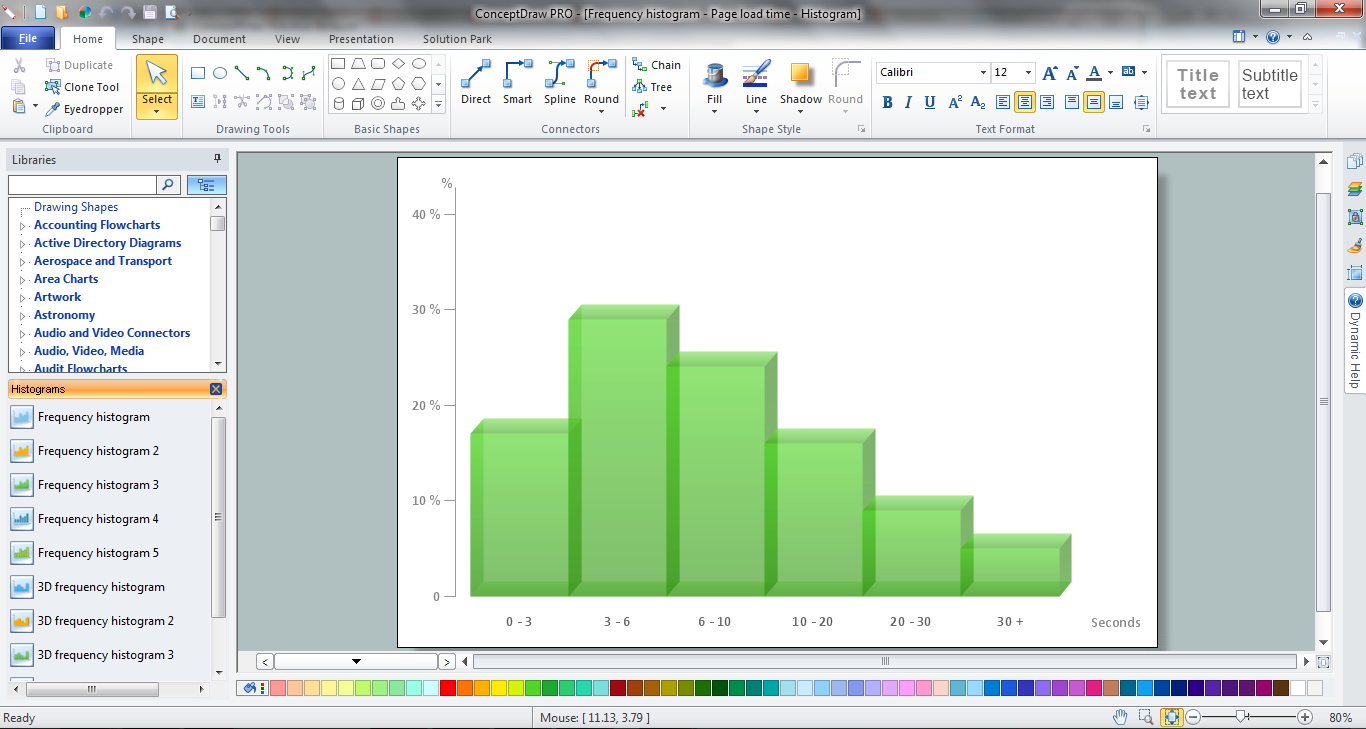
How do you make a histogram usually? Drawing of histogram is quite complex and lengthy process. Usually you have a set of data and you draw free-hand your diagram according to these data. But now thanks to the ConceptDraw PRO diagramming and vector drawing software extended with Histograms solution from the Graphs and Charts Area of ConceptDraw Solution Park this process became simple and fast.Histogram
ConceptDraw PRO diagramming and vector drawing software offers the Histograms solution from the Graphs and Charts area of ConceptDraw Solution Park with powerful tools to help you draw a Histogram of any complexity quick and easy.Histogram Chart
What is a Histogram Chart? It is a chart which visually displays a distribution of the data. ConceptDraw PRO extended with Histograms solution from the Graphs and Charts area of ConceptDraw Solution Park is the best software for fast and simple drawing professional looking Histogram Chart.Chart Software for Better Presentations
Easy charting software comes with beautiful chart templates and examples. This makes it easy to create professional charts without prior experience. Graphs and Charts Area provide a wide collection of professional looking predesigned templates, samples and ready-to-use vector stencils that will help you to draw the charts and diagrams of various types: Pie Charts, Donut Charts, Line Charts, Column Charts, Bar Charts, Pyramids, Scatter Charts, Venn Diagrams, Spider Charts, Area Charts, Divided Bar Graphs.Basic Diagramming
Create flowcharts, organizational charts, bar charts, line graphs, and more with ConceptDraw PRO.
Making a Histogram
ConceptDraw PRO is a powerful diagramming and vector drawing software. Extended with Histograms solution from the Graphs and Charts area, ConceptDraw PRO became the ideal software for making a Histogram.Basic Diagramming
Perfect charts and graphics diagramming software with rich examples and template. ConceptDraw is ideal to draw Charts and Graphics.
Scatter Graph Charting Software
ConceptDraw provides some interactive xy chart and scatter graph symbols that offers advanced features yet is simple to use.Make a Histogram
ConceptDraw PRO extended with Histograms solution from the Graphs and Charts area of ConceptDraw Solution Park lets you make a Histogram of any complexity in minutes.The Best Flowchart Software Available
ConceptDraw gives the ability to draw Flowchart documents. Flowcharts solutionis a powerful tool that extends ConceptDraw application for drawing business flowcharts. ConceptDraw PRO vector diagramming and business graphics software enhanced with with templates, green and interactive flowchart makers, samples and stencil libraries from ConceptDraw Solution Park which all focused to help with drawing flowcharts, block diagrams, bar charts, histograms, pie charts, divided bar diagrams, line graphs, area charts, scatter plots, circular arrows diagrams, Venn diagrams, bubble diagrams, concept maps, and others.
Bar Chart
ConceptDraw PRO extended with Bar Graphs solution from Graphs and Charts area of ConceptDraw Solution Park is ideal software for quick and simple drawing bar chart of any complexity graph.Waterfall Bar Chart
Waterfall chart shows the changing of the value from one state to another through the series of intermediate changes. The waterfall diagrams are widely used in the business. They are used to represent the set of figures and allow link the individual values to the whole.- How to Draw a Histogram in ConceptDraw PRO | Rainfall Bar Chart ...
- Histograms | Chart Examples | Bar Chart | Histogram Languages ...
- Making a Histogram | Histogram Chart | Histogram | Hitrogram Graph
- Rainfall Bar Chart | Chart Software for Better Presentations ...
- How to Draw a Histogram in ConceptDraw PRO | Education charts ...
- Histograms | Basic Histograms | Chart Examples | Histogram Of ...
- How to Draw a Histogram in ConceptDraw PRO | Histogram Chart ...
- Histograms | Basic Histograms | Business Productivity Area ...
- How to Draw a Histogram in ConceptDraw PRO | Best Program to ...
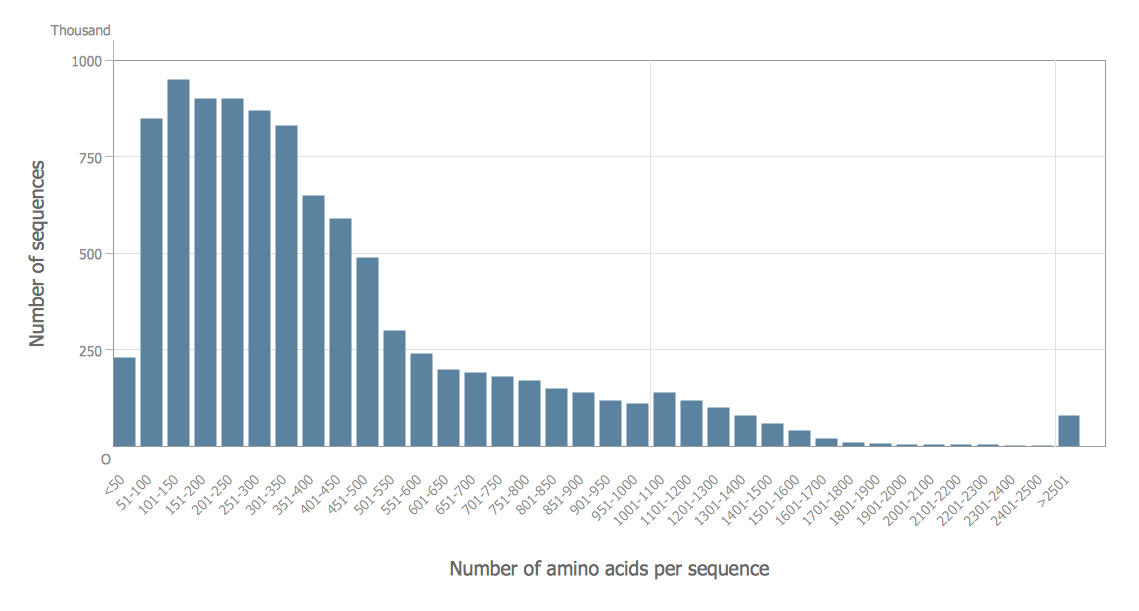
- Amino acid length distribution - Histogram | Histogram Chart | How ...
- Bar Graphs | The increse in subscibers on YouTube to Anonymous ...
- Free Software To Draw Histogram
- Histograms | Histogram Chart | How to Draw a Histogram in ...
- Bar Graph | How to Draw a Histogram in ConceptDraw PRO | Chart ...
- Histogram Chart | Histogram | Making a Histogram | Bar Graph Vs ...
- Histograms | Basic Diagramming | The Best Drawing Program for ...
- Process Flowchart | Example Process Flow | Diagramming Software ...
- Bar Graphs | Bar Chart Examples | Bar Diagrams for Problem ...
- Free Bar Graph Program For Pc


