This ecology infographic example was created on the base of the infographics "Greenhouse gas emissions in the EU" from the Debating Europe website. [debatingeurope.eu/ wp-content/ uploads/ 2013/ 06/ TH_ 2_ social.png]
"A greenhouse gas (sometimes abbreviated GHG) is a gas in an atmosphere that absorbs and emits radiation within the thermal infrared range. This process is the fundamental cause of the greenhouse effect. The primary greenhouse gases in the Earth's atmosphere are water vapor, carbon dioxide, methane, nitrous oxide, and ozone. Greenhouse gases greatly affect the temperature of the Earth; without them, Earth's surface would average about 33 °C colder, which is about 59 °F below the present average of 14 °C (57 °F)." [Greenhouse gas. Wikipedia]
The ecology infographic example "EU greenhouse gas emissions" was created using the ConceptDraw PRO diagramming and vector drawing software extended with the Management Infographics solition from the area "Business Infographics" in ConceptDraw Solution Park.
Ecology infographics example

Used Solutions
This pie chart sample shows the atmosphere air composition. It was designed on the base of the Wikimedia Commons file: Air composition pie chart.JPG.
[commons.wikimedia.org/ wiki/ File:Air_ composition_ pie_ chart.JPG]
This file is licensed under the Creative Commons Attribution-Share Alike 3.0 Unported license. [creativecommons.org/ licenses/ by-sa/ 3.0/ deed.en]
"The atmosphere of Earth is a layer of gases surrounding the planet Earth that is retained by Earth's gravity. The atmosphere protects life on Earth by absorbing ultraviolet solar radiation, warming the surface through heat retention (greenhouse effect), and reducing temperature extremes between day and night (the diurnal temperature variation).
The common name given to the atmospheric gases used in breathing and photosynthesis is air. By volume, dry air contains 78.09% nitrogen, 20.95% oxygen, 0.93% argon, 0.039% carbon dioxide, and small amounts of other gases. Air also contains a variable amount of water vapor, on average around 1%. Although air content and atmospheric pressure vary at different layers, air suitable for the survival of terrestrial plants and terrestrial animals currently is only known to be found in Earth's troposphere and artificial atmospheres." [Atmosphere of Earth. Wikipedia]
The pie chart example "Atmosphere air composition" was created using the ConceptDraw PRO diagramming and vector drawing software extended with the Pie Charts solution of the Graphs and Charts area in ConceptDraw Solution Park.
Pie chart

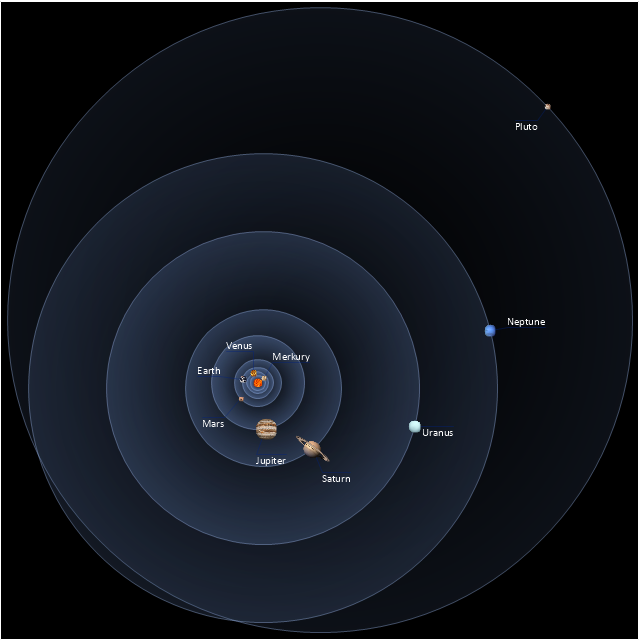
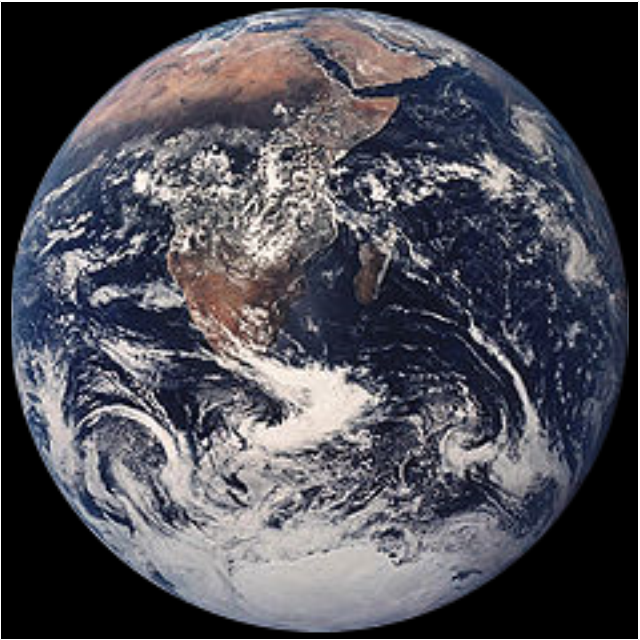
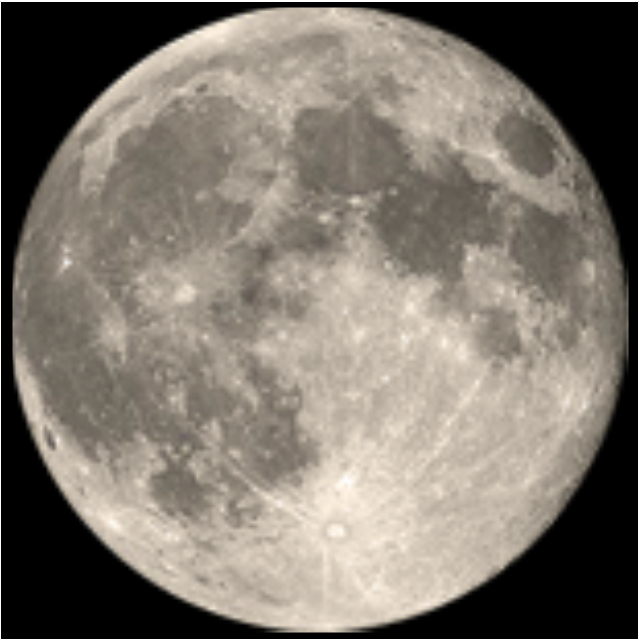
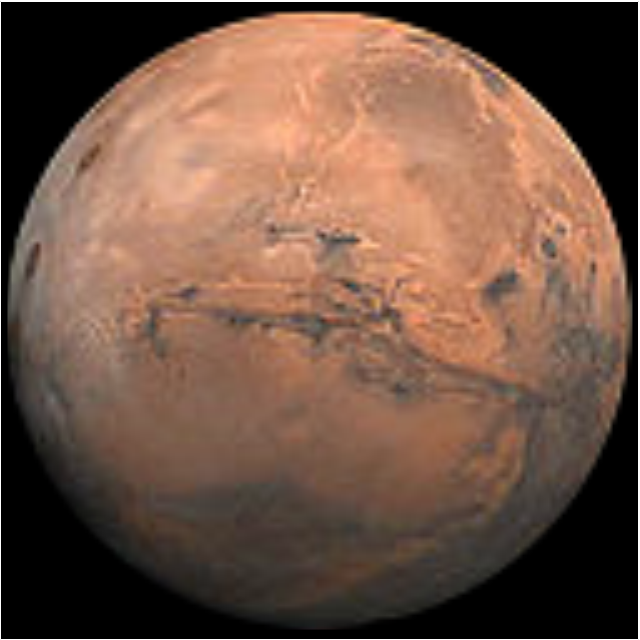
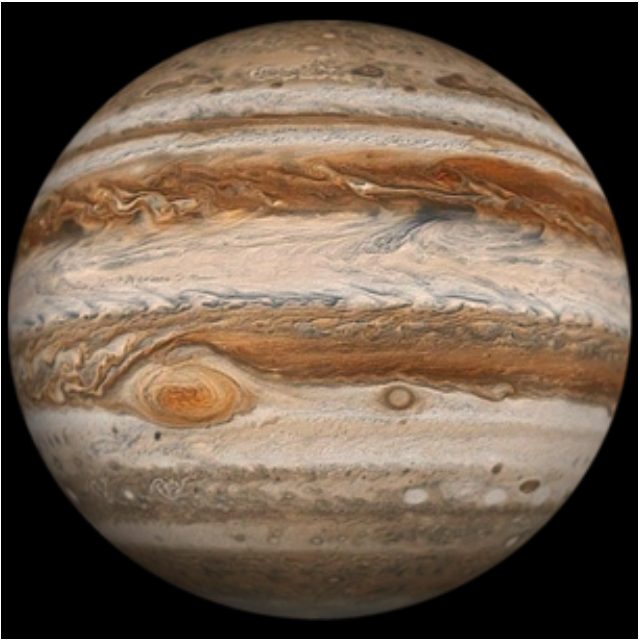
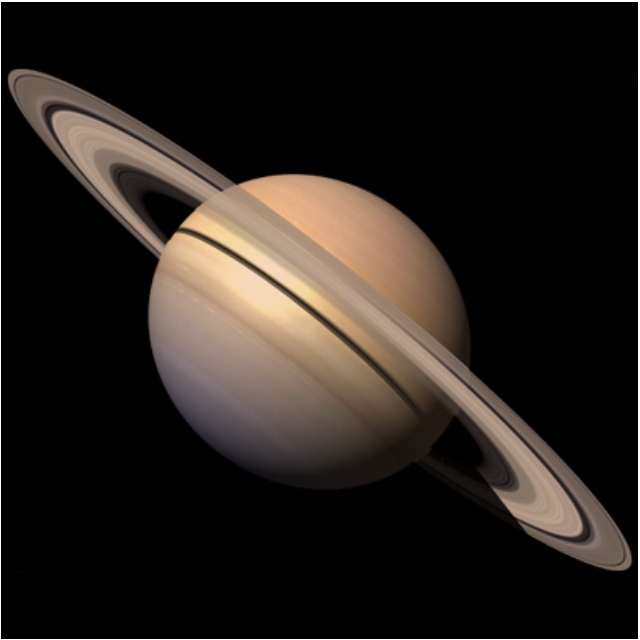
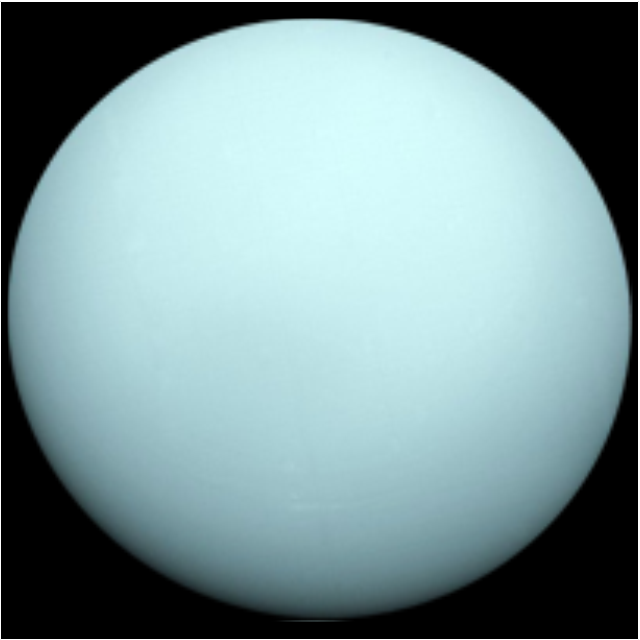
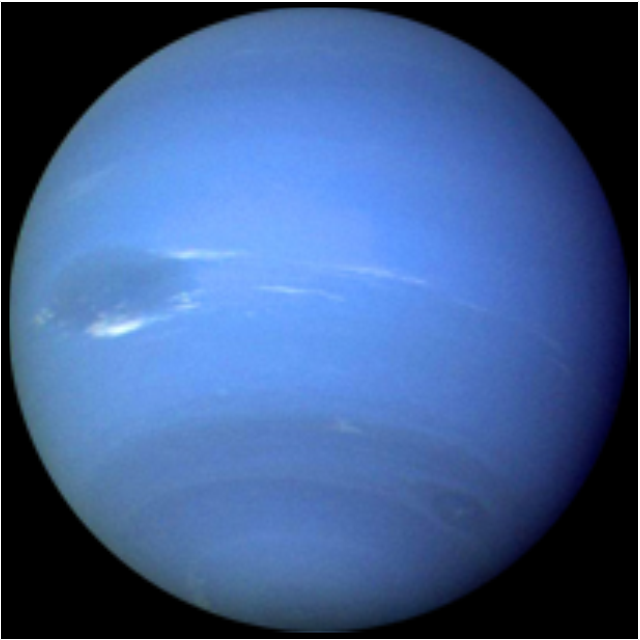
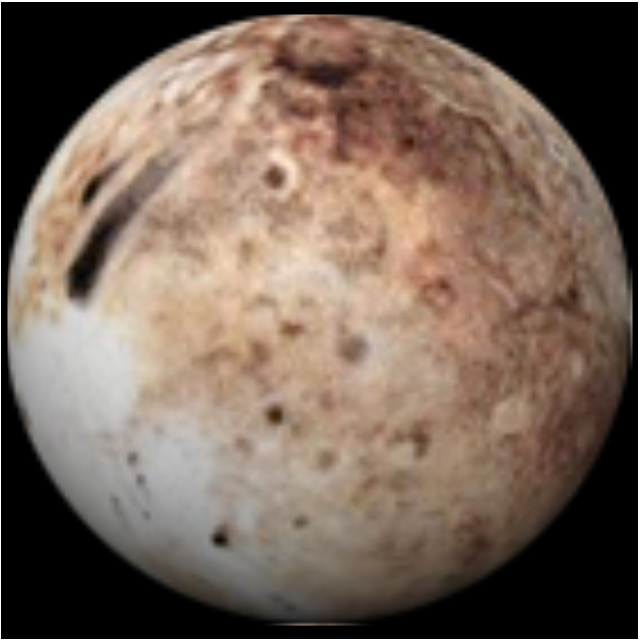
This vector stencils library contains 30 clipart images and astronomical symbols of sun and stars, solar system planets and moon.
Use these shapes for drawing your astronomical diagrams and illustrations.
Use these shapes for drawing your astronomical diagrams and illustrations.
Solar system
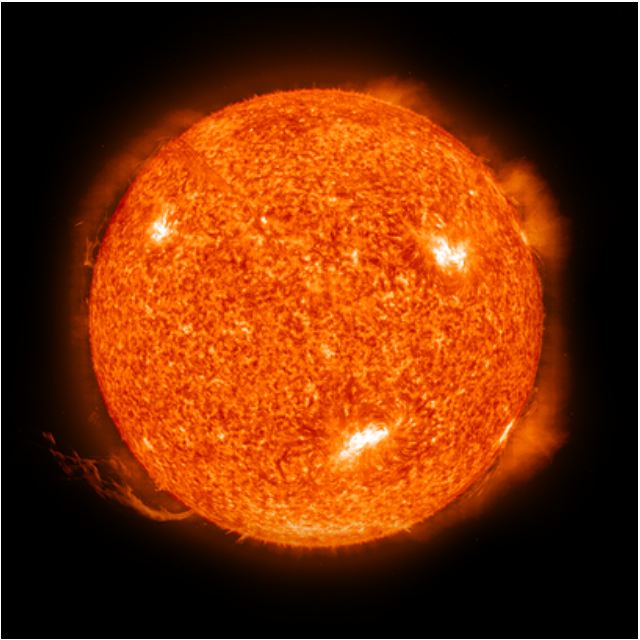
Sun
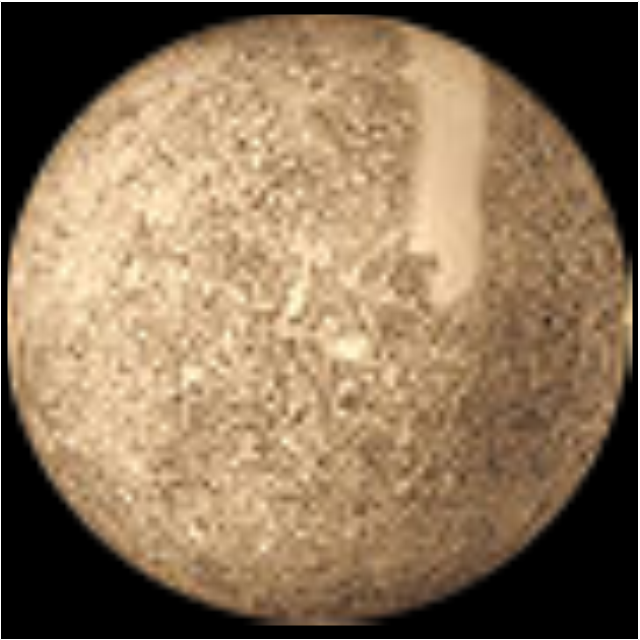
Mercury
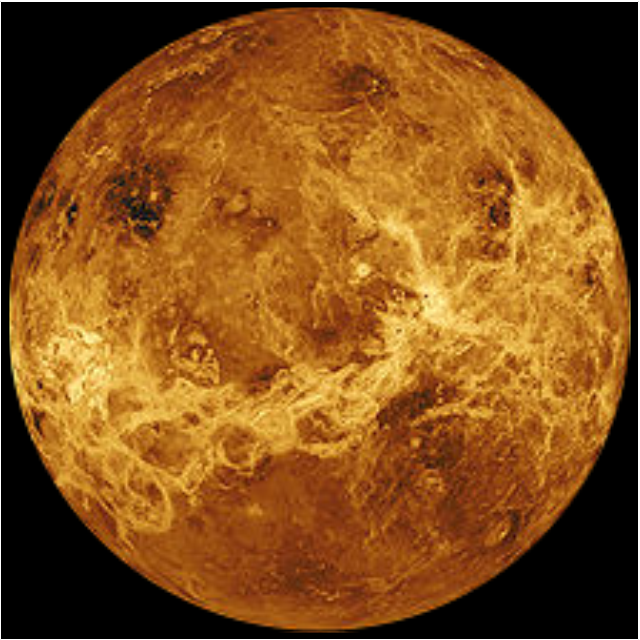
Venus
Earth
Moon
Mars
Jupiter
Saturn
Uranus
Neptune
Pluto
Red giant
Yellow giant
Blue giant

Red dwarf
White dwarf
Black hole
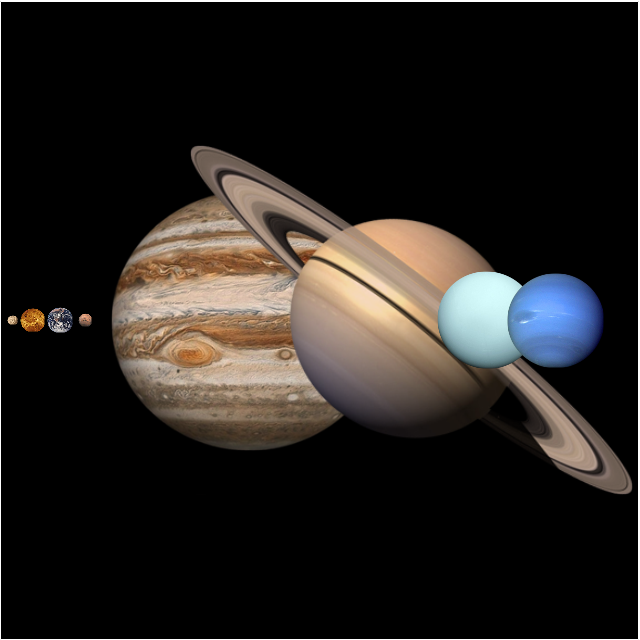
Planets to scale
Sun symbol
Mercury symbol
Venus symbol
Earth symbol
Moon symbol

Mars symbol
Jupiter symbol
Saturn symbol
Neptune symbol
Uranus symbol
Pluto symbol

Process Flow Diagram

Building Drawing Software for Designing Plumbing


This Water cycle diagram example was drawn using the ConceptDraw PRO diagramming and vector graphics software extended with the clipart libraries Geography and Weather.
"The water cycle, also known as the hydrologic cycle or the H2O cycle, describes the continuous movement of water on, above and below the surface of the Earth. The mass water on Earth remains fairly constant over time but the partitioning of the water into the major reservoirs of ice, fresh water, saline water and atmospheric water is variable depending on a wide range of climatic variables. The water moves from one reservoir to another, such as from river to ocean, or from the ocean to the atmosphere, by the physical processes of evaporation, condensation, precipitation, infiltration, runoff, and subsurface flow. In so doing, the water goes through different phases: liquid, solid (ice), and gas (vapor)." [Water cycle. Wikipedia]
This water cycle diagram example is included in the Nature solution from the Illustration area of ConceptDraw Solution Park.
Vector illustration

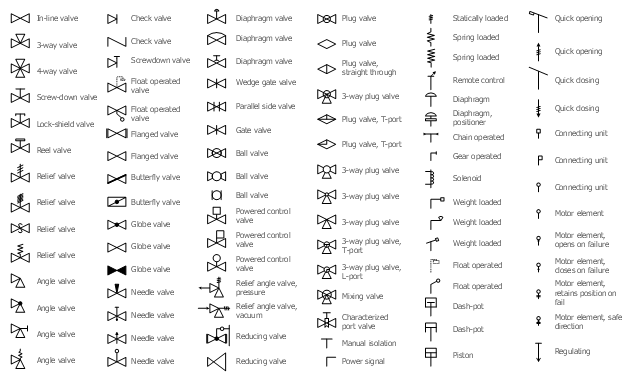
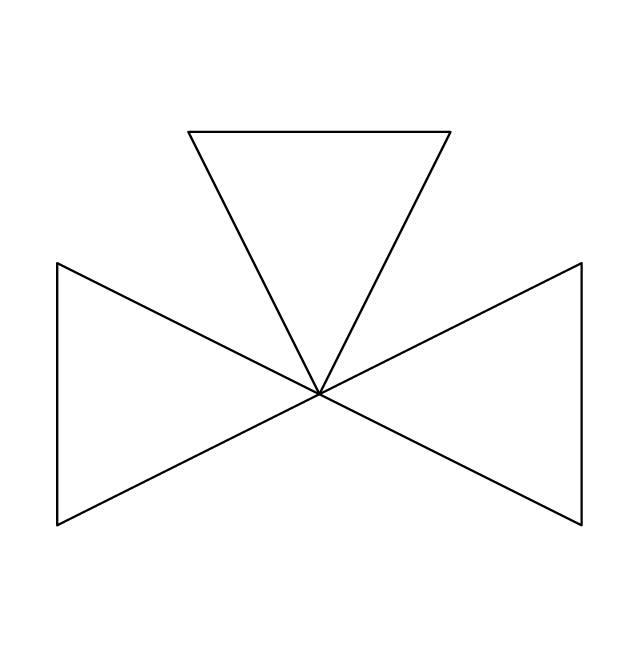
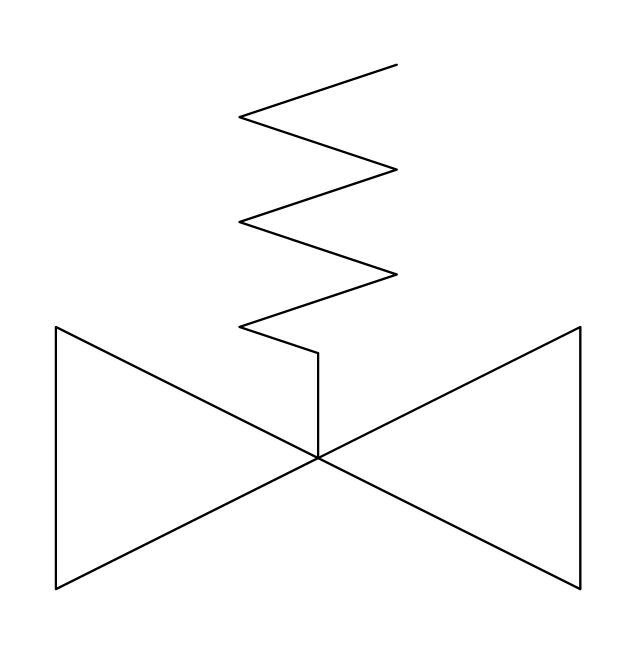
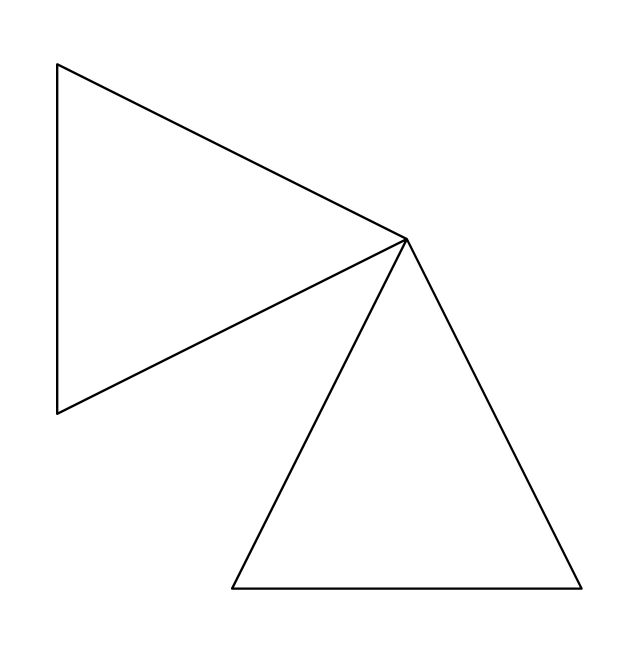
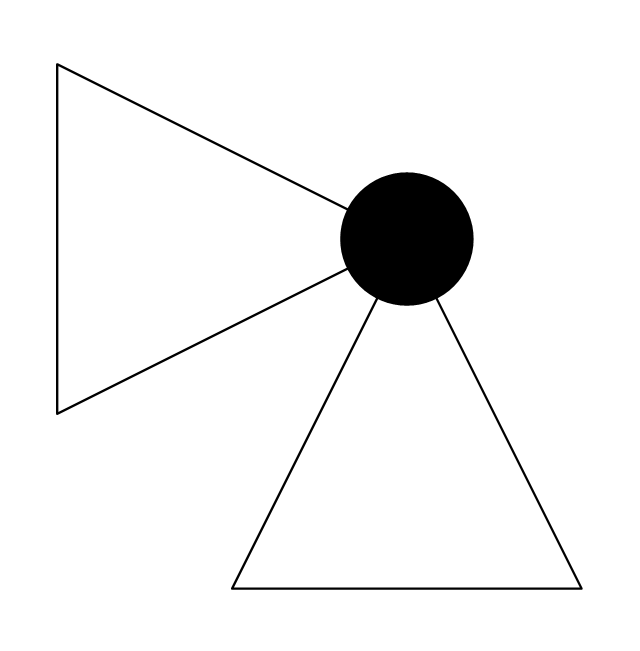
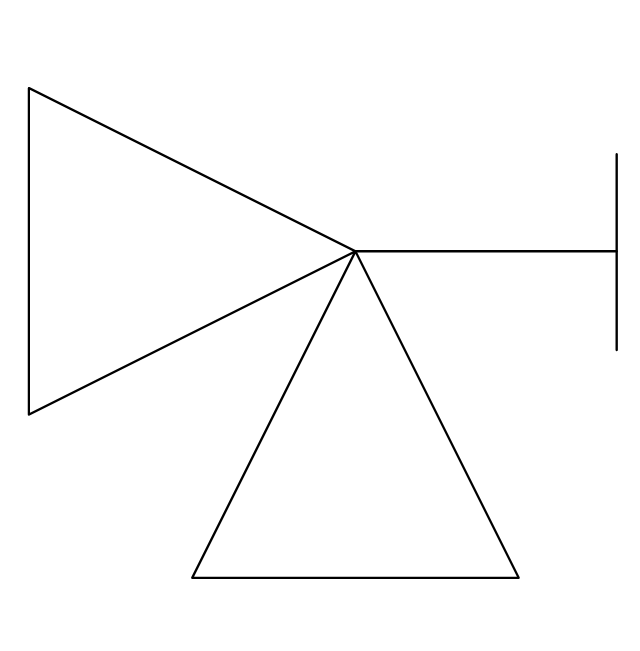
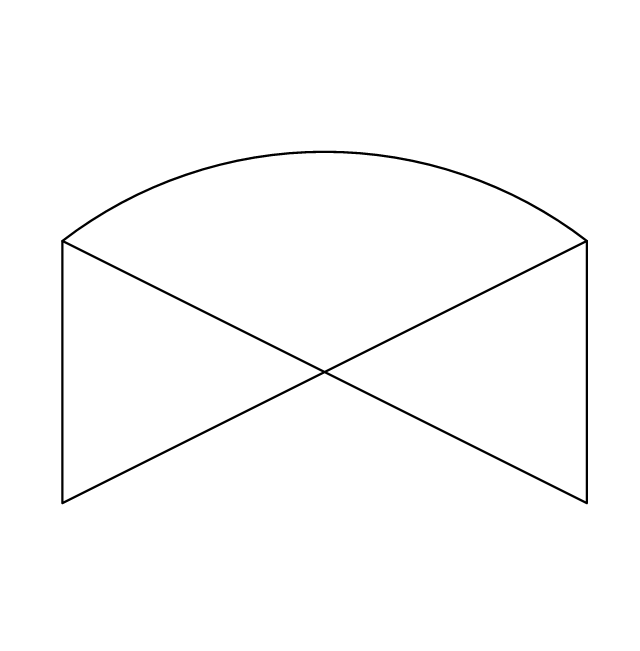
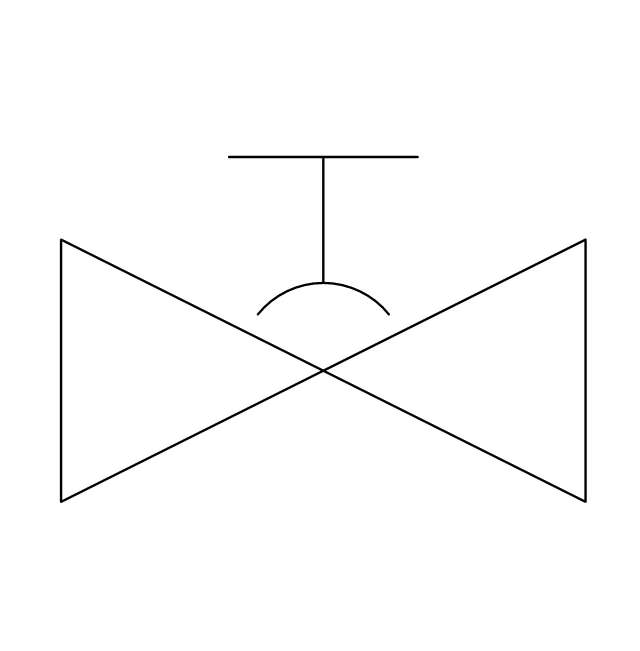
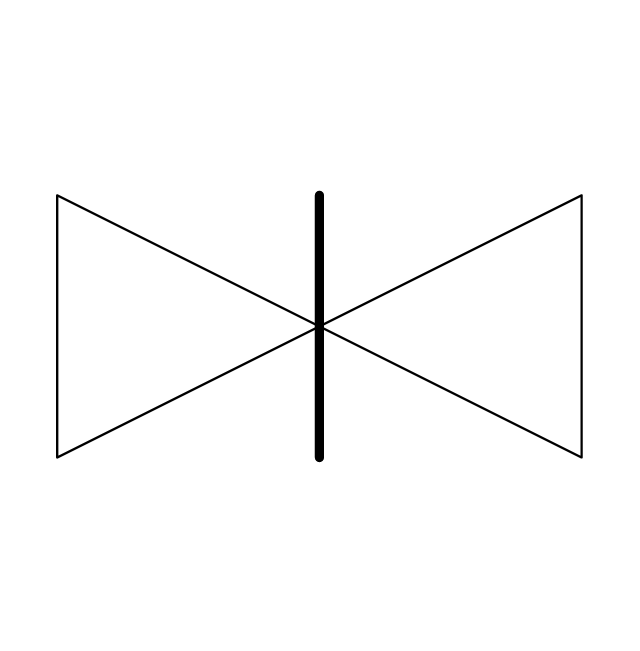
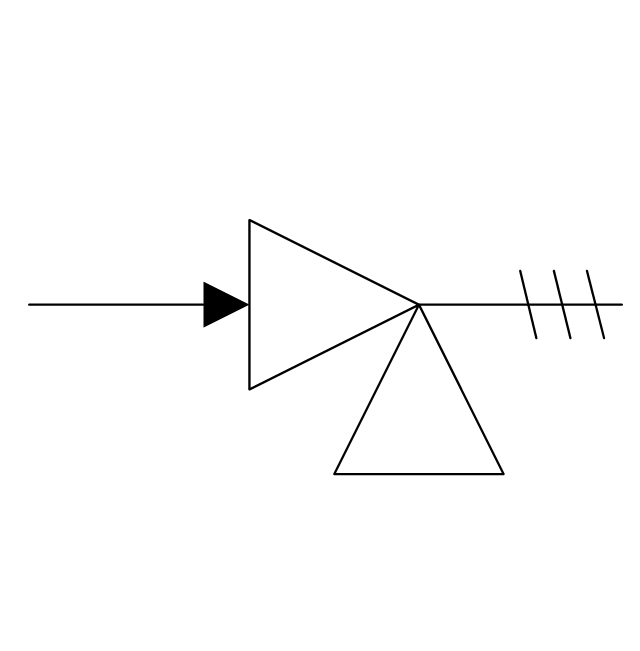
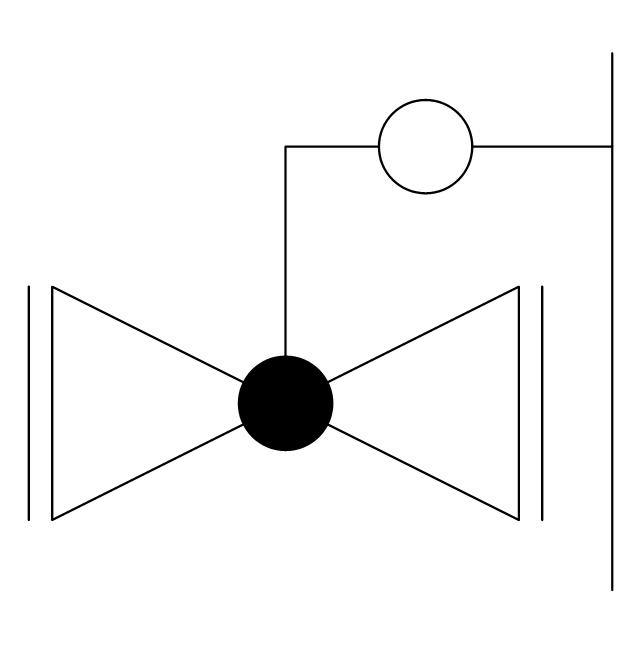
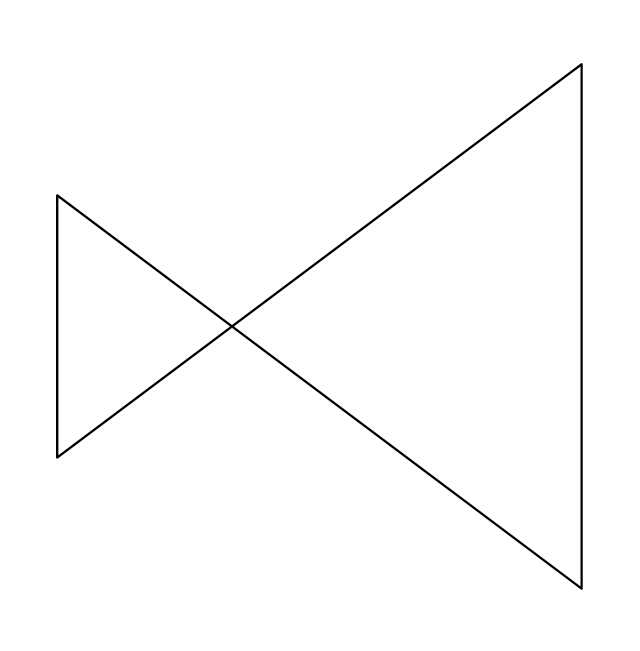
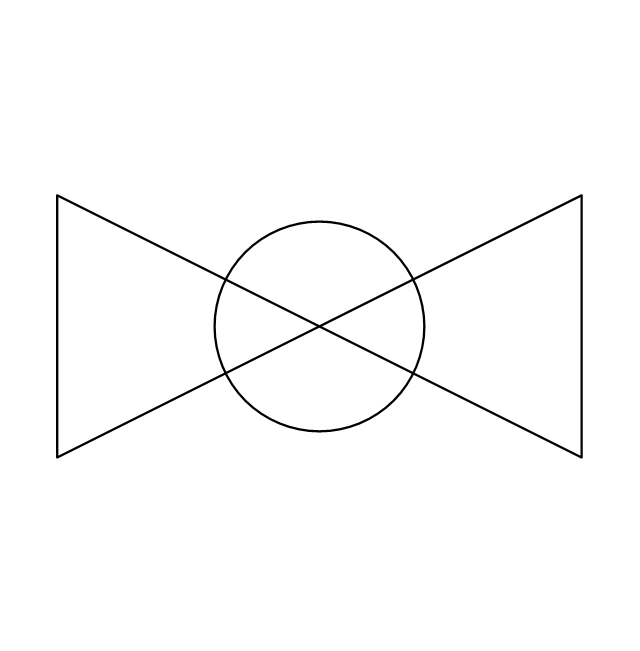
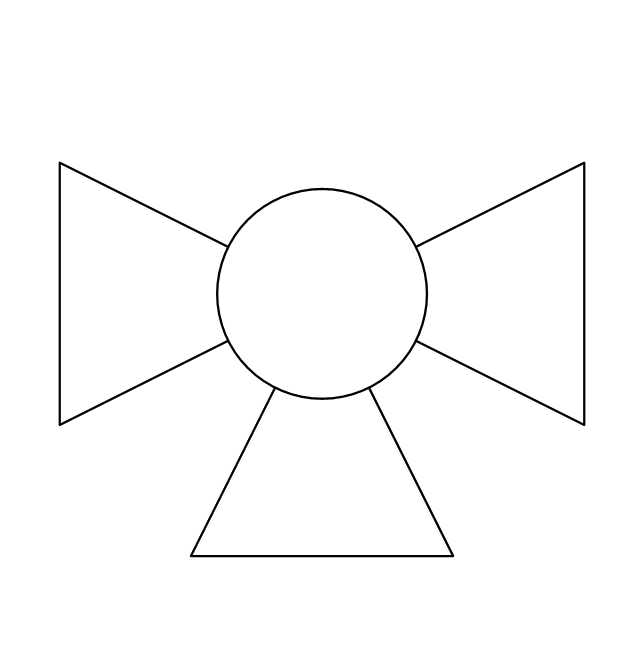
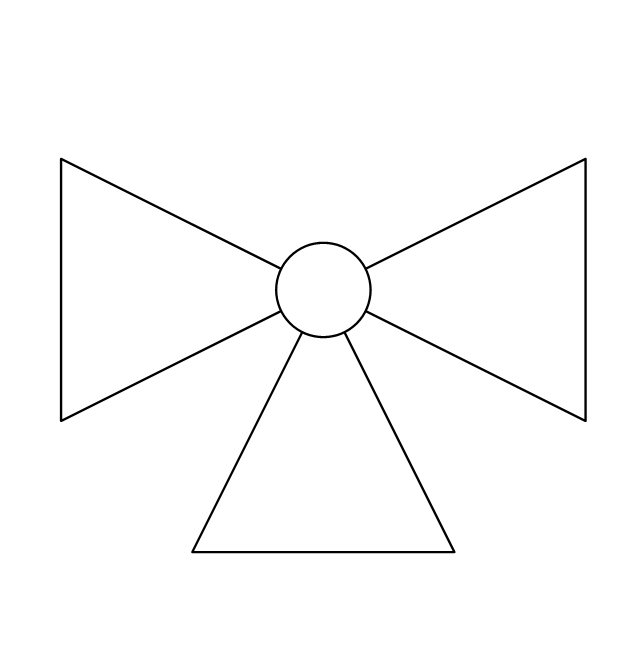
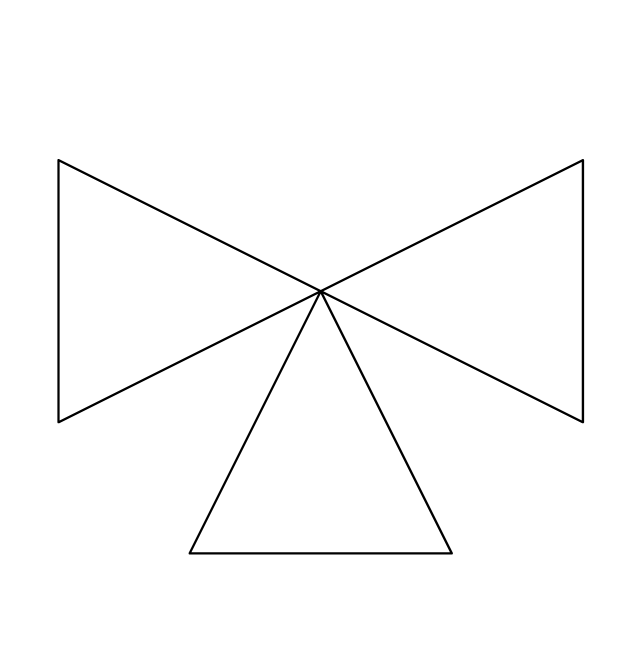
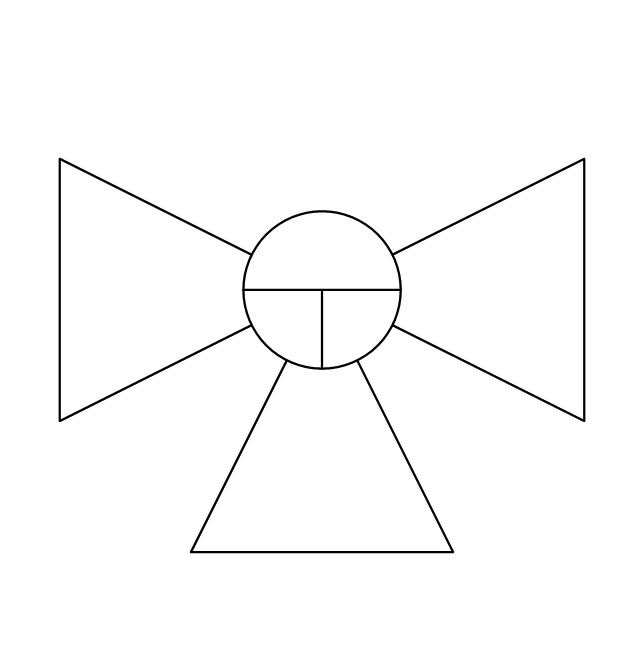
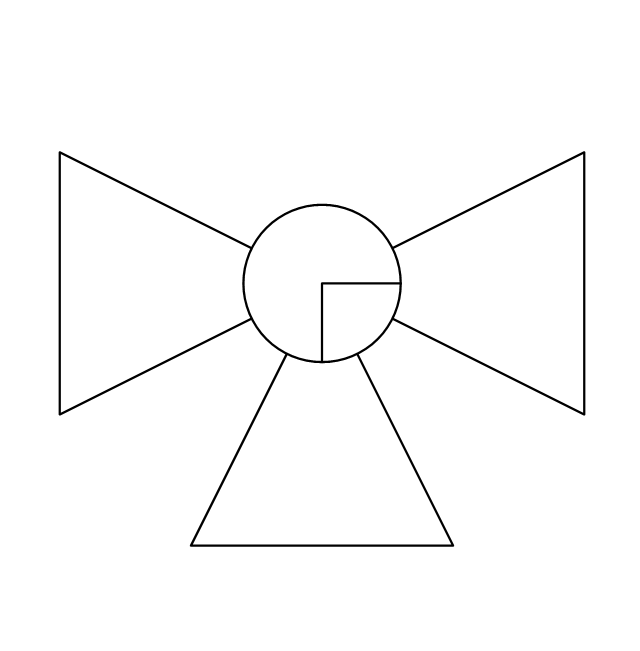
The vector stencils library "Valves" contains 91 symbols of piping and plumbing valves.
"A valve is a device that regulates, directs or controls the flow of a fluid (gases, liquids, fluidized solids, or slurries) by opening, closing, or partially obstructing various passageways. Valves are technically valves fittings, but are usually discussed as a separate category. In an open valve, fluid flows in a direction from higher pressure to lower pressure.
The simplest, and very ancient, valve is simply a freely hinged flap which drops to obstruct fluid (gas or liquid) flow in one direction, but is pushed open by flow in the opposite direction. This is called a check valve, as it prevents or "checks" the flow in one direction.
People in developed nations use valves in their daily lives, including plumbing valves, such as taps for tap water, gas control valves on cookers, small valves fitted to washing machines and dishwashers, safety devices fitted to hot water systems..." [Valve. Wikipedia]
Use the design elements library "Valves" to draw building plans, schematic diagrams, blueprints, or technical drawings of industrial piping systems; process, vacuum, and fluids piping; hydraulics piping; air and gas piping; materials distribution; and liquid transfer systems using the ConceptDraw PRO diagramming and vector drawing software.
The shapes library "Valves" is included in the Plumbing and Piping Plans solution from the Building Plans area of ConceptDraw Solution Park.
Valve symbols
This vector stencils library contains 30 clipart images and astronomical symbols of sun and stars, solar system planets and moon.
Use these shapes for drawing your astronomical diagrams and illustrations.
Use these shapes for drawing your astronomical diagrams and illustrations.
Solar system
Sun
Mercury
Venus
Earth
Moon
Mars
Jupiter
Saturn
Uranus
Neptune
Pluto
Red giant
Yellow giant
Blue giant
Red dwarf
White dwarf
Black hole
Planets to scale
Sun symbol
Mercury symbol
Venus symbol
Earth symbol
Moon symbol
Mars symbol
Jupiter symbol
Saturn symbol
Neptune symbol
Uranus symbol
Pluto symbol
 HVAC Plans
Use HVAC Plans solution to create professional, clear and vivid HVAC-systems design plans, which represent effectively your HVAC marketing plan ideas, develop plans for modern ventilation units, central air heaters, to display the refrigeration systems for automated buildings control, environmental control, and energy systems.
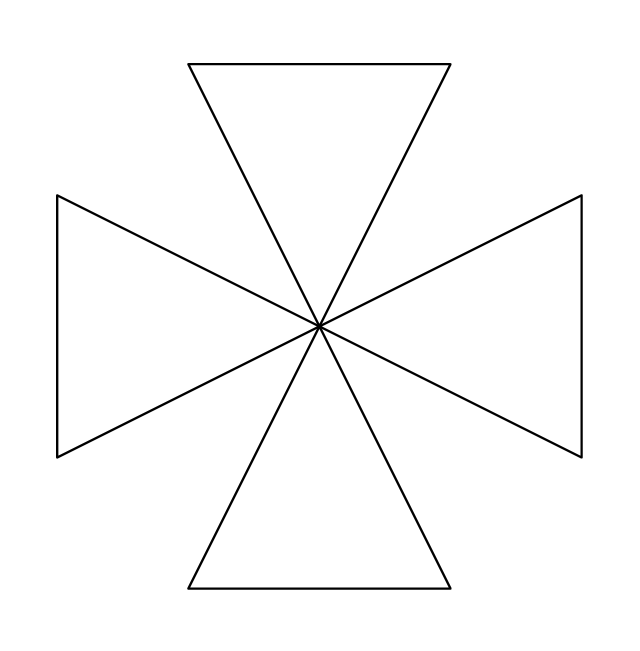
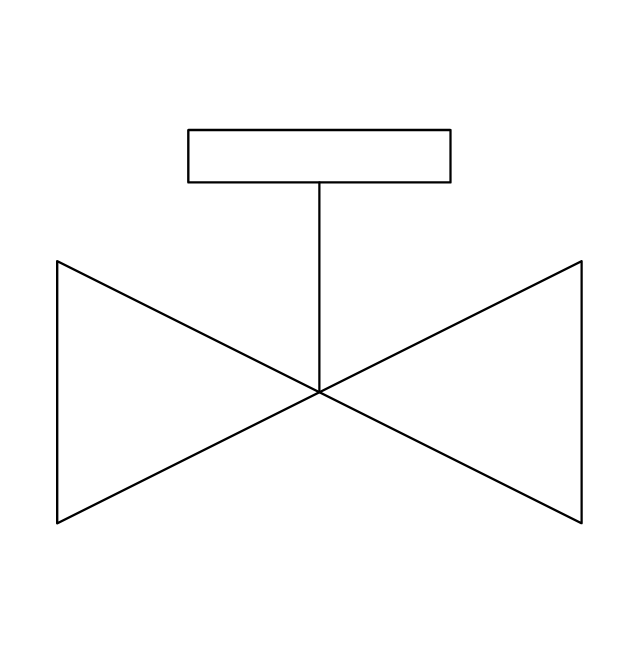
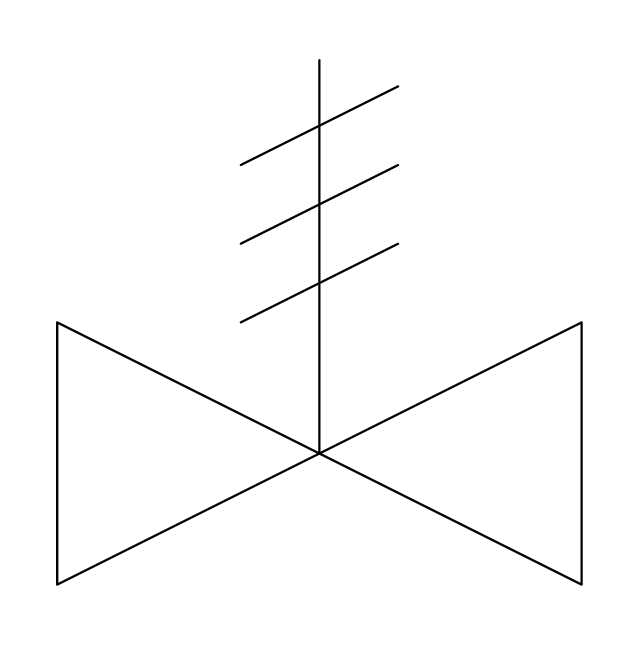
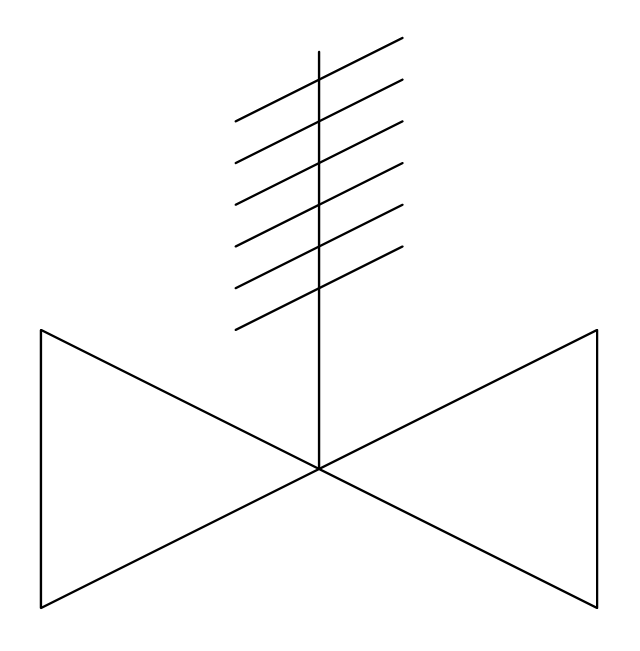
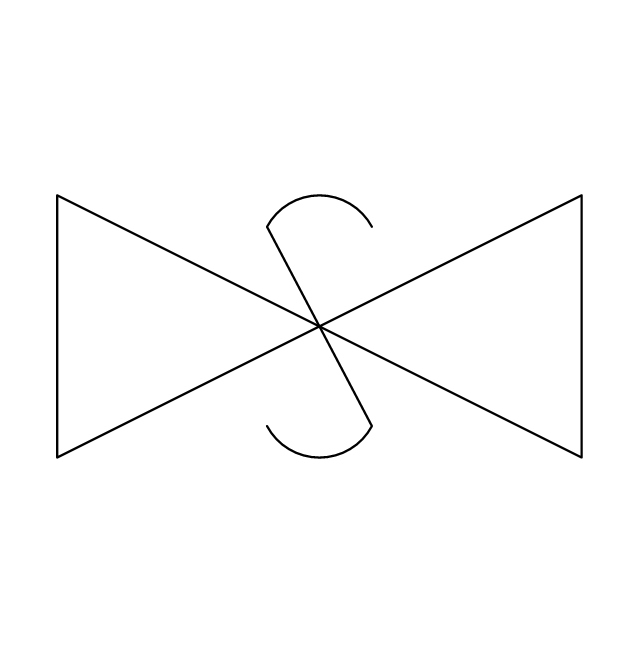
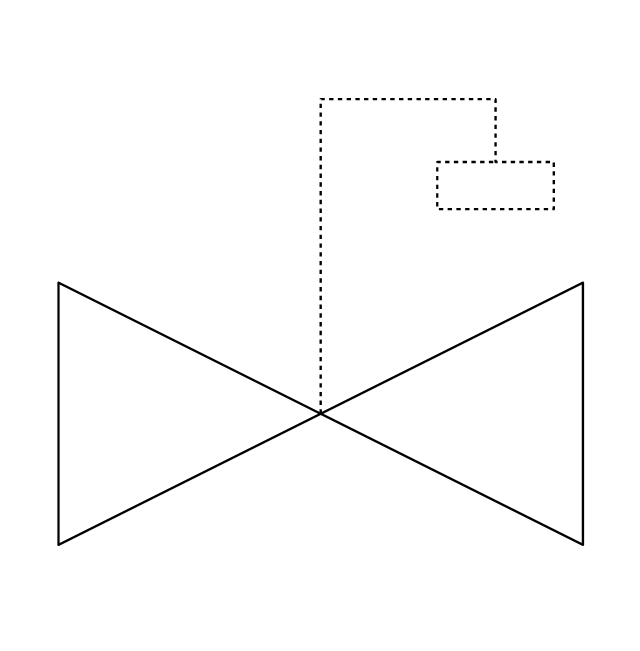
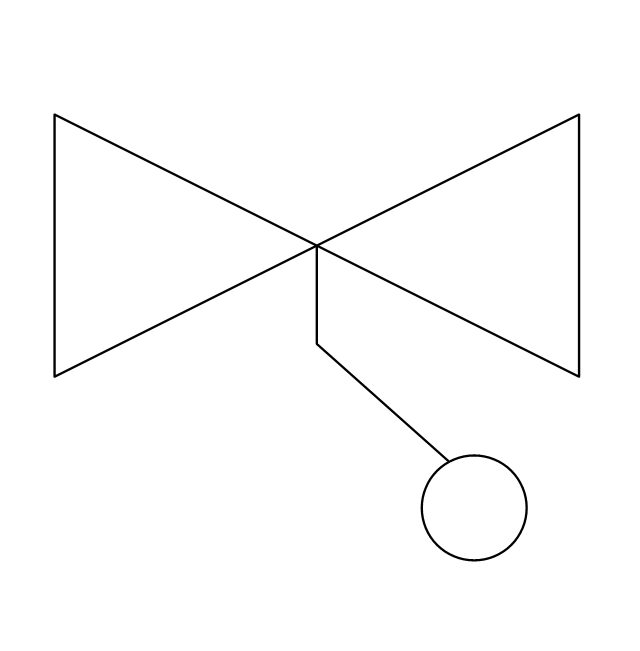
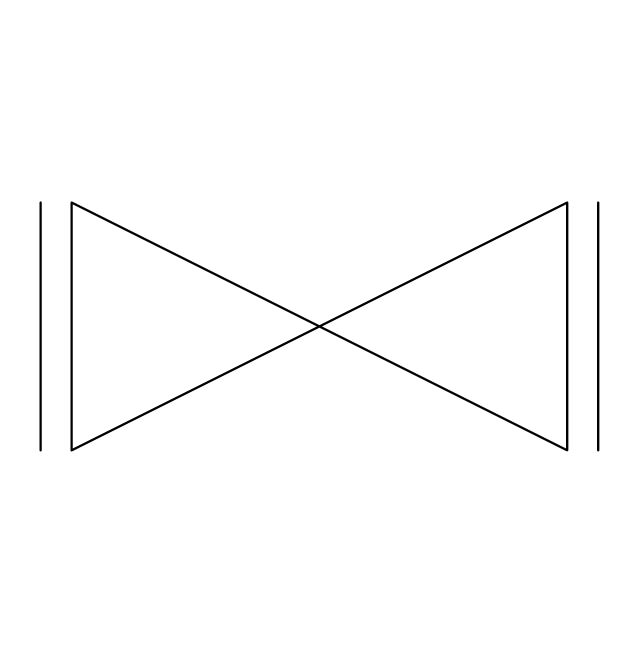
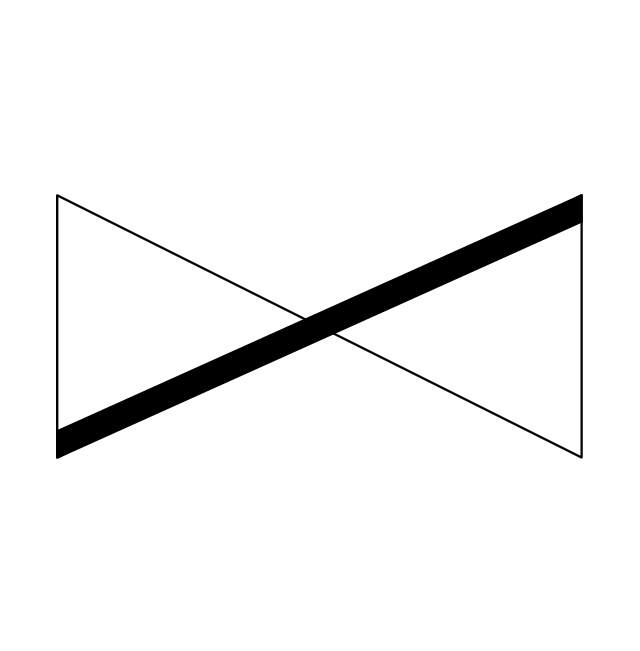
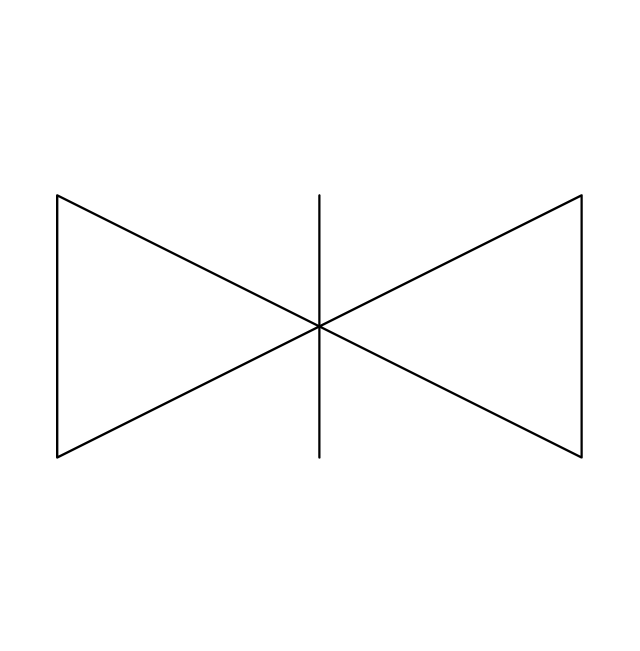
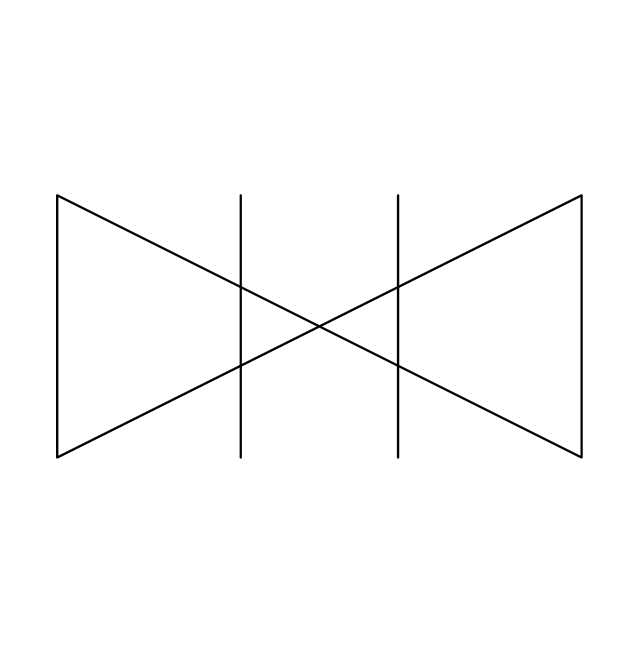
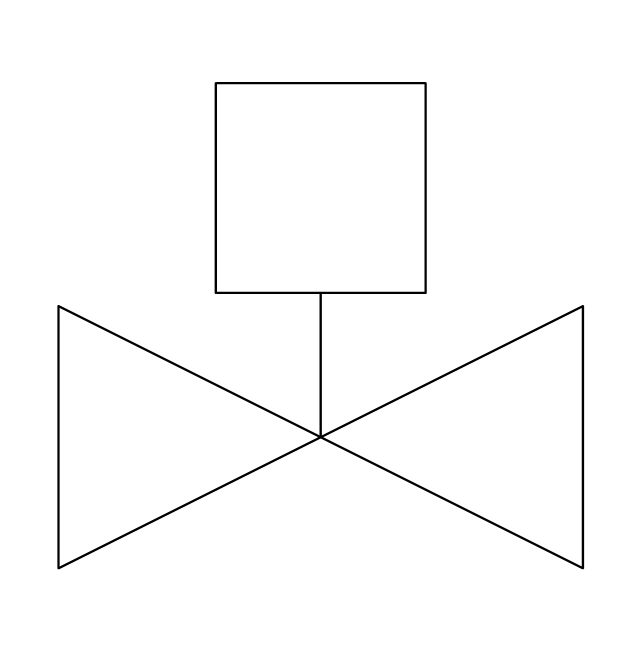
The vector stencils library "Valves" contains 91 symbols of valves. Use it for drawing plumbing and piping plans, schematic diagrams and blueprints of industrial piping systems; process, vacuum, and fluids piping; hydraulics piping; air and gas piping; materials distribution; and liquid transfer systems in the ConceptDraw PRO diagramming and vector drawing software extended with the Plumbing and Piping Plans solution from the Building Plans area of ConceptDraw Solution Park.
In-line valve

3-way valve
4-way valve
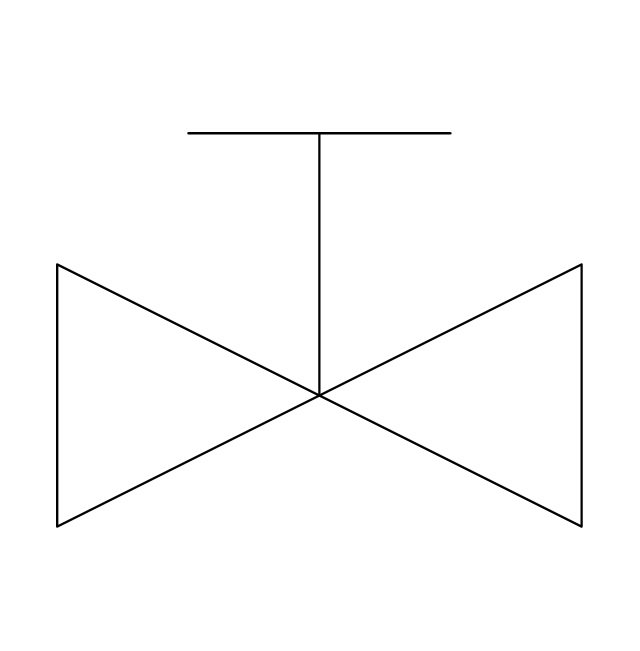
Screw-down valve
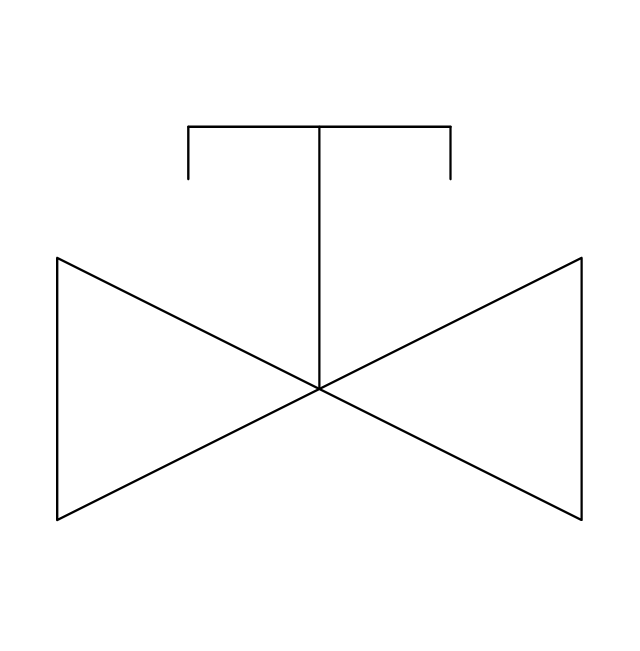
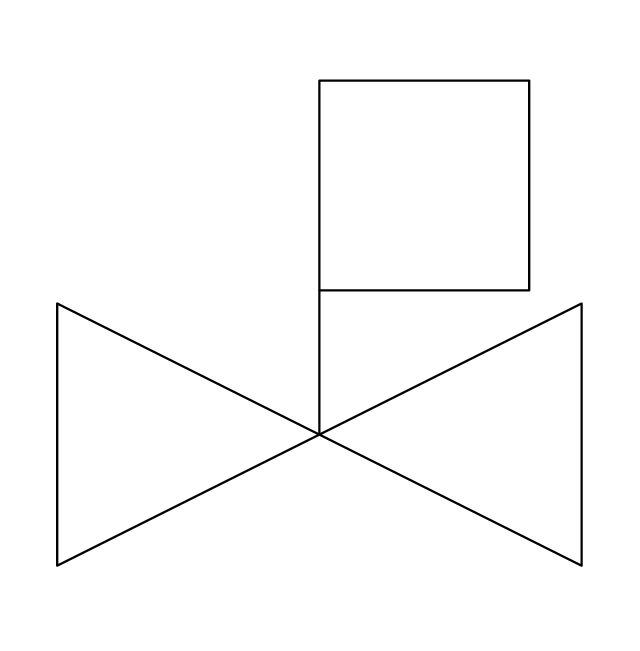
Lock-shield valve
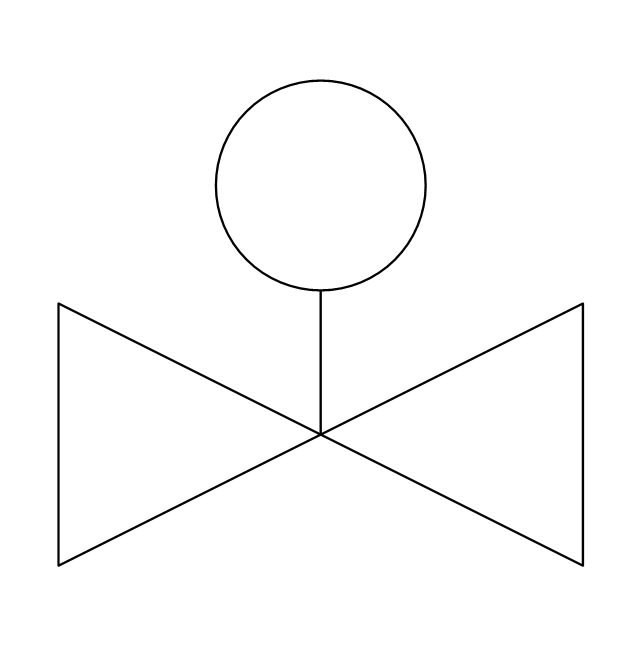
Reel valve
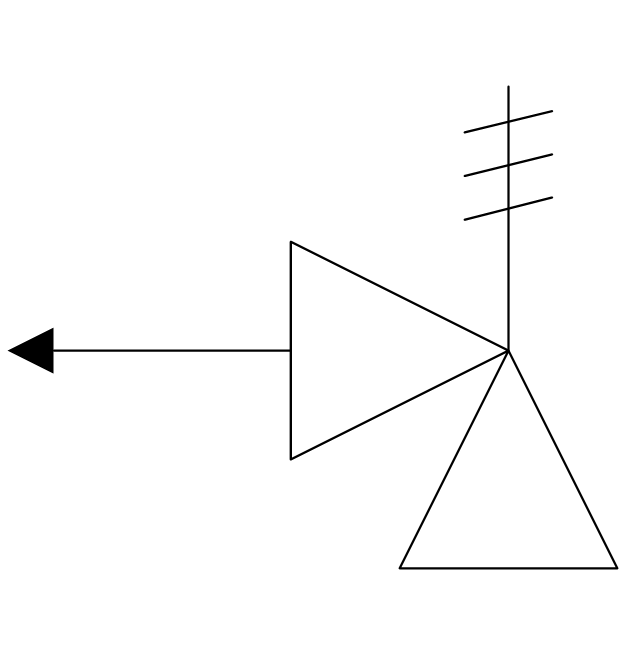
Relief valve
Relief valve 2
Relief valve 3
Relief valve 4
Angle valve
Angle valve 2
Angle valve 3
Angle valve 4
Check valve
Check valve 2
Screwdown valve
Float operated valve
Float operated valve 2
Flanged valve
Flanged valve 2

Butterfly valve
Butterfly valve 2
Globe valve
Globe valve 2
Globe valve 3

Needle valve
Needle valve 2
Needle valve 3
Needle valve 4
Diaphragm valve
Diaphragm valve 2
Diaphragm valve 3
Wedge gate valve
Parallel side valve
Gate valve
Ball valve
Ball valve 2
Ball valve 3
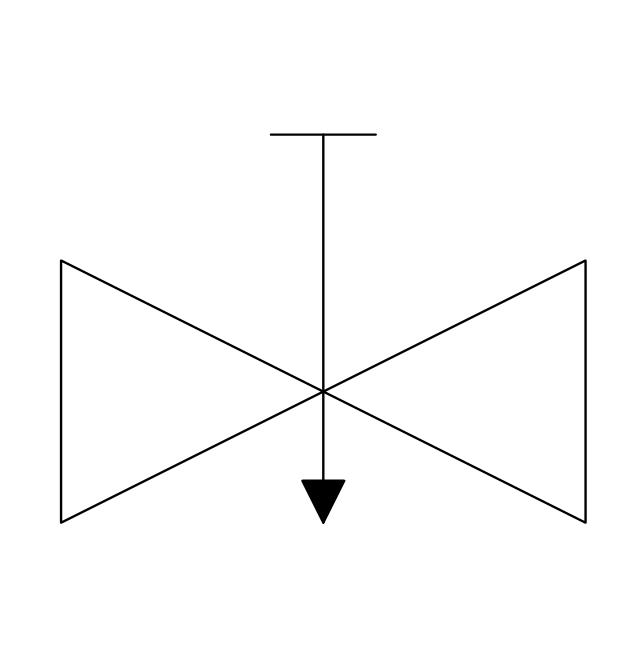
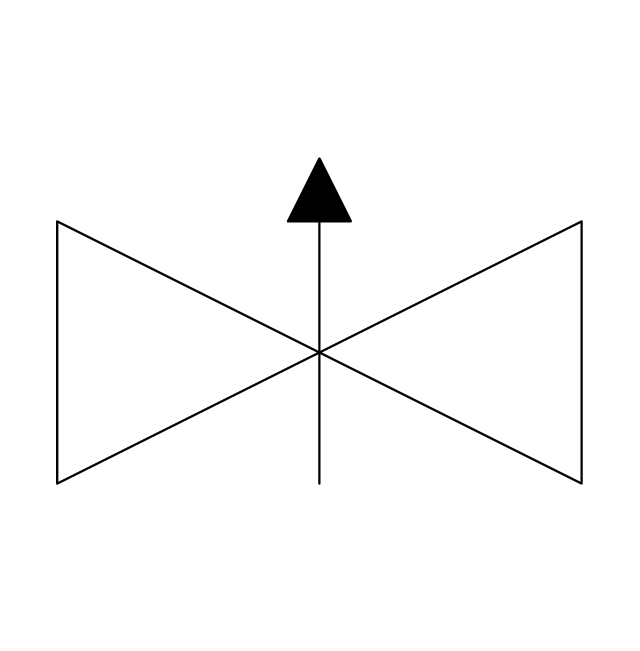
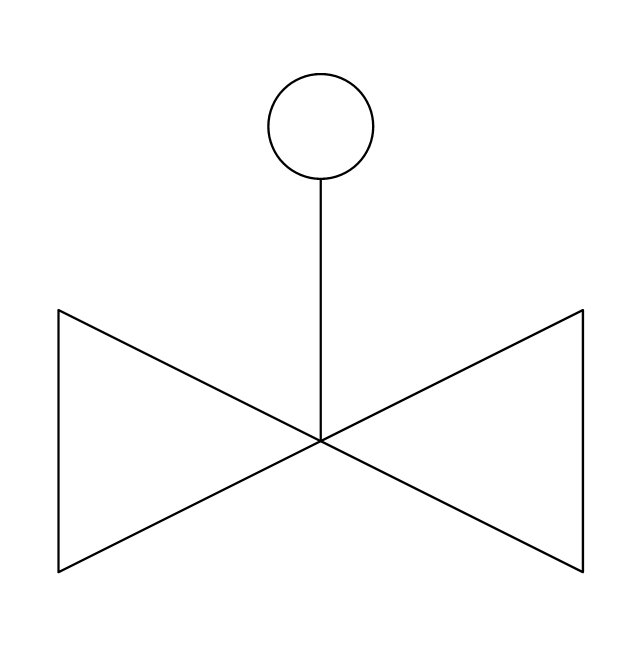
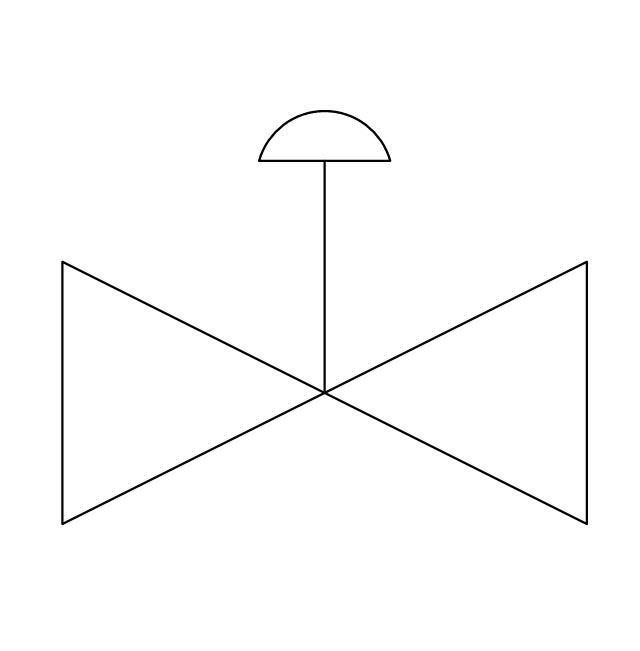
Powered control valve
Powered control valve 2
Powered control valve 3
Relief angle valve, pressure
Relief angle valve, vacuum
Reducing valve
Reducing valve 2
Plug valve
Plug valve 2
Plug valve, straight through

3-way plug valve
Plug valve, T-port
Plug valve, L-port
3-way plug valve
3-way plug valve 2
3-way plug valve 3
3-way plug valve, T-port
3-way plug valve, L-port
Mixing valve
Characterized port valve
Manual isolation
Power signal
Statically loaded
Spring loaded
Spring loaded 2
Remote control
Diaphragm
Diaphragm, positioner
Chain operated
Gear operated
Solenoid
Weight loaded
Weight loaded 2
Weight loaded 3
Float operated

Float operated 2
Dash-pot
Dash-pot 2
Piston
Quick opening
Quick opening 2
Quick closing
Quick closing 2
Connecting unit
Connecting unit 2

Connecting unit 3
Motor element

Motor element, opens on failure

Motor element, closes on failure
Motor element, retains position on fail
Motor element, safe direction
Regulating
- Percentage Pie Chart. Pie Chart Examples | Atmosphere air ...
- Gases In The Air Percentages
- Diagram Of Amount Of Gas In Atmosphere
- Atmosphere air composition | Pie Chart Nitrogen Oxygen ...
- Pie Chart Of Gasses In Air
- Atmosphere air composition | EU greenhouse gas emissions ...
- Pie Graph Of Atmosphere Gases
- Gases In Air Pie Chart
- Atmosphere air composition | Percentage Pie Chart. Pie Chart ...
- Air Gases Pie Chart