HelpDesk
How to Add a Block Diagram to a PowerPoint Presentation Using ConceptDraw PRO
A block diagram is a useful tool both in designing new processes, and in improving existing. A block diagram is a type of chart, which is often used in presentations, because of its universality - the graphic blocks can be applied to many processes.The PowerPoint presentation of major process steps and key process participants can be very informative and helpful. Using ConceptDraw PRO, you can easily convert a block diagram to MS PowerPoint presentation.HelpDesk
How to Create Data-driven Infographics
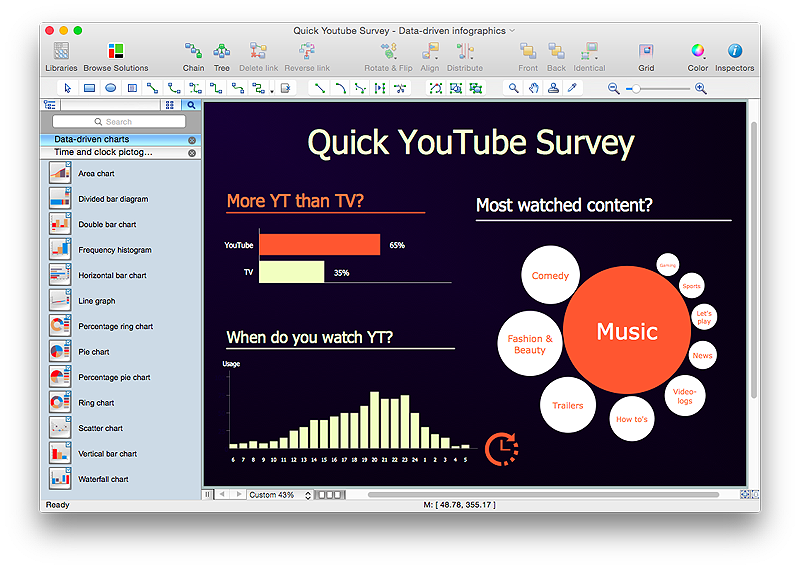
Data-driven infographics are used in wildly disparate areas of business and commerce. To make effective Data-driven infographics, it's useful to have a wide variety of graphical elements — icons, clipart, stencils, charts and graphs — to illustrate your diagram. ConceptDraw Data-driven Infographics solution provides all the tools you need to present data as described by this article — as well as the charts mentioned previously, you can find histograms, divided bar charts, ring charts, line graphs and area charts — meaning you can find the perfect medium for displaying a certain type of data. It allows you to draw data driven infographics quickly and easily using the special templates and vector stencils libraries.It can be used to quickly communicate a message, to simplify the presentation of large amounts of data, to see data patterns and relationships, and to monitor changes in variables over time.HelpDesk
How to Draw a Pyramid Diagram in ConceptDraw PRO
Pyramid diagram (triangle diagram) is used to represent data, which have hierarchy and basics. Due to the triangular form of diagram, each pyramid section has a different width. The width of the segment shows the level of its hierarchy. Typically, the top of the pyramid is the data that are more important than the base data. Pyramid scheme can be used to show proportional and hierarchical relationships between some logically related items, such as departments within an organization, or successive elements of any process. This type of diagram is often used in marketing to display hierarchical related data, but it can be used in a variety of situations. ConceptDraw PRO allows you to make a pyramid diagram, quickly and easily using special libraries.HelpDesk
How to Perform a Dynamic Presentation with ConceptDraw PRO
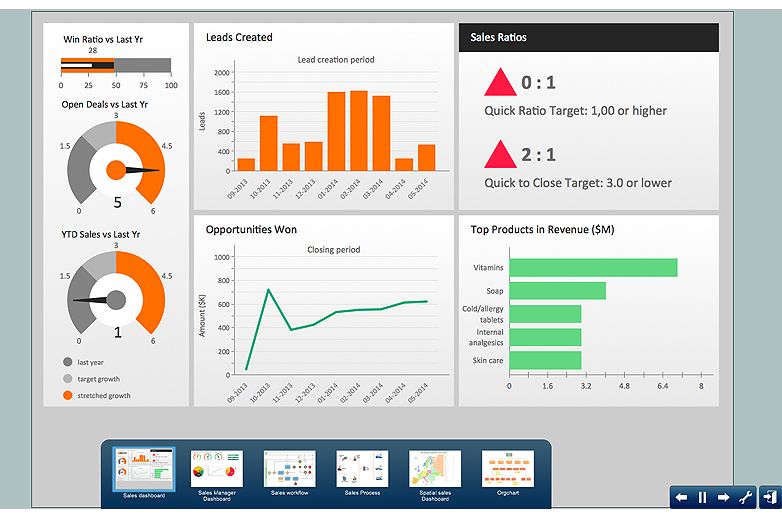
Every ConceptDraw PRO document can be viewed as a presentation. Dynamic Presentation option enables you to make an interactive on-line presentation of ConceptDraw PRO documents. You can edit documents during the Dynamic presentation directly, add notes and feedback making it accurate and up to date in a moment. ConceptDraw PRO allows you to save presentation as a slide show that opens immediately in a full-screen. Any ConceptDraw presentation can be performed in three ways; manually, automatic slide-show, and cyclic-playing mode.
 Circular Arrows Diagrams
Circular Arrows Diagrams solution extends ConceptDraw PRO v10 with extensive drawing tools, predesigned samples, Circular flow diagram template for quick start, and a library of ready circular arrow vector stencils for drawing Circular Arrow Diagrams, Segmented Cycle Diagrams, and Circular Flow Diagrams. The elements in this solution help managers, analysts, business advisers, marketing experts, scientists, lecturers, and other knowledge workers in their daily work.
- How to Add a Telecommunication Network Diagram to a PowerPoint ...
- How to Add a Workflow Diagram to a PowerPoint Presentation ...
- Stakeholder Onion Diagram Template | How to Add a Workflow ...
- How to Add a Concept Map to a PowerPoint Presentation Using ...
- How To Add a Computer Network Diagram to a PowerPoint ...
- Bubble Charts | How to Add a Bubble Diagram to a PowerPoint ...
- How to Add a Telecommunication Network Diagram to a PowerPoint ...
- How to Add a Bubble Diagram to a PowerPoint Presentation Using ...
- Business Management Uml Diagram Ppt
- How To Attach Block Diagrams In Ppt
- How To Create Power Point Presentation In Business Process
- Venn Diagram Powerpoint
- How to Add a Cross-Functional Flowchart to a PowerPoint ...
- Business Processes | How To Make a PowerPoint Presentation of a ...
- How to Add a Circle-spoke Diagram to a PowerPoint Presentation ...
- How to Add a Circle-spoke Diagram to a PowerPoint Presentation ...
- How To Make a PowerPoint Presentation of a Business Process ...
- How to Create a PowerPoint ® Presentation from a Mind Map | How ...
- Cctv Block Diagram Ppt


