This site uses cookies. By continuing to browse the ConceptDraw site you are agreeing to our Use of Site Cookies.
HelpDesk

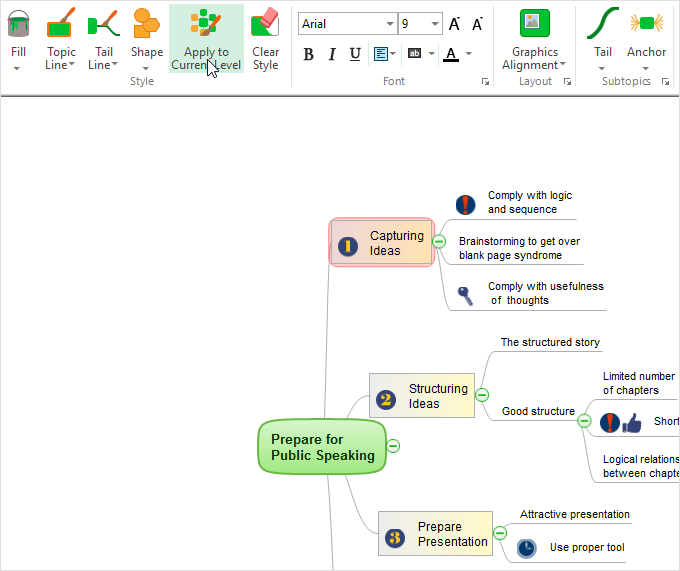
How to Change the Font for an Entire Level of a Mind Map

The visual representation of information is much more productive than simple linear transfer because it is more natural for our brain to understand information in the form of visual images. ConceptDraw MINDMAP will help you put your thoughts and ideas across to any audience in the most intelligible and memorable way. Mind maps can be used in a great number of situations involving analysis, learning, research, and thinking. Use them for personal planning, preparing lists, working on projects, as well as analyzing problems and finding solutions. ConceptDraw MINDMAP provides a variety of style and formatting options for your mind maps, that let you add more information to your mind map without interfering with its readability.
HelpDesk

How to Format Topics
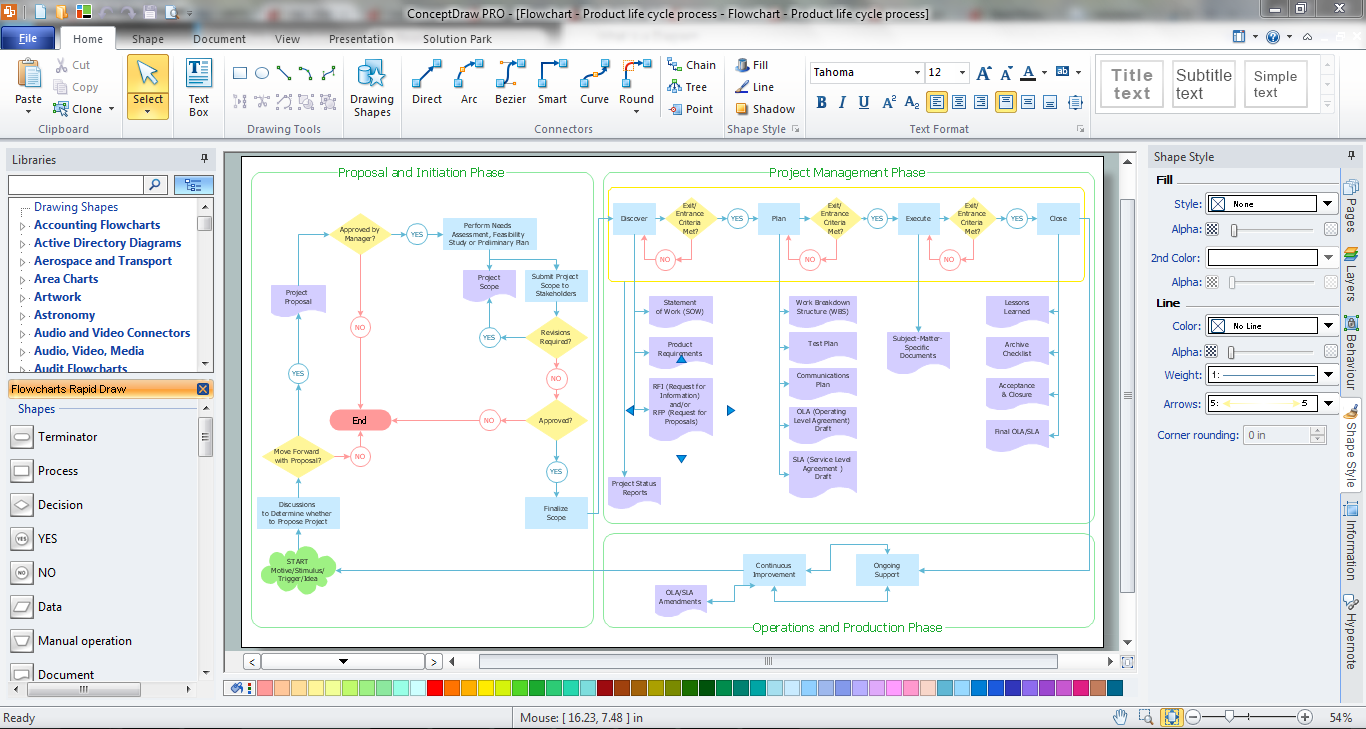
ConceptDraw MINDMAP enables you to change the form and color of a mind map topics. Here are the tips on how to edit mind map appearance quickly by changing the topic's form and color.

Flowchart Software

Flowchart is widely used in business, education and economic presentations to help the audience visualize the content better, or to find flaws in a process flow diagrams. Flowcharts are particularly useful for displaying how a process currently flow or could ideally function. Flowcharts can help you see whether the steps of a process are logical, uncover problems or miscommunications, define the boundaries of a process, and develop a common base of knowledge about a process.

ConceptDraw DIAGRAM flowchart software will help to quickly create new flowcharts, workflow, NS Diagram, BPMN Diagram, Cross-functional flowcharts, data flow diagrams and highlight flowcharts.

Feature-rich flowchart maker, free thousand flowchart examples and templates and colored symbols that will allow you to create professional looking flowcharts simply.

ConceptDraw DIAGRAM supports macOS and Windows.
How to Build a Flowchart

Create Organizational Chart

CSOdessa team is happy to provide cost effective Organizational Chart Software for companies of any size. It is a ConceptDraw DIAGRAM extended with Organizational Charts Solution from the Management Area.
ConceptDraw DIAGRAM organizational chart professional software allows quickly create organizational charts, flow charts, time lines, and much more. Use it for drawing organizational chart for any size company and analyzing organizational structure. Use ConceptDraw to create organizational chart, visualize company Organizational chart, hospital Organizational chart, hotel Organizational chart, corporate organizational chart, etc.

ERD Symbols and Meanings

Crow's foot notation is used in Barker's Notation, Structured Systems Analysis and Design Method (SSADM) and information engineering. Crow's foot diagrams represent entities as boxes, and relationships as lines between the boxes. Different shapes at the ends of these lines represent the cardinality of the relationship.
The Chen's ERD notation is still used and is considered to present a more detailed way of representing entities and relationships.
To create an ERD, software engineers mainly turn to dedicated drawing software, which contain the full notation resources for their specific database design - ERD symbols and meanings. CS Odessa has released an all-inclusive Entity-Relationship Diagram (ERD) solution for their powerful drawing program, ConceptDraw DIAGRAM.
How to Build an Entity Relationship Diagram (ERD)

Sales Steps

Helps to create professionally looking and detailed Sales Flowcharts with all sales steps visually represented on them.
Use the Sales Flowcharts Solution for ConceptDraw DIAGRAM software to create your own Sales Flowcharts of any complexity quickly, easily and effectively to use them successfully in your work activity.
ConceptDraw DIAGRAM diagramming and vector drawing software supplied with unique Sales Flowcharts solution from the Marketing area of ConceptDraw Solution Park allows fast and easy visualize all sales steps of the sales process on a sales process Map or sales process flowchart, and then realize them easily.

Business Process Workflow Diagram

Business Process Workflow Diagram is a professional visual tool that is widely applied for business development, business analysis, business process optimization and documenting business processes. Business Process Workflow Diagram lets depict in details the steps of business processes and flow of tasks between them, the execution of business processes, transfer of data and documents.
The workflows on the Business Process Workflow Diagram are represented using the set of common symbols which let easy illustrate business processes and process flows, depict the start, all major steps and end of the process, what data are used by the process, how the data flow through the business areas within scope of our project, how the tasks are executed and by who, and how workers interact with each other.
How to Draw Business Process Diagrams
HelpDesk

How to Change the Form and Color of a Topic’s Line in Your Mind Map

You can completely customize the style of your mind maps, including the style of topic lines and outlines. This article describes how to change the form and color of a topic’s line in your mind map.

Organization Chart Templates

Organization Chart Templates - Organizational Charts Solution from the Management Area of ConceptDraw Solution Park provides a wide collection of predesigned templates and samples that will help you create the Organizational Charts of any complexity in one moment.

Flow Chart Creator

It is impossible to imagine the managing and analyzing of business and technical processes without flowcharts. They are the best way to visually represent the structural data, algorithms, the steps of the process, they allow to illustrate the process flow direction and solution to a given problem. ConceptDraw DIAGRAM diagramming and vector drawing software extended with flowchart maker and Flowcharts Solution from the "Diagrams" Area is a powerful Flow Chart Creator.
HelpDesk

How to Format a Mind Map on Mac

In ConceptDraw MINDMAP, you can customize the appearance of a mind map by changing topic shape, text colors and font; fill colors and patterns; line weight and style. Using the full range of formatting capabilities you can create aesthetically appealing mind map which can be the key to the effective presentation of your ideas.
HelpDesk

How to Set the Default Theme for your Mind Maps

Find out a favorite style for your mind maps, then set it as the default for all your new mind maps.