Android GUI
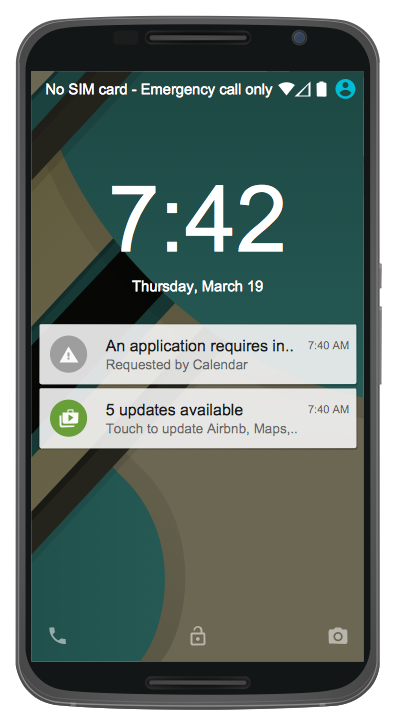
Android is an operating system based on the Linux kernel and developed by Google for smartphones, tablet computers, electronic books, netbooks, smartbooks, digital players, watches, game consoles, TV and other devices. ConceptDraw DIAGRAM extended with Android User Interface Solution from the Software Development Area is a powerful software with extensive drawing tools which can help you to build the intelligible, attractive and easy for perception Android GUI for your application.How to Build Cloud Computing Diagram Principal Cloud Manufacturing
The term “cloud” is very popular and widely used now, it is a server, data processing centre, or a network which lets to store the data and software, provides access to them, allows to run applications without installation and gives the possibility to process data hosted remotely via the Internet connection. For documenting the Cloud Computing Architecture with a goal to facilitate the communication between stakeholders are successfully used the Cloud Computing Architecture diagrams. It is convenient and easy to draw various Cloud Computing Architecture diagrams in ConceptDraw DIAGRAM software with help of tools of the Cloud Computing Diagrams Solution from the Computer and Networks Area of ConceptDraw Solution Park.Create Workflow Diagram
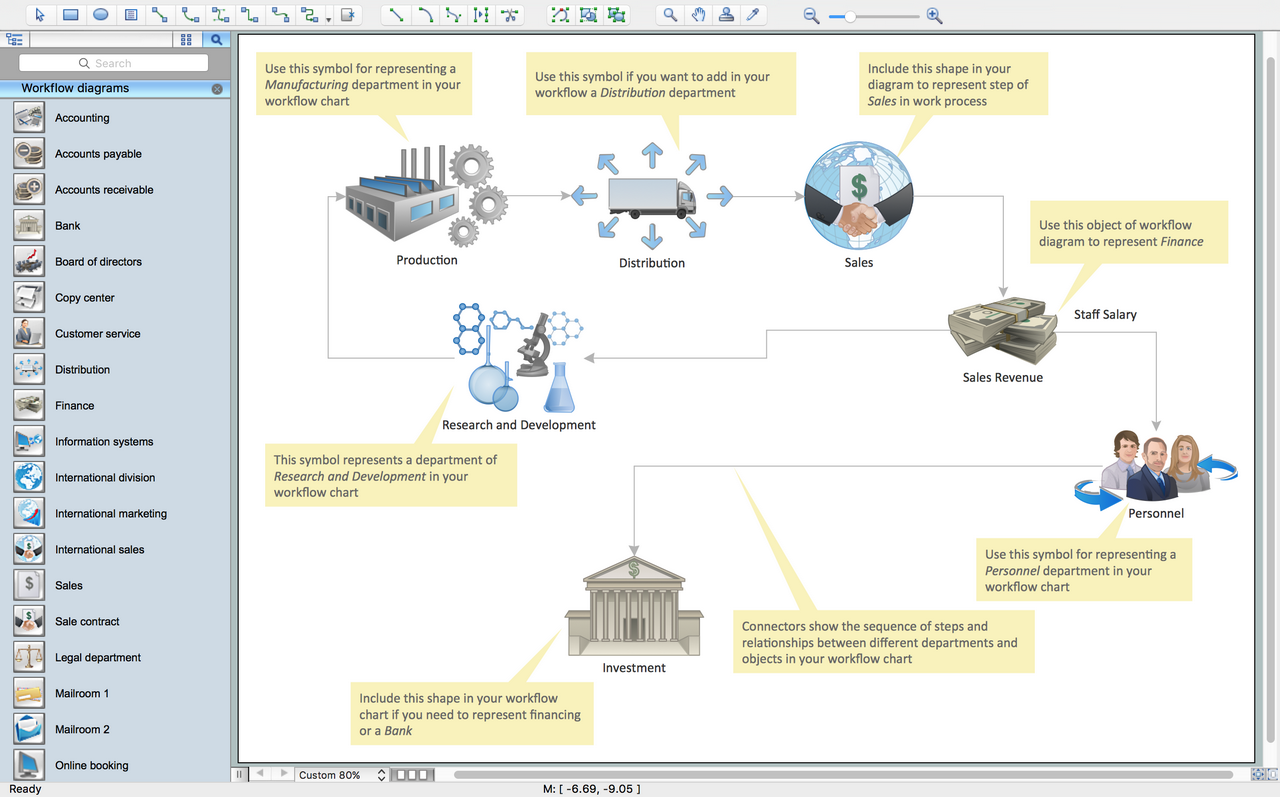
In any unclear situation create a workflow diagram. Workflow diagrams help to understand processes, find bottlenecks and fix the process. When you create workflow diagram using ConceptDraw DIAGRAM software you are able to focus on thinking, not drawing, that makes you as effective as possible.How To Create a Workflow Diagram
A workflow diagram is less general notation than a process flow diagram. Workflow as a term can apply to organizational process which involves people, resources, documents, sort of data, for instance; whereas a process is general collection of steps occuring in any sort of activity. That is why process flow diagram can be used as workflow diagram to describe business process, data flow or department interactions. The fastest way to create a workflow diagram is using pre-designed workflow template. ConceptDraw DIAGRAM with the Workflow Diagrams solution delivers rich set of workflow diagram templates you may start from.Android UI Design
The Android operating system is one of the most popular platforms today. It was developed and now used on smartphones, tablets, netbooks, smartbooks, and many other electronic devices, and combines the reliability, flexibility and ease of use. So, millions of people face daily with Android operating system on their devices, and thus one of important things for the developers of Android applications is developing of convenient and attractive Android UI design. ConceptDraw DIAGRAM diagramming and vector drawing software extended with Android User Interface Solution from the Software Development Area will help you in this.Business process Flow Chart — Event-Driven Process chain (EPC) diagrams
Event-Driven Process chain Diagrams for improvement throughout an organisation. Best software for Process Flow Diagram. The Event-driven Process Chain (EPC) Diagrams allows managers to plan processes and resources.Ishikawa Diagram
In almost every sphere of life and work the people time to time are faced with the fact that on their way there are certain obstacles and problems. But it is not always possible to identify the true cause of particular problem. To understand the basic causes of problems and eliminate them, it is convenient to use the chart of Kaoru Ishikawa - the technique specially designed for this. ConceptDraw DIAGRAM diagramming and vector drawing software extended with Fishbone Diagrams solution from the Management area can help you with construction the Fishbone Diagram also known as Ishikawa Diagram. Ishikawa Diagram shows factors of Equipment, Process, People, Materials, Environment and Management, all affecting the overall problem in one drawing for the further analysis. It is a well effective way to analyze the business problems you must identify and solve.Swim Lane Diagrams
Swim Lane Diagrams are the kind of process flow diagrams and effective tool for documenting the business processes required for any business company for its productive work, for easy defining the weak points, reasons of defects, or delays during the process. Swim Lane Diagram is based on the IDEF3 standard and was developed primarily for using in projecting. Its name derives from the use of horizontal or vertical lanes. The blocks that denote the parts of the processes are arranged within definite lanes according to the belonging to responsible worker. So the process of any complexity is visually divided into the parts and represented with indication the responsibility for execution of each part. This significantly facilitates the comprehension of its work. Use the ConceptDraw DIAGRAM software and predesigned vector objects from the Swim Lanes library of Business Process Mapping Solution included to ConceptDraw Solution Park to easy develop Swim Lanes Flowcharts and Diagrams, for modeling and documenting the business processes in a simple and visual graphic form.IDEF0 Flowchart Symbols
The modeling of business and business processes is not quite a simple process for both small-size businesses and large businesses. The IDEF0 method is one of the popular and easy methods of modeling the business as a complex system. It is based on the functional modeling language Structured Analysis and Design Technique (abbr. SADT) and is concentrated on the activity modeling. According to this method are constructed the IDEF0 Diagrams and IDEF0 Flowcharts, which are succesfully used not only for documenting the business, but also for analysis, development, integration of information and software systems, reengineering, etc. This method suggests the use of special IDEF0 Flowchart Symbols from the IDEF0 notation for construction the IDEF0 Flowcharts. ConceptDraw DIAGRAM diagramming and vector graphic software extended with IDEF0 Diagrams solution from the Software Development area of ConceptDraw Solution Park is rich for the powerful drawing tools, built-in templates and samples, and predesigned IDEF0 flowchart symbols.UML Deployment Diagram
UML Deployment Diagram depicts the physical deployment of artifacts on nodes (nodes are the existing hardware components, artifacts are the software components running on each node); and how the different pieces are connected. Use ConceptDraw DIAGRAM with UML deployment diagram templates, samples and stencil library from Rapid UML solution to model the physical deployment of artifacts on nodes of your software system.
UML Deployment Diagram. Design Elements
UML Deployment diagram describes the hardware used in system implementations and the execution environments and artifacts deployed on the hardware. ConceptDraw has 393 vector stencils in the 13 libraries that helps you to start using software for designing your own UML Diagrams. You can use the appropriate stencils of UML notation from UML Deployment library.UML Collaboration Diagram (UML2.0)
UML Collaboration Diagram depicts the interactions between objects or parts in terms of sequenced messages and describes both the static structure and dynamic behavior of a system. Rapid UML solution provides templates, examples and libraries of stencils for quick and easy drawing all the types of system and software engineering diagrams according to UML 2.4 and 1.2 notations.
Bar Diagrams for Problem Solving. Create manufacturing and economics bar charts with Bar Graphs Solution
Create bar charts for visualizing problem solving in manufacturing and economics using the ConceptDraw DIAGRAM diagramming and vector drawing software extended with the Bar Graphs Solution from the Graphs and Charts area of ConceptDraw Solition Park.Wireless Network Drawing
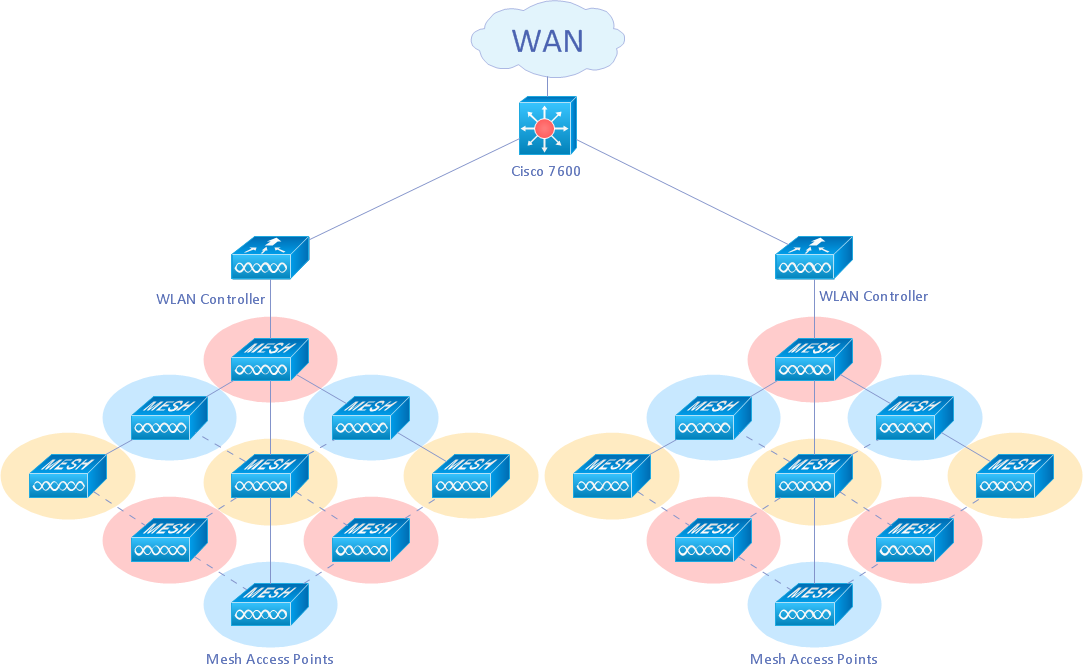
The Wireless Network solution helps users to quickly transition from an idea to the implementation of a wireless computer network. ConceptDraw DIAGRAM is well placed to provide experienced and comprehensive assistance in the workplace. The vector stencils, examples, and templates included to solution is a strong toolset for network engineer.Create UML Diagram
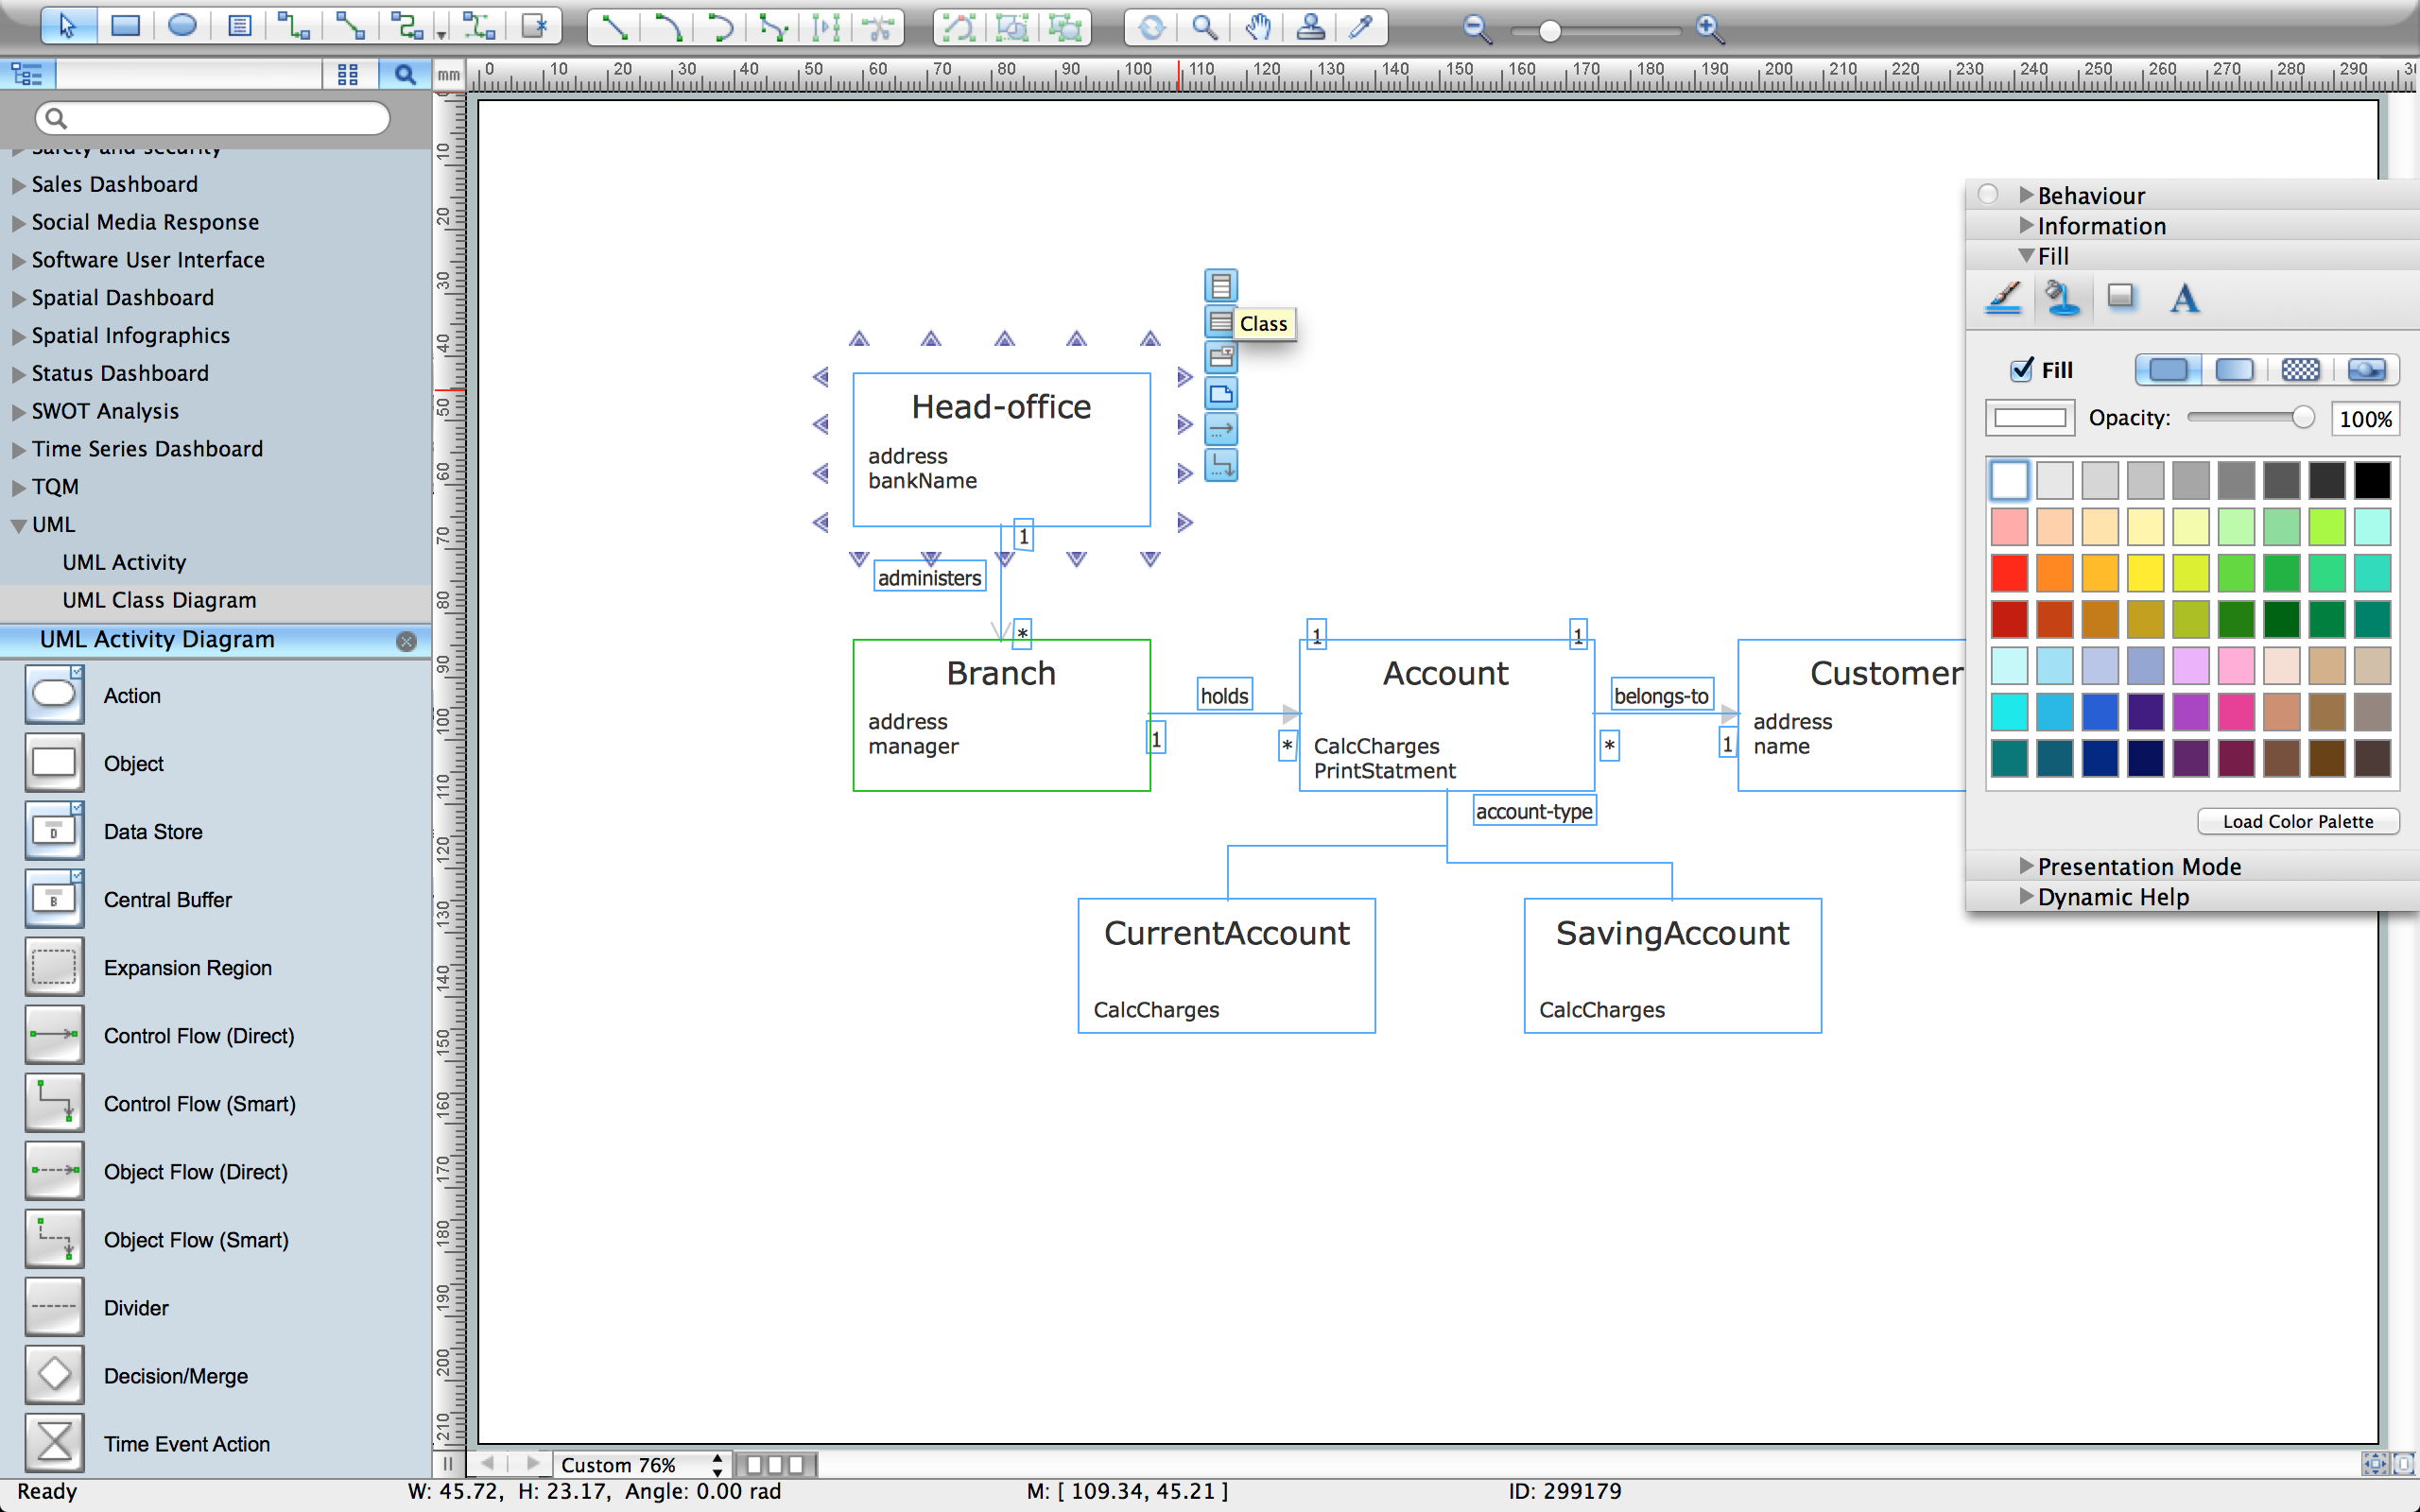
This sample is a UML Class Diagram that shows the banking system. The classes represented as boxes with attributes and are connected with dependency and synchronous message associations. The associations are indicated with the multiplicity 1..*. This sample can be used by the banks, by financial enterprises.- How To Change Wallpaper Draw Daigram
- Change Wallpaper Draw Diagram
- How To Change Wallpaper
- How to Add Different Backgrounds Within a Multipage Drawing ...
- How to Draw a Pie Chart Using ConceptDraw PRO | Process ...
- How To Make A Tree Chart For Project Wallpaper With Example
- How to Add Different Backgrounds Within a Multipage Drawing ...
- Basketball Court Dimensions | Basketball Court Diagram and ...
- Example of DFD for Online Store (Data Flow Diagram ) DFD ...
- Process Flowchart | Basic Flowchart Symbols and Meaning | Flow ...
- Euclidean algorithm - Flowchart | Solving quadratic equation ...
- Marketing Plan Infographic | How to Create Marketing Infographics ...
- Manufacturing 8 Ms fishbone diagram - Template | How Do ...
- Pyramid Diagram | Building Drawing Software for Design Site Plan ...
- Foot Ball Ground Diagram Image Download
- Infield Positioning for Baseball Situations | Baseball Diagram ...
- Draw A Workflow Diagram Of Mobile Phone
- Manufacturing Process Flow Chart
- Mind Map Exchange | Learning with MindMap | How to Exchange ...


