 Telecommunication Network Diagrams
Telecommunication Network Diagrams solution extends ConceptDraw DIAGRAM software with samples, templates, and great collection of vector stencils to help the specialists in a field of networks and telecommunications, as well as other users to create Computer systems networking and Telecommunication network diagrams for various fields, to organize the work of call centers, to design the GPRS networks and GPS navigational systems, mobile, satellite and hybrid communication networks, to construct the mobile TV networks and wireless broadband networks.
Network Diagram Software


Network Drawing Software

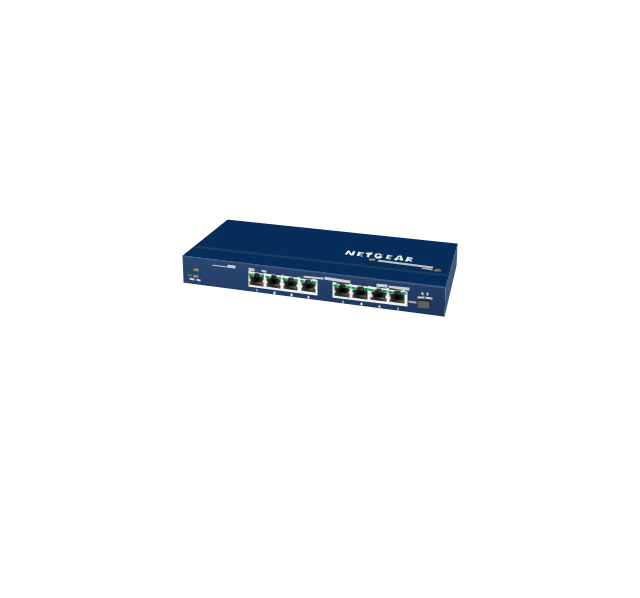
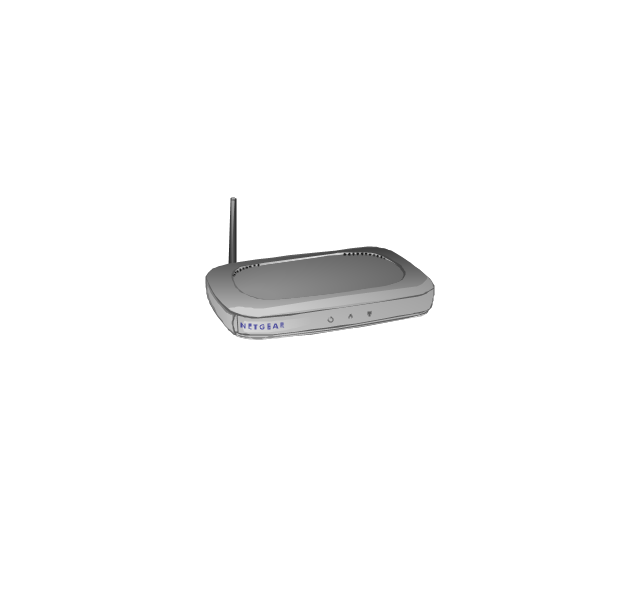
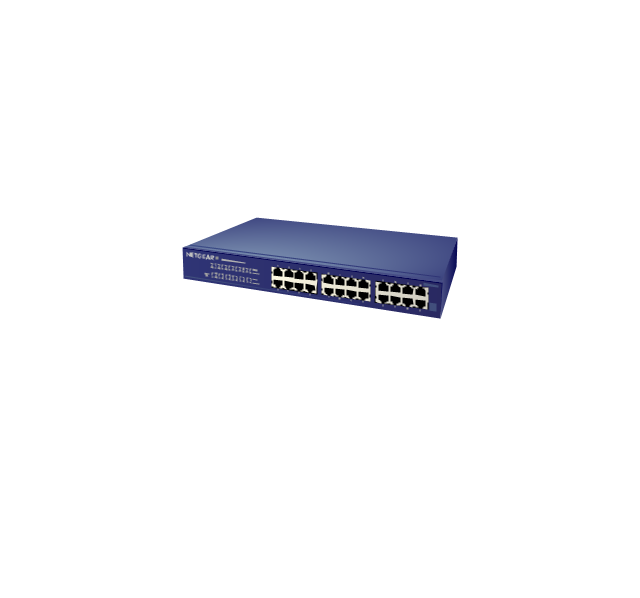
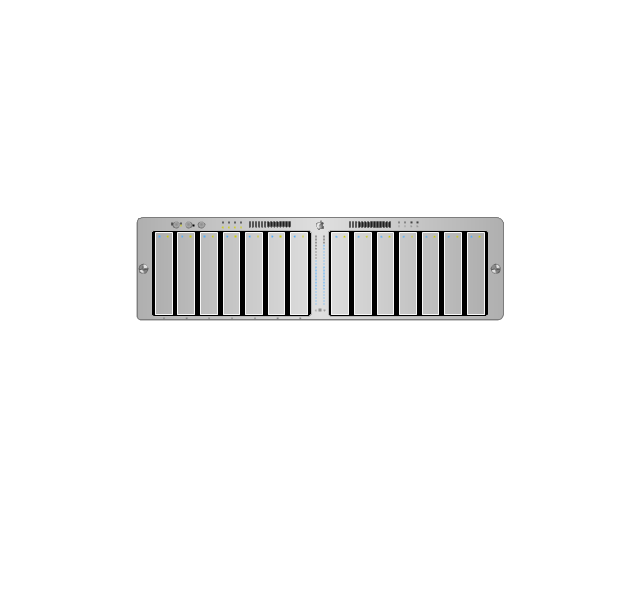
The vector stencils library "Computer network" contains 51 symbols of computer network devices and equipment for drawing computer network diagrams.
"Network Mapping Software.
A number of software tools exist to design computer network diagrams / or generate visual maps of networks, servers, storage, services, data centers, and other peripherals. Broadly, there are two types of software tools - those that help create diagrams manually and those that generate them using automated / semi-automated approaches.
Type of Software.
(1) Manual - allows users to design and draw logical and physical topology diagrams by manually placing icons and connections.
(2) Automated - generate topology diagrams / maps by traversing the network and automatically discovering resident devices or by importing network data." [Comparison of network diagram software. Wikipedia]
ConceptDraw PRO is the software for manual design of computer network diagrams. The solutions of the Computer and Networks area in ConceptDraw Solution Park extend ConceptDraw PRO with vector stencils libraries, templates and examples for creating the computer network diagrams.
The symbols example "Computer network - Vector stencils library" was created using the ConceptDraw PRO diagramming and vector drawing software extended with the Computer and Networks solution from the Computer and Networks area of ConceptDraw Solution Park.
www.conceptdraw.com/ solution-park/ computer-and-networks
Laptop
Desktop computer
Firewall
Bus

Ethernet
Star network

FDDI Ring

Token-ring

Comm-link

Modem
Laser printer
Inkjet printer
Image scanner
City

Ethernet hub
Wireless router
Network switch
iPod Classic

iPhone/ iPod Touch

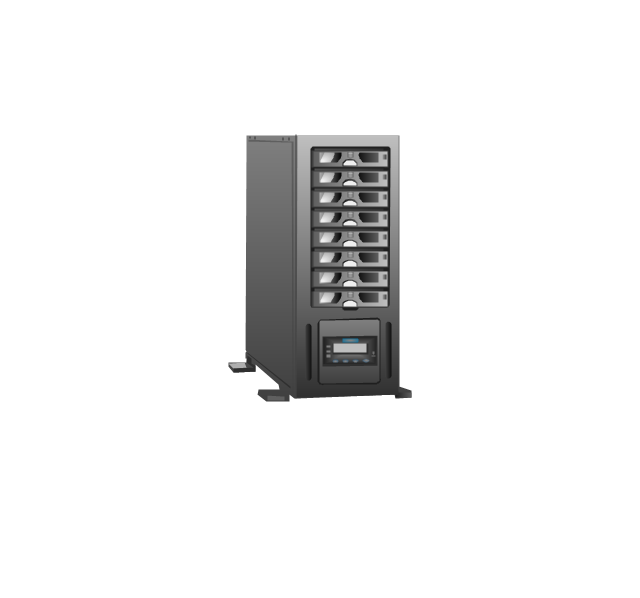
Xserve RAID
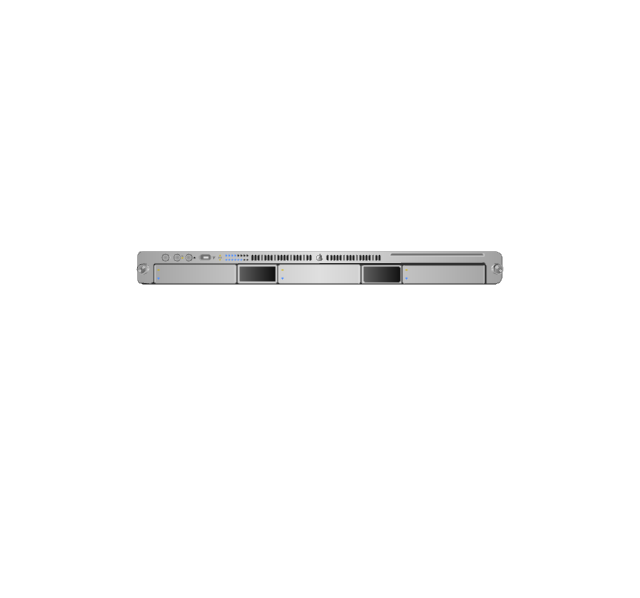
XServe
Apple Thunderbolt Display

Data store
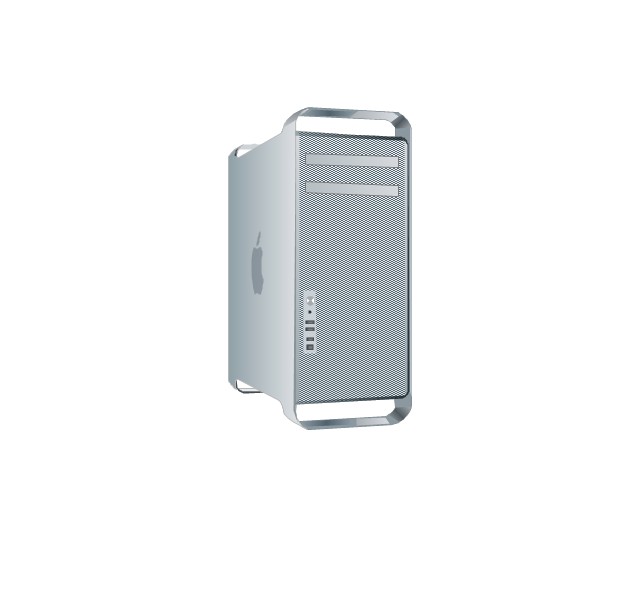
Mac Pro
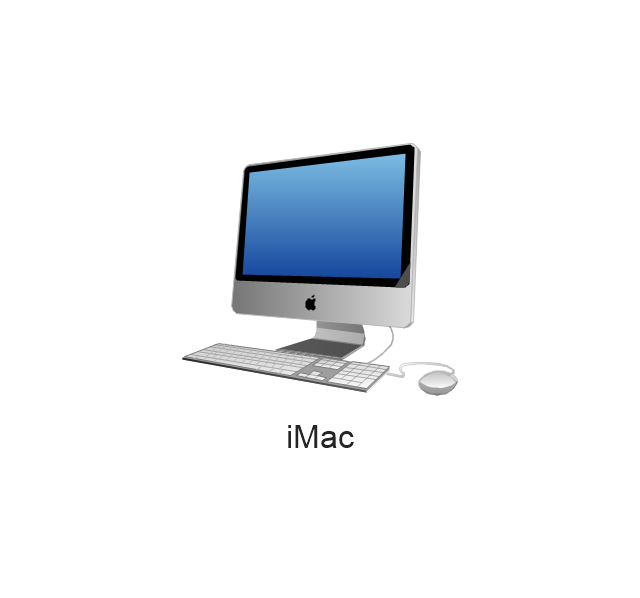
iMac
RAID
Mainframe

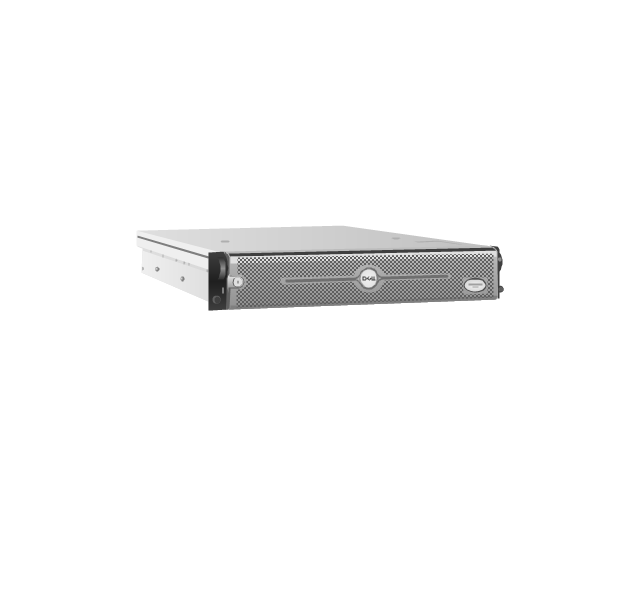
Rack-mountable server
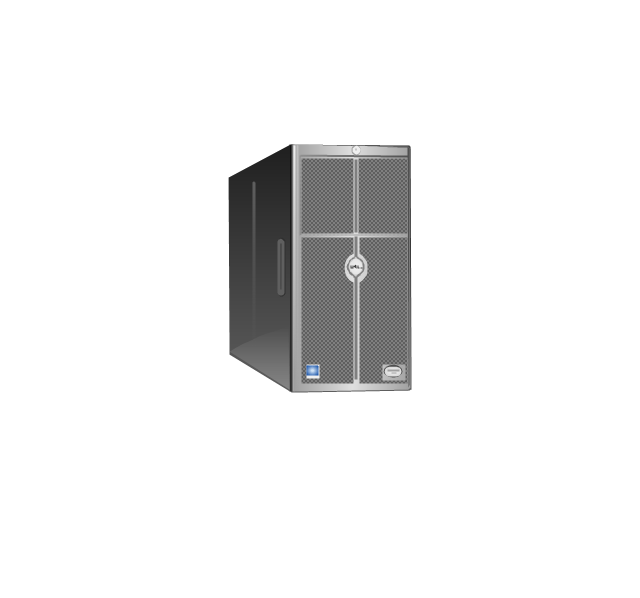
Server
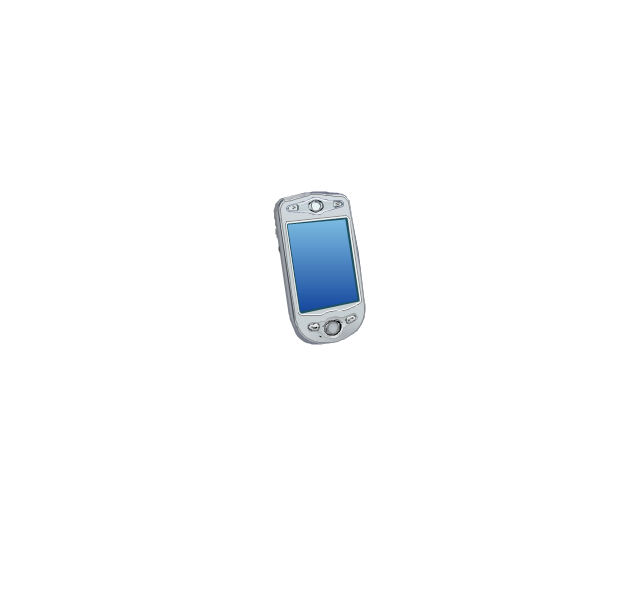
PDA
Cloud

Computer monitor
Workstation
Router
IP Phone
Fax
Mobile phone
Smartphone
Compact Disk

Mouse

Apple Wireless Mouse

Computer keyboard
Apple Keyboard
Radio tower

Satellite dish
Satellite
Webcam
AirPort Extreme

Airport Express
MacBook
iPhone 4

Network Diagram Software
 Computer and Networks Area
The solutions from Computer and Networks Area of ConceptDraw Solution Park collect samples, templates and vector stencils libraries for drawing computer and network diagrams, schemes and technical drawings.
This work flow chart sample was redesigned from the picture "Weather Forecast" from the article "Simulation Workflows".
[iaas.uni-stuttgart.de/ forschung/ projects/ simtech/ sim-workflows.php]
"(1) The weather is predicted for a particular geological area. Hence, the workflow is fed with a model of the geophysical environment of ground, air and water for a requested area.
(2) Over a specified period of time (e.g. 6 hours) several different variables are measured and observed. Ground stations, ships, airplanes, weather balloons, satellites and buoys measure the air pressure, air/ water temperature, wind velocity, air humidity, vertical temperature profiles, cloud velocity, rain fall, and more.
(3) This data needs to be collected from the different sources and stored for later access.
(4) The collected data is analyzed and transformed into a common format (e.g. Fahrenheit to Celsius scale). The normalized values are used to create the current state of the atmosphere.
(5) Then, a numerical weather forecast is made based on mathematical-physical models (e.g. GFS - Global Forecast System, UKMO - United Kingdom MOdel, GME - global model of Deutscher Wetterdienst). The environmental area needs to be discretized beforehand using grid cells. The physical parameters measured in Step 2 are exposed in 3D space as timely function. This leads to a system of partial differential equations reflecting the physical relations that is solved numerically.
(6) The results of the numerical models are complemented with a statistical interpretation (e.g. with MOS - Model-Output-Statistics). That means the forecast result of the numerical models is compared to statistical weather data. Known forecast failures are corrected.
(7) The numerical post-processing is done with DMO (Direct Model Output): the numerical results are interpolated for specific geological locations.
(8) Additionally, a statistical post-processing step removes failures of measuring devices (e.g. using KALMAN filters).
(9) The statistical interpretation and the numerical results are then observed and interpreted by meteorologists based on their subjective experiences.
(10) Finally, the weather forecast is visualized and presented to interested people." [iaas.uni-stuttgart.de/ forschung/ projects/ simtech/ sim-workflows.php]
The example "Workflow diagram - Weather forecast" was drawn using the ConceptDraw PRO diagramming and vector drawing software extended with the Workflow Diagrams solution from the Business Processes area of ConceptDraw Solution Park.
Work flow chart

 Wireless Networks
The Wireless Networks Solution extends ConceptDraw DIAGRAM software with professional diagramming tools, set of wireless network diagram templates and samples, comprehensive library of wireless communications and WLAN objects to help network engineers and designers efficiently design and create Wireless network diagrams that illustrate wireless networks of any speed and complexity, and help to identify all required equipment for construction and updating wireless networks, and calculating their costs.
- Telecommunication Network Diagrams | How to Create a ...
- Design elements - Telecommunication networks ...
- Telecommunication Network Diagrams | How To Create a MS Visio ...
- Telecommunication Network Diagrams | How to Create a ...
- How to Create a CCTV Diagram in ConceptDraw PRO | How to Trial ...
- How to Create a CCTV Diagram in ConceptDraw PRO | CCTV ...
- Telecommunication Network Diagrams | How to Create a ...
- Telecommunication Network Diagrams | How to Create a ...
- Telecommunication Network Diagrams | How to Create a ...
- Telecommunication Network Diagrams | How to Create a ...
- How to Create a CCTV Diagram in ConceptDraw PRO | CCTV ...
- Mobile satellite TV network diagram | Network Architecture | Network ...
- How to Create a CCTV Diagram in ConceptDraw PRO | How To ...
- How to Create a CCTV Diagram in ConceptDraw PRO | How To ...
- Logical network diagram | Satellite network diagram | Roaming ...
- How To Create CCTV Network Diagram | CCTV Network Diagram ...
- How to Create Network Diagrams | Using Both Wired and Wireless ...
- How To Create CCTV Network Diagram | How to Create a CCTV ...
- Hybrid satellite and common carrier network diagram | Satellite ...
- ConceptDraw PRO Network Diagram Tool | Mobile satellite ...