Corrective Action Planning
One of the stages of the problem's solving process scenario is Corrective Action Planning.
CORRECTIVE ACTIONS PLANNING Risk Diagram (PDPC)
Risk Diagram (PDPC). Analyze problem solving risks and propose preventive actions.
The Action Plan
In practice, the management team makes a decision on a problem in two stages. The first stage is problem analysis and the second stage is action planning.
CORRECTIVE ACTIONS PLANNING PERT Chart
Provide comprehensive visual tools for problem analysis.
PROBLEM ANALYSIS Relations Diagram
Analyze Factors Relations. Use the Relations Diagram to create a relations factors map and to identify which factors are “drivers” and “indicators”.
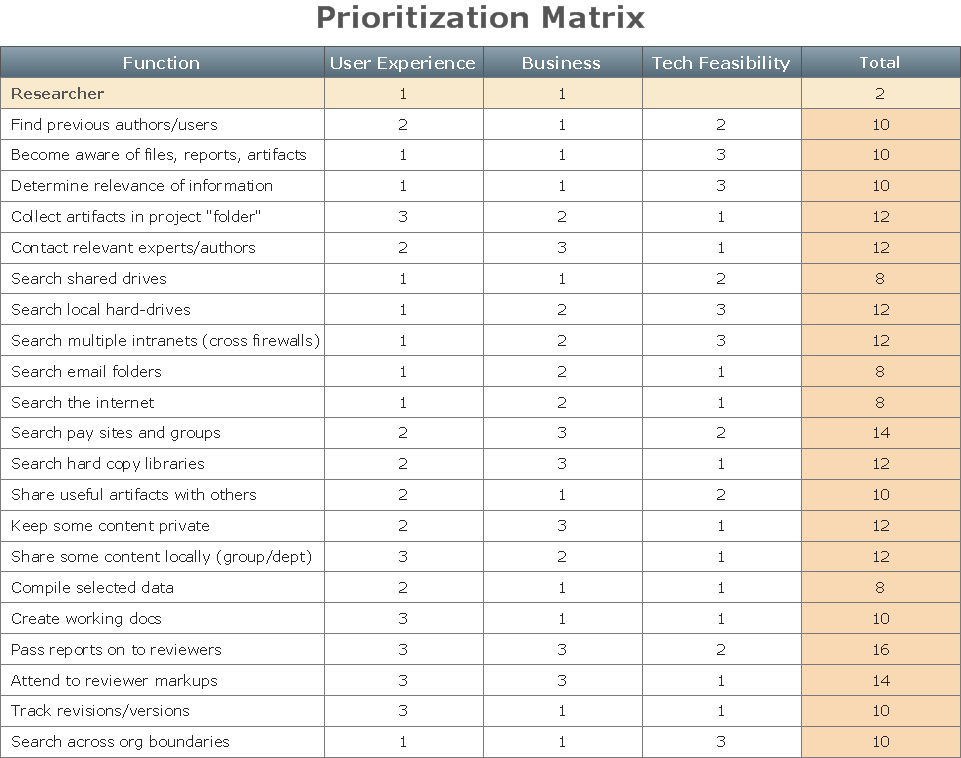
PROBLEM ANALYSIS Prioritization Matrix
Create Prioritization Matrix. Use the Prioritization Matrix to define factor priority.
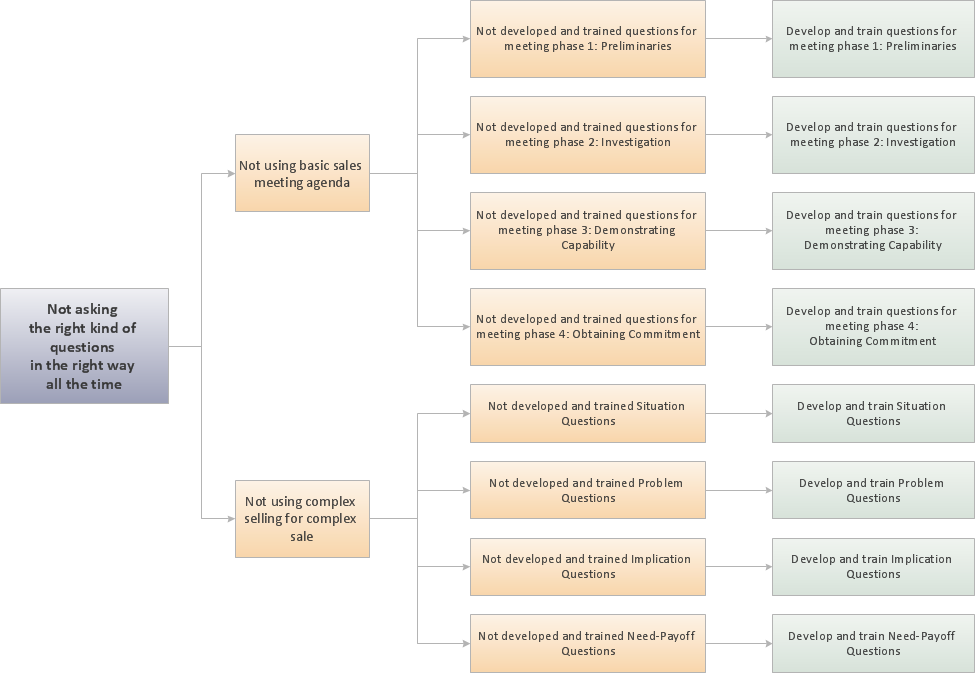
PROBLEM ANALYSIS Root Cause Analysis Tree Diagram
Root Cause Analysis Tree Diagram. Use the Root Cause Diagram to perform visual root cause analysis.
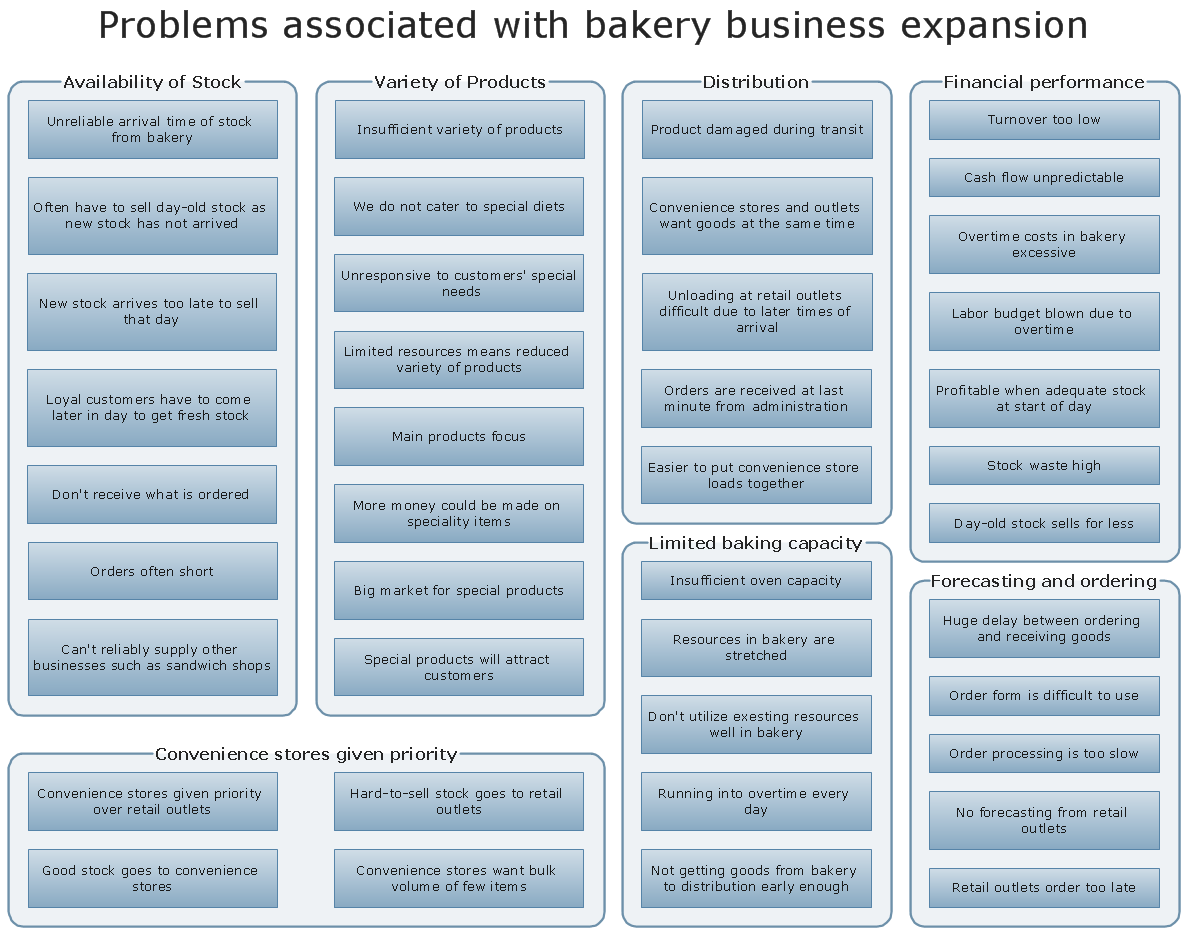
PROBLEM ANALYSIS Identify and Structure Factors
Identify and Structure Factors.Use the Affinity Diagram to collect and structure factors that impact on a problem.
Decision Making
Problem analysis. Affinity Diagram, Gather and structure factors. Create Affinity Diagram using ConceptDraw PRO.
Problem Analysis
Use ConceptDraw PRO for step-by-step analysis of problems and to plan corrective actions.
Root Cause Analysis
Root Cause Analysis Tree Diagram. This diagram is for Root Cause Analysis.Analyze the root causes for factors that influenced the problem using ConceptDraw.

Relationships Analysis
Relations Diagram - factors analysis, factors relations. Create Relations Diagram with ConceptDraw PRO.
Group Collaboration Software
A software for group collaboration helps to facilitate action-oriented teams working together over geographic distances by providing tools that aid communication.
Activity Network (PERT) Chart
Activity Network and Project Evaluation and Review Technique, or PERT, charts are a way of documenting and analyzing the tasks in a projectCause & Effect Analysis
Root Cause Analysis Tree Diagram. Use the Root Cause Analysis Diagram to perform visual root cause analysis.
Property Management Examples
This sample was created in ConceptDraw PRO diagramming and vector drawing software using the Seven Management and Planning Tools Solution from the Business Productivity area of ConceptDraw Solution Park.This sample shows the Property Management matrix, the ideas are ordered in regards to importance and frequency. This matrix gives the ability to turn the theory into quantifiable data.
Think. Act. Accomplish.
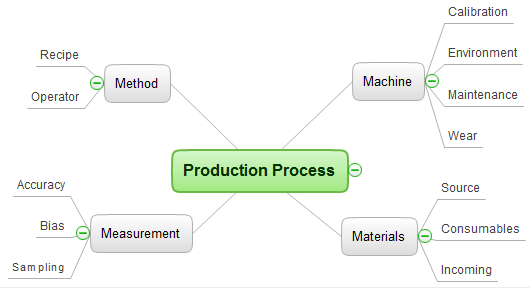
ConceptDraw MINDMAP is ready to provide you with mind mapping tool which can serve as comprehensive productivity tool for your business.- How to Draw an Organization Chart | Seven Management and ...
- Critical Path Method in ConceptDraw PROJECT | Program ...
- Project Task Trees and Dependencies | Decision Making ...
- PM Planning | How to Draw a Natural Landscape | Beauty in nature ...
- Program Evaluation and Review Technique (PERT) with ...
- Program Evaluation and Review Technique (PERT) with ...
- How To Plan and Implement Projects Faster | Decision Making ...
- Process decision program chart (PDPC) - Personal activity | Risk ...
- CORRECTIVE ACTIONS PLANNING PERT Chart - Conceptdraw.com
- PM Easy | Program Evaluation and Review Technique (PERT) with ...
- CORRECTIVE ACTIONS PLANNING PERT Chart | The Action Plan ...
- PERT chart - Project management plan | Program Evaluation and ...
- How to Draw an Organization Chart | Fault Tree Analysis Diagrams ...
- CORRECTIVE ACTIONS PLANNING Risk Diagram (PDPC ...
- Seven Management and Planning Tools | Business Productivity ...
- Seven Management and Planning Tools | Fishbone Diagram ...
- Program Evaluation and Review Technique (PERT) with ...
- Business diagrams & Org Charts with ConceptDraw PRO | PM Easy ...
- PM Easy | Program Evaluation and Review Technique (PERT) with ...
- Program Evaluation and Review Technique (PERT) with ...


