Technical Flow Chart Example
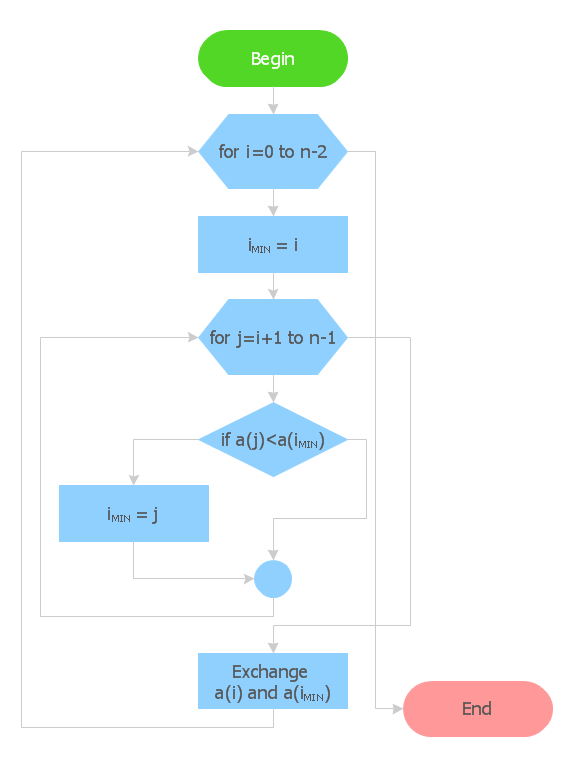
What illustrates a technical flow chart? Technical flow chart is a diagrammatic representation which visually illustrates the sequence of operations that must to be performed to get the problem's solution. ConceptDraw DIAGRAM enhanced with Flowcharts Solution from the "Diagrams" Area of ConceptDraw Solution is a perfect software for drawing Technical Flow Chart Example illustrating the essence and importance of the technical flow chart use.Examples Flowchart
ConceptDraw DIAGRAM diagramming and vector drawing software provides the unique Flowcharts Solution from the "Diagrams" Area of ConceptDraw Solution Park with variety of vector objects libraries and collection of examples Flowchart. Each example flowchart included in Flowcharts solution is a real help in drawing process, it can be the good base or perfect source of inspiration.
Technical Flow Chart
Flow chart is a diagrammatic representation of an algorithm and essential part of planning the system. Flow charts are widely used in technical analysis and programming for easy writing programs and explaining them to others. So, one of the most popular type of flow charts is Technical Flow Chart. Technical Flow Chart can be drawn by pencil on the paper, but it will be easier to use for designing a special software. ConceptDraw DIAGRAM diagramming and vector drawing software extended with Flowcharts Solution from the "Diagrams" Area of ConceptDraw Solution Park will be useful for this goal.HelpDesk
How to Create Flowchart Using Standard Flowchart Symbols
Flowcharts are used to display an algorithm for consistent execution of certain steps. Flowchart is probably the easiest way to make a graphical representation of any process. Flowcharts use the set of standard geometric symbols and arrows to define relationships. ConceptDraw DIAGRAM allows you to create professional flowchart quickly and easily. The ability to create flowcharts is contained in the Flowcharts solution. The solution provides a set of special tools for creating flowcharts.Audit Flowchart Symbols
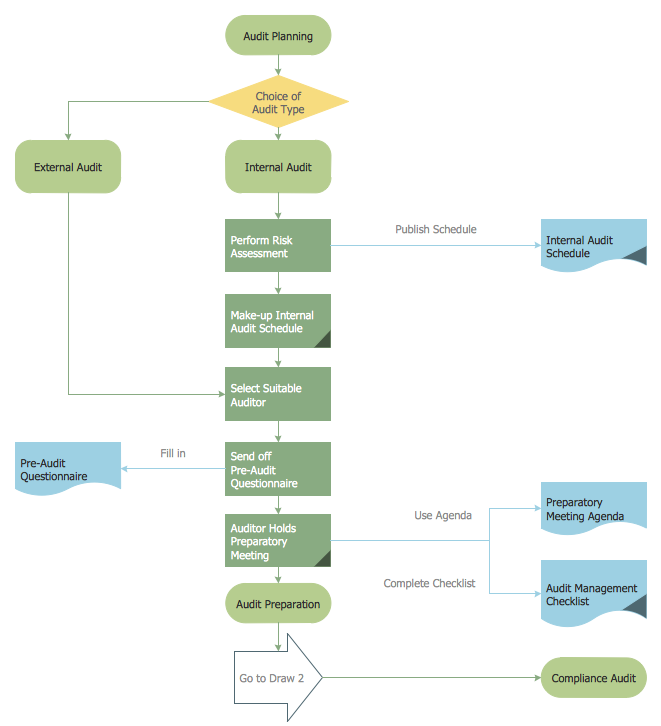
The audit is a complex process consisting of defined quantity of steps, which have as a final goal the ensuring of success of a certain business project. It includes the independent examination of data, statements and financial performances of an enterprise for a stated purpose. It is convenient to construct the Audit Flowcharts or Audit Diagrams for visual representation and structuring the audit processes. ConceptDraw DIAGRAM diagramming software enhanced with Audit Flowcharts solution from the Finance and Accounting area of ConceptDraw Solution Park effectively helps to draw the Audit Diagrams for accounting, finance and money management, the Audit Flowcharts for fiscal information tracking, financial inventories and documenting Six Sigma, the decision making Flow Charts, etc. This solution provides the powerful drawing tools, numerous templates and samples, and large quantity of vector audit flowchart symbols that greatly facilitate the process of representation the audit steps and audit results, and designing efficient and visually appealing Audit Flowcharts.How to Make an Accounting Process Flowchart
Tips on how to make an accounting flowchart. Describing methods and symbols that are used to represent the accounting system.Cross-Functional Flowchart
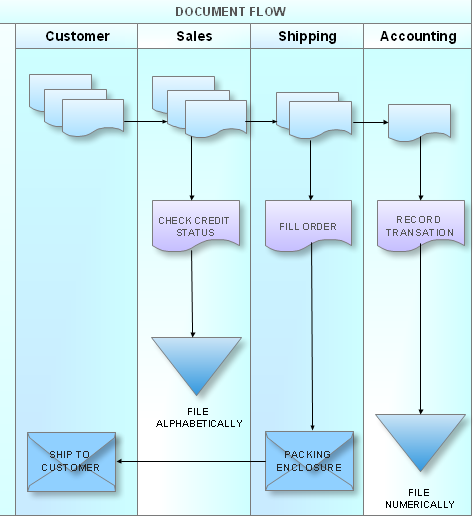
Use of Cross-Functional Flowchart is a clear way of showing each team member’s responsibilities and how processes get shared or transferred between different responsible people, teams and departments. Use the best flowchart maker ConceptDraw DIAGRAM with a range of standardized cross-functional flowchart symbols to create the Cross-Functional Flowcharts simply and to visualize the relationship between a business process and the functional units responsible for that process. To draw the most quickly Cross-Functional Flowcharts, Cross Functional Process Maps, or Cross Functional Process Flow Diagrams, start with a Cross-functional flowchart samples and templates from ConceptDraw Solution Park. The ConceptDraw Arrows10 and RapidDraw technologies will be also useful for you in drawing. ConceptDraw DIAGRAM supports designing both types - horizontal and vertical Cross-functional flowcharts. A vertical layout makes the accents mainly on the functional units while a horizontal layout - on the process. If you need a Visio alternative in Mac OS X, try ConceptDraw DIAGRAM. Its interface is very intuitive and it’s actually much easier to use than Visio, yet somehow it’s just as powerful if not more so. ConceptDraw DIAGRAM performs professional quality work and seamless Visio interaction.HelpDesk
How to Create an Accounting Flowchart
An Accounting flowchart is a specialized type of flowchart. With the help of an accounting flowchart, you can visually describe tasks, documents, people responsible for execution at each stage of the accounting workflow. Find out how you can easily create an accounting flowchart of any complexity using Accounting Flowchart Solution from the ConceptDraw Solution Park.HelpDesk
How to Create an Audit Flowchart
Audit flowcharts are often used in auditors activity. This is the most effective way of preparation and documentation of the audit process. Financial audit process has a clear structure, and therefore audit flowchart is often used to denote an audit process. This is the most effective way of preparation and documentation of the audit process. Flowcharts are often used in auditors activity. A flowchart may be created at any stage of an audit process as an aid in the determination and evaluation of a client's accounting system. ConceptDraw DIAGRAM allows you to create professional accounting flowchart quickly using the professional Audit Flowcharts solution.Flowchart Examples
It’s very simple, convenient and quick to design professional looking Flowcharts of any complexity using the ConceptDraw DIAGRAM diagramming and vector drawing software extended with Flowcharts Solution from the "Diagrams" Area of ConceptDraw Solution Park which provides a wide set of predesigned objects, templates, samples and Flowchart examples.How to Draw an Effective Flowchart
Use ConceptDraw DIAGRAM diagramming and business graphics software to draw your own flowcharts of business processes.How To Create a Flow Chart in ConceptDraw
ConceptDraw DIAGRAM is a flowchart creating software. This software includes over 20 vector stencils in libraries. These objects allow you to create well-designed flowcharts. Put an initial object from library to a page and use RapidDraw technology clicking on direction arrows to add new objects to the flowchart. This way you can make flowchart quickly.How to draw a Cross-Functional Flowchart
Is it possible to develop a diagram as quickly as the ideas come to you? The innovative ConceptDraw Arrows10 Technology included in ConceptDraw DIAGRAM is a powerful drawing tool that changes the way diagrams are produced. While making the drawing process easier and faster.Flowchart on Bank. Flowchart Examples
This sample was created in ConceptDraw DIAGRAM diagramming and vector drawing software using the Flowcharts solution from the Diagrams area of ConceptDraw Solution Park. This sample shows the Flowchart of the Subprime Mortgage Crisis. This Flowchart describes the decline in housing prices when the housing bubble burst and what it caused on the housing and financial markets. You can also see the Government and Industry responses in this crisis situation.HelpDesk
How to Create a HR Process Flowchart
One of the useful tools of each HR specialist is a HR Process Flowchart. HR Flowchart renders step-by-step the process of Human Resource management in any organization. HR flowchart shows the flow of all HR processes, identifies and standardizes the list of mandatory documents required for the implementation of all HR procedures, including the recruiting process. Usually, the descriptions of entire HR processes in a company requires a big set of graphic documents. They must be regularly redrawn to maintain up to date. The best tool for this is ConceptDraw DIAGRAM - the best software to create process flow diagrams of various types. In conjunction with ConceptDraw HR flowchart solution, it delivers comprehensive tool-set for human resource management.How to Draw a Flowchart
A good Flowchart is incredibly helpful for representing and understanding the system and systematic flow of information in the system. That's why its creation requires attention, accuracy, caution and expertise. There are many standardized symbols which can be used in Flowcharts to represent different kinds of steps. The basic flowchart's element is a simple action, which is represented as a box containing description of the action. The flow is shown with arrows between sequential action boxes. The decision is shown as a diamond that contains a simple question to which the answer is 'yes' or 'no' Are you confused on how to draw a Flowchart? ConceptDraw DIAGRAM diagramming and vector drawing software will help you in flowchart drawing due to the included templates, samples and vector objects libraries which are offered in great quantity by Flowcharts solution from Diagrams area. Besides you need clearly and accurately define the process boundaries with starting and ending points, and each step in the process, identify time lags and non-value-adding steps.Software for flowchart diagrams
Software for flowchart diagrams can help you: represents an algorithm or process, illustrates a solution to a given problem, represented process operations, analyzing a business process, designing a business process, documenting a business process, optimizing a business process. The Flowcharts Solution from the "Diagrams" area of ConceptDraw Solution Park contains a wide set of predesigned templates, samples and 3 libraries.HelpDesk
How to Draw a Process Flow Diagram
Process Flow diagrams are used in chemical and process engineering to show the flow of chemicals and the equipment involved in the process. When it comes to creating a process flow diagram, it's important to use software that is capable of describing a wide range of processes, using techniques and graphical notation that are easily recognized by engineering workers. An ideal drawing platform will utilize functions that can cope with the output of a high volume of engineering processes, that may change rapidly from development to implementation stages. ConceptDraw DIAGRAM , with the extended functionality of the Chemical and Process Engineering Diagrams solution, is the ideal medium for creating designs of this type. The Chemical and Process Engineering Diagrams solution complements this feature with a library of selected icons to represent various steps — all instantly recognizable and applicable to a wide user base. ConceptDraw DIAGRAM allows you to draw the Process Flow diagram easily using the set of special libraries.Flow Chart Design — How to Design a Good Flowchart
Use ConceptDraw DIAGRAM business diagramming and business graphics software for general diagramming purposes, it inludes tousands colored professional flowchart symbols, examples and samples which saves time when you prepare documents, professional presentations or make an explanation of process flow diagram.- How to Create Flowcharts for an Accounting Information System ...
- How to Draw Pictorial Chart. How to Use Infograms | Workflow ...
- Basic Flowchart Symbols and Meaning | Account Flowchart ...
- How to Add a Cross-Functional Flowchart to a PowerPoint ...
- Basic Flowchart Symbols and Meaning | Entity Relationship ...
- Cross Functional Flowchart Symbols
- Process Flowchart | Basic Flowchart Symbols and Meaning | Flow ...
- Cross Functional Flowchart Symbols | How to Create a Cross ...
- Process Flowchart | Types of Flowchart - Overview | Flow Chart ...
- Approval Process and Segregation of Responsibilities Accounting ...