Basic Diagramming
Mathematics is an exact science, which studies the values, spatial forms and quantitative relations. It is a science, in which is built large number of various diagrams, charts and graphs that present the material in a clear, visual and colorful form, help to analyze the information and to make certain conclusions. A diagram is a graphical representation of data using the linear segments or geometric shapes, which allows to evaluate the ratio of several values. Depending on the types of solved tasks are used the diagrams of different kinds. A graph is a diagram that shows quantitative dependencies of various processes using the curves. ConceptDraw PRO is a powerful intelligent and multifunctional vector engine for drawing different Mathematical diagrams and graphs, Mathematical illustrations, complex and simple Diagram mathematics, Flowcharts of equation solving process, Line graphs, Scatter plots, Histograms, Block diagrams, Bar charts, Divided bar diagrams, Pie charts, Area charts, Circular arrows diagrams, Venn diagrams, Bubble diagrams, Concept maps, and many others.
 ConceptDraw Solution Park
ConceptDraw Solution Park collects graphic extensions, examples and learning materials
HelpDesk
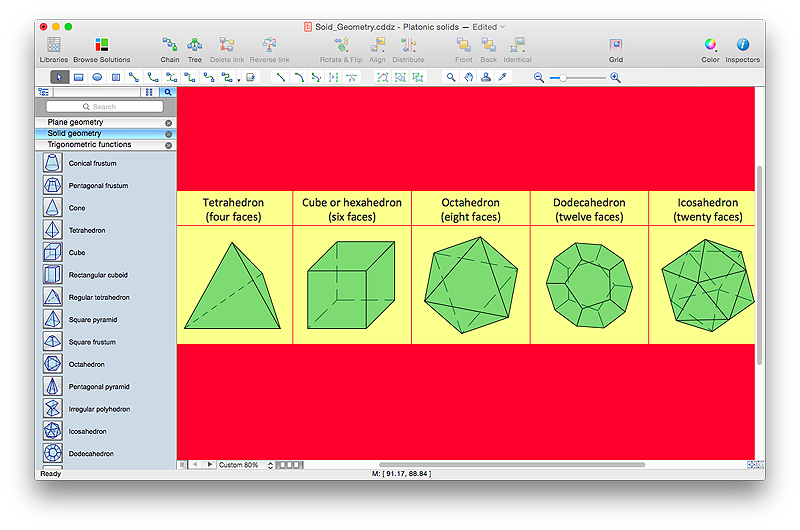
How to Draw Geometric Shapes in ConceptDraw PRO
Knowledge of geometry grants people good logic, abstract and spatial thinking skills. The object of study of geometry are the size, shape and position, the 2-dimensional and 3-dimensional shapes. Geometry is related to many other areas in math, and is used daily by engineers, architects, designers and many other professionals. Today, the objects of geometry are not only shapes and solids. It deals with properties and relationships and looks much more about analysis and reasoning. Geometry drawings can be helpful when you study the geometry, or need to illustrate the some investigation related to geometry. ConceptDraw PRO allows you to draw plane and solid geometry shapes quickly and easily.
 PM Easy
This solution extends ConceptDraw PROJECT software with the ability to quickly start a project; it lists task relationships and dependencies to make iterative planning easy.
Scatter Chart Examples
The Line Graphs solution from Graphs and Charts area of ConceptDraw Solution Park contains a set of examples, templates and design elements library of scatter charts. Use it to draw scatter graphs using ConceptDraw PRO diagramming and vector drawing software for illustrating your documents, presentations and websites.Influence Diagram
This sample shows the Influence Diagram. It was created in ConceptDraw PRO diagramming and vector drawing software using the Basic Diagramming Solution from the Universal Diagramming area of ConceptDraw Solution Park. Influence diagram represents the directed acyclic graph with three types of nodes and three types of arcs that connect the nodes. Decision node is drawn as a rectangle, Uncertainty node is drawn as an oval, Value node is drawn as an octagon.
 Social Media Response
This solution extends ConceptDraw PRO and ConceptDraw MINDMAP with the ability to draw interactive flow charts with action mind map templates, to help create an effective response to applicable social media mentions.
 What is a Diagram Area
Solutions of the area What is a Diagram from ConceptDraw Solution Park collect templates, samples and vector stencils libraries for drawing diagrams visualizing qualitative information and knowledge.
 Composition Dashboard
Composition dashboard solution extends ConceptDraw PRO software with templates, samples and vector stencils library with charts and indicators for drawing visual dashboards showing data composition.
 Project Exchange
This solution extends ConceptDraw PROJECT and ConceptDraw MINDMAP software with the ability to import and export project data.
 Value Stream Mapping
Value stream mapping solution extends ConceptDraw PRO software with templates, samples and vector stencils for drawing the Value Stream Maps (VSM) in lean manufacturing practice.
 Event-driven Process Chain Diagrams
Event-driven Process Chain (EPC) Diagram is a type of flowchart widely used for modeling in business engineering and reengineering, business process improvement, and analysis. EPC method was developed within the Architecture of Integrated Information Systems (ARIS) framework.
 PM Teams
This solution extends ConceptDraw Office 2.0 products with a single information space for messaging to teams.
 Spatial Infographics
Spatial infographics solution extends ConceptDraw PRO software with infographic samples, map templates and vector stencils libraries with design elements for drawing spatial information graphics.
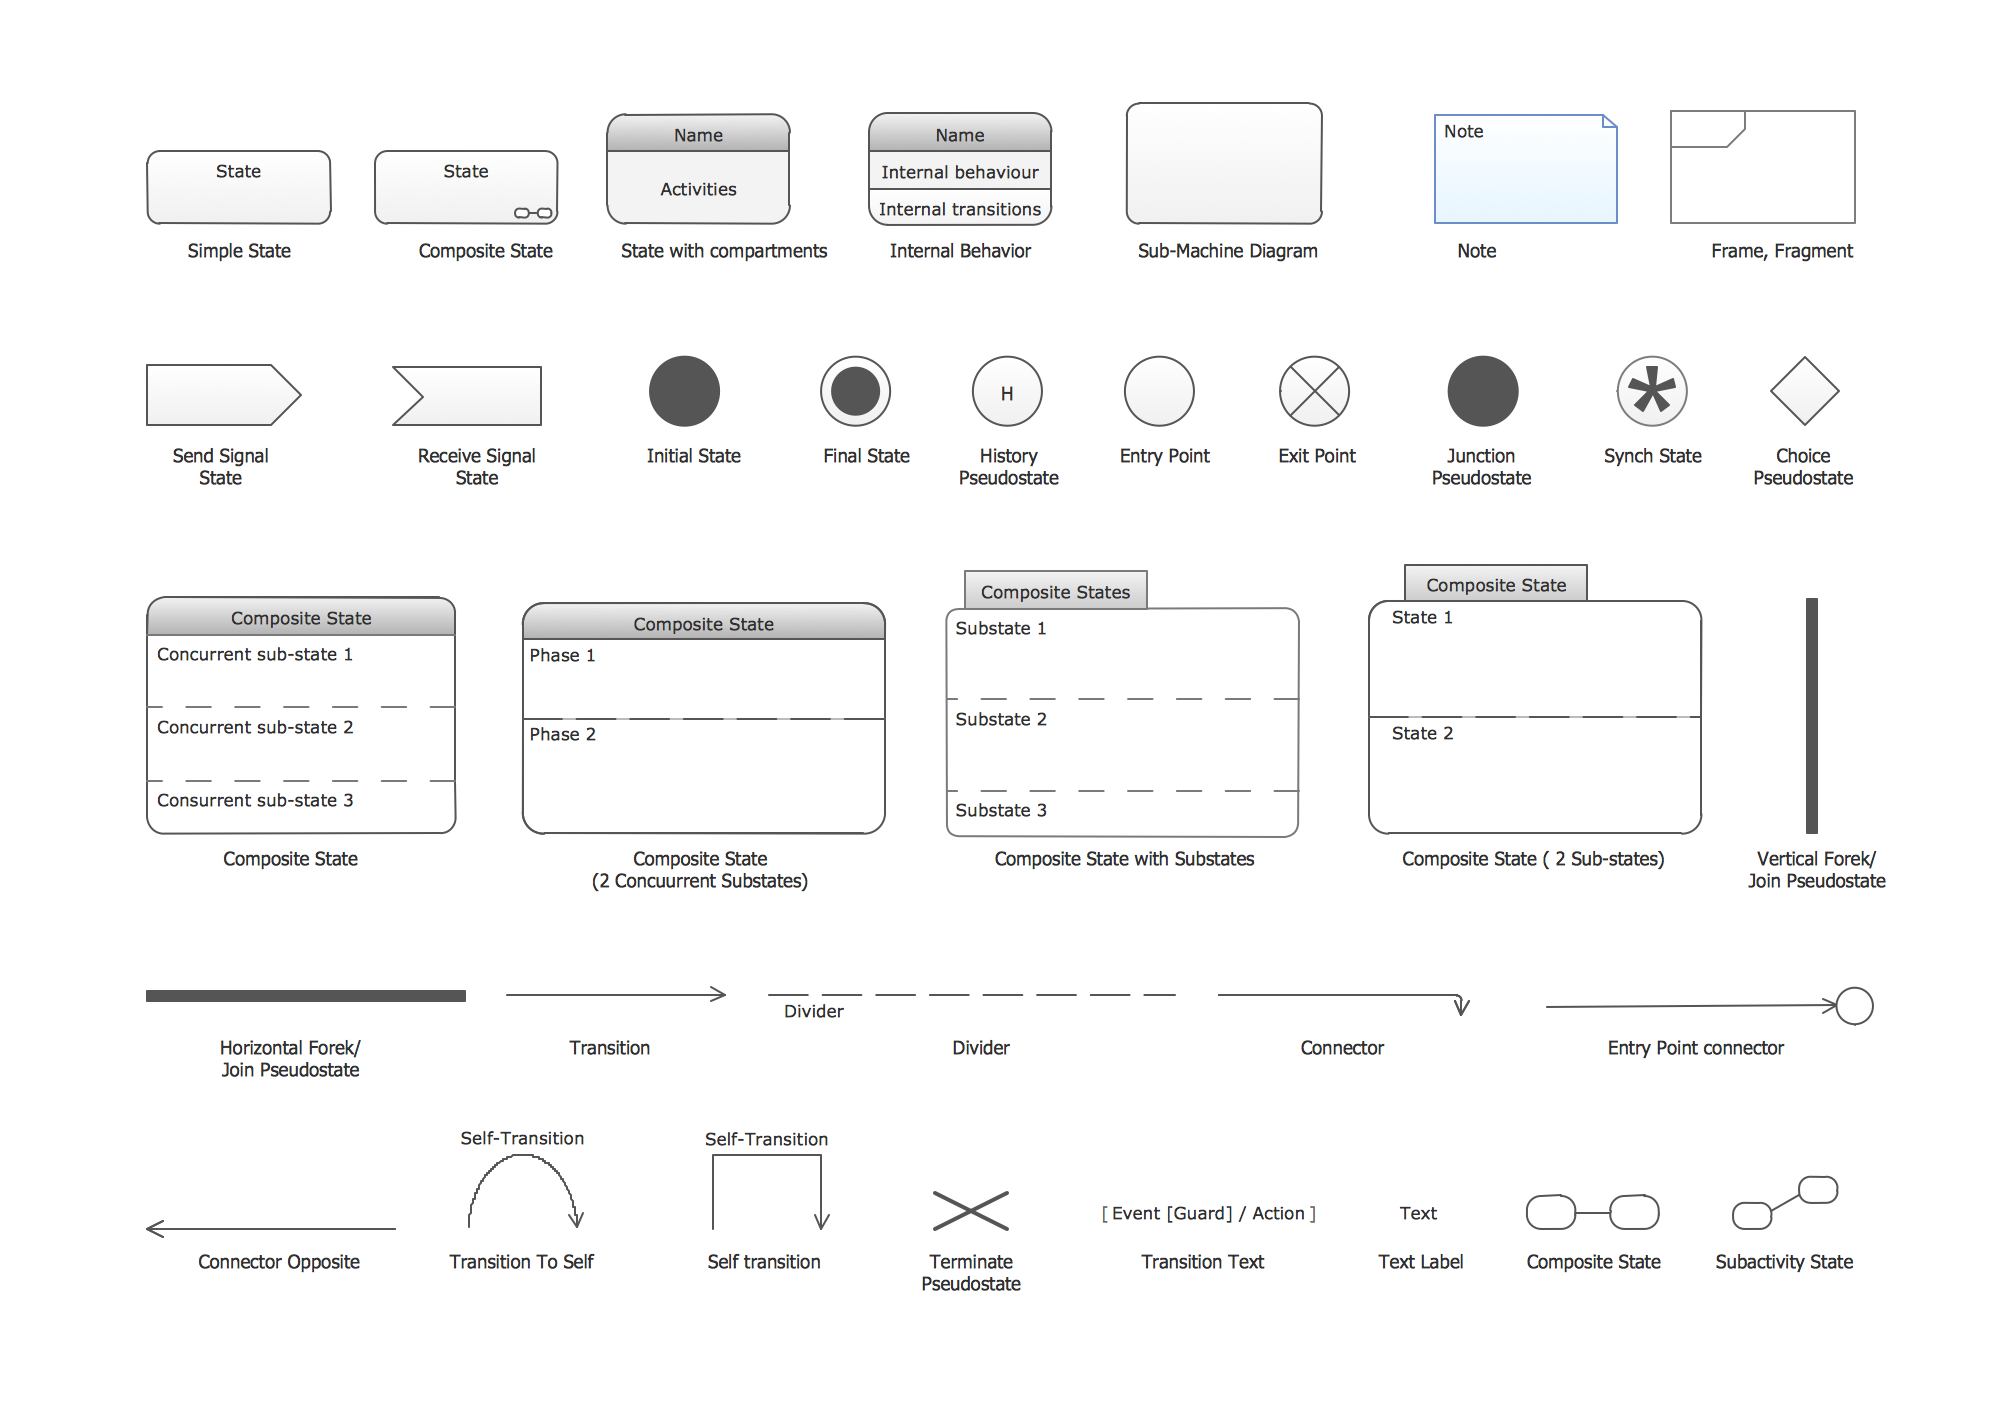
UML State Machine Diagram.Design Elements
UML state machine's goal is to overcome the main limitations of traditional finite-state machines while retaining their main benefits. ConceptDraw has 393 vector stencils in the 13 libraries that helps you to start using software for designing your own UML Diagrams. You can use the appropriate stencils of UML notation from UML State Machine library.
 Business Process Diagrams
The Business Process Diagram Solution extends ConceptDraw PRO v10 BPMN software with its RapidDraw interface, templates, samples, and libraries based on the BPMN 1.2 and BPMN 2.0 standards. This powerful solution permits you to visualize easily both simple and complex processes, as well as design business models. The Business Process Diagram solution allows one to quickly develop and document in detail any business processes at any stage of a project’s planning and implementation.
 Histograms
How to make a Histogram? Making a Histogram is an incredibly easy process when it is done with ConceptDraw PRO. The Histograms Solution enhances ConceptDraw PRO v10 functionality with extensive drawing tools, numerous samples, and examples; also a quick-start template and library of ready vector stencils for visualization the data and professional drawing Histograms.
- Pie Chart Examples | Pie Chart Software | Basic Diagramming |
- Arrow circle chart template | Basic Diagramming | Circular Arrows ...
- Basic Diagramming | Venn diagrams with ConceptDraw PRO | Line ...
- How To Create a Bubble Chart | Bubble diagrams with ...
- Concept maps with ConceptDraw PRO | Basic Diagramming ...
- Chart Examples | Basic Diagramming | Best Software to Draw ...
- Simple Diagramming | Simple Drawing Applications for Mac | Visual ...
- Example Process Flow | Example of Flowchart Diagram | Flow Chart ...
- Concept Maps
- Basic Diagramming | Picture Graphs | Create Graphs and Charts |
- Bubble diagrams in Landscape Design with ConceptDraw PRO ...
- Pie Chart Examples | Pie Chart Software | The Best Drawing ...
- The Best Drawing Program for Mac | Best Software to Draw ...
- Best Diagramming Software for Mac | The Best Drawing Program for ...
- The Best Mac Software for Diagramming or Drawing | Simple ...
- Basic Diagramming | Arrow circle chart template | How to Draw a ...
- Best Software to Draw Diagrams | Best Diagramming Software for ...
- The Best Flowchart Software Available | The Best Drawing Program ...
- How to Draw an Organization Chart | How to Draw a Flowchart ...
- Bubble diagrams in Landscape Design with ConceptDraw PRO ...


