Mathematical Diagrams
ConceptDraw DIAGRAM diagramming and vector drawing software extended with Mathematics solution from the Science and Education area is the best for creating: mathematical diagrams, graphics, tape diagrams various mathematical illustrations of any complexity quick and easy. Mathematics solution provides 3 libraries: Plane Geometry Library, Solid Geometry Library, Trigonometric Functions Library.
 Mathematics
Mathematics solution extends ConceptDraw DIAGRAM software with templates, samples and libraries of vector stencils for drawing the mathematical illustrations, diagrams and charts.
Basic Diagramming
Mathematics is an exact science, which studies the values, spatial forms and quantitative relations. It is a science, in which is built large number of various diagrams, charts and graphs that present the material in a clear, visual and colorful form, help to analyze the information and to make certain conclusions. A diagram is a graphical representation of data using the linear segments or geometric shapes, which allows to evaluate the ratio of several values. Depending on the types of solved tasks are used the diagrams of different kinds. A graph is a diagram that shows quantitative dependencies of various processes using the curves. ConceptDraw DIAGRAM is a powerful intelligent and multifunctional vector engine for drawing different Mathematical diagrams and graphs, Mathematical illustrations, complex and simple Diagram mathematics, Flowcharts of equation solving process, Line graphs, Scatter plots, Histograms, Block diagrams, Bar charts, Divided bar diagrams, Pie charts, Area charts, Circular arrows diagrams, Venn diagrams, Bubble diagrams, Concept maps, and many others.
Mathematics Symbols
ConceptDraw DIAGRAM extended with Mathematics solution from the Science and Education area is a powerful diagramming and vector drawing software that offers all needed tools for mathematical diagrams designing. Mathematics solution provides 3 libraries with predesigned vector mathematics symbols and figures: Solid Geometry Library, Plane Geometry Library and Trigonometric Functions Library.HelpDesk
How to Draw Geometric Shapes
Knowledge of geometry grants people good logic, abstract and spatial thinking skills. The object of study of geometry is the size, shape and position, the 2-dimensional and 3-dimensional shapes. Geometry is related to many other areas in math and is used daily by engineers, architects, designers, and many other professionals. Today, the objects of geometry are not only shapes and solids. It deals with properties and relationships and looks much more about analysis and reasoning. Geometry drawings can be helpful when you study geometry or need to illustrate some investigation related to geometry. ConceptDraw DIAGRAM allows you to draw plane and solid geometry shapes quickly and easily.Cylinder Venn Diagram
You need design Cylinder Venn Diagram? Nothing could be easier with ConceptDraw DIAGRAM diagramming and vector drawing software extended with Venn Diagrams Solution from the “Diagrams” Area. ConceptDraw DIAGRAM allows you to design various Venn Diagrams including Cylinder Venn Diagrams.Preparing for a lecture mind map
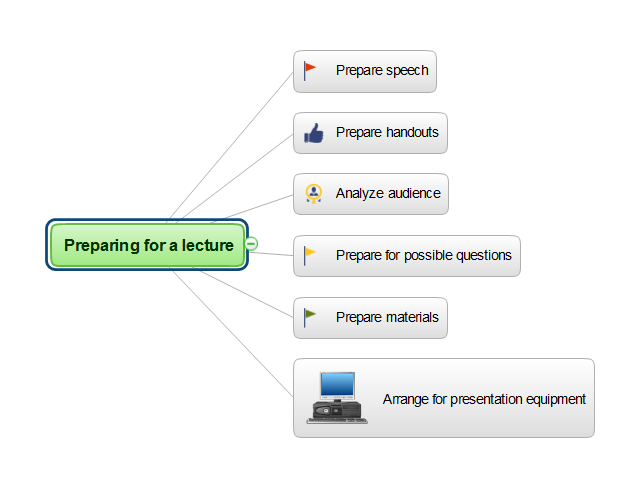
The main task of any teacher, lecturer, professor is how to convey effectively the new information, to present it as simply as possible and to clarify all complex moments for the pupils, students, or other learners. Each of them always strives to make his lecture, lesson or speech interesting for the listeners which are now in auditorium. For successful achievement this task often may be needed not only the correctly chosen words, but also bright and colorful materials used in addition to the narration. The use of mind mapping technology in education and training is incredibly good choice. The Mind Maps are great opportunity to organize and structure the information, to allocate all the most important and to present it on the map in convenient, clear and easy to understand form, that allows you to keep the attention of your audience for a long time. Use professional mind mapping software ConceptDraw MINDMAP and its powerful tools to prepare the Mind Maps for your lectures, to make them colorful and bright, to add special pictures and to make visual accents on important details quick and easy.Best Program to Create a Fowchart
ConceptDraw - feature-rich flowchart software allows you create professional looking flowcharts.Bar Diagram Math
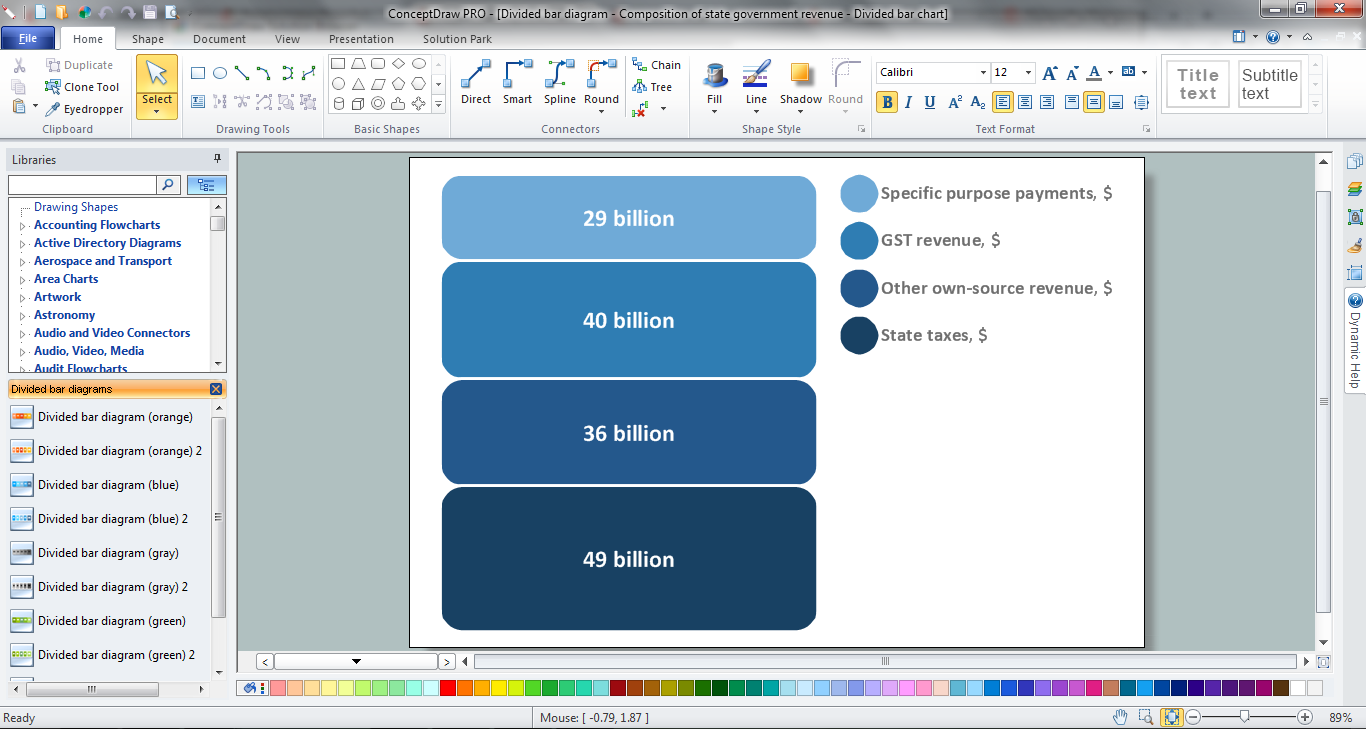
ConceptDraw DIAGRAM extended with Divided Bar Diagrams solution from Graphs and Charts area of ConceptDraw Solution Park is the best software for quick and simple drawing the Divided Bar Diagrams and Bar Diagram Math.Scientific Symbols Chart
ConceptDraw DIAGRAM is the beautiful design software that provides many vector stencils, examples and templates for drawing different types of illustrations and diagrams.Mathematics Solution from the Science and Education area of ConceptDraw Solution Park includes a few shape libraries of plane, solid geometric figures, trigonometrical functions and greek letters to help you create different professional looking mathematic illustrations for science and education.
Draw Fishbone Diagram on MAC Software
The problem solving and decision-making processes are closely linked and crucial for the business and life. There are many tools and techniques for facilitating and improvement these processes, and also enhancement the quality of accepted decisions. One of them is Fisbone Diagram or Cause and Effect diagram. For its construction, you need first define the problem which you need to solve (existing or potential), write it into rectangular and draw to it a horizontal line - a “fish spine”. Then define general types of possible causes like Persons, Materials, Methods, Machinery, Measurements or Environment, and attach them to “spine”. Start brainstorming the possible reasons of failure and connect them to the branches. Professional diagramming ConceptDraw DIAGRAM MAC OSX software offers the Fishbone Diagrams solution which contains templates, samples, and ready Fishbone design objects. Use of them lets effectively identify the possible causes for an effect, realize successfully cause and effect analysis, and instantly draw Fishbone diagram on Mac software.Stacked Graph
ConceptDraw DIAGRAM is a powerful software for drawing professional looking Stacked Graph thanks to the Divided Bar Diagrams solution from the Graphs and Charts area of ConceptDraw Solution Park.Relative Value Chart Software
Relative value is a value measured in the terms of liquidity, risks, return of one investment or financial instrument relative to another. Relative values are widely used in:business, economics, investment, management, marketing, statistics, etc. ConceptDraw DIAGRAM software is the best for drawing professional looking Relative Value Charts. ConceptDraw DIAGRAM provides Divided Bar Diagrams solution from the Graphs and Charts Area of ConceptDraw Solution Park.Flowchart. What is Flowchart
The Flowcharts have one or more starting and ending points. The geometric figures on the Flowcharts represent the steps of the process and are connected with arrows that show the sequence of the actions. The Flowcharts can be orientated vertically or horizontally. ConceptDraw DIAGRAM is a powerful software for creating professional looking Flowcharts quick and easy. For this purpose you can use the Flowcharts solution from the Diagrams area of ConceptDraw Solution Park.Basic Flowchart Symbols and Meaning
Flowcharts are the best for visually representation the business processes and the flow of a custom-order process through various departments within an organization. ConceptDraw DIAGRAM diagramming and vector drawing software extended with Flowcharts solution offers the full set of predesigned basic flowchart symbols which are gathered at two libraries: Flowchart and Flowcharts Rapid Draw. Among them are: process, terminator, decision, data, document, display, manual loop, and many other specific symbols. The meaning for each symbol offered by ConceptDraw gives the presentation about their proposed use in professional Flowcharts for business and technical processes, software algorithms, well-developed structures of web sites, Workflow diagrams, Process flow diagram and correlation in developing on-line instructional projects or business process system. Use of ready flow chart symbols in diagrams is incredibly useful - you need simply drag desired from the libraries to your document and arrange them in required order. There are a few serious alternatives to Visio for Mac, one of them is ConceptDraw DIAGRAM. It is one of the main contender with the most similar features and capabilities.
Scatter Plot Graph
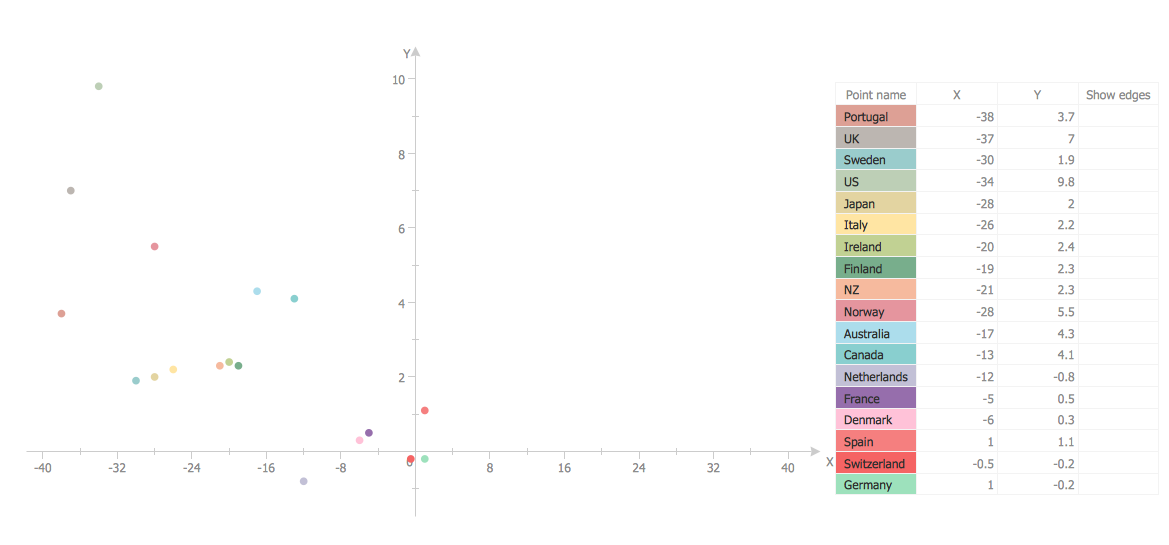
ConceptDraw DIAGRAM extended with Scatter Diagrams solution is the best diagramming and vector drawing software for quick and easy designing the Scatter Plot Graph of any complexity.
 Science and Education Area
The solutions from Science and Education Area of ConceptDraw Solution Park collect templates, samples and libraries of vector stencils for drawing the scientific and educational illustrations, diagrams and mind maps.
TQM Diagram Tool
The Total Quality Management Diagram solution helps you and your organization visualize business and industrial processes. Create Total Quality Management diagrams for business process with ConceptDraw software.Chemistry Symbols and Meanings
Chemistry solution offers 5 libraries with large collection of vector chemistry symbols and meanings, chemistry equation symbols, organic chemistry symbols, and chemical clipart: Chemical Elements Library, Chemical Drawings Library, Conformations Library, Laboratory Equipment Library, Periodic Table of Chemical Elements Library.- Mathematics Symbols | Mathematics | Mathematical Diagrams ...
- Mathematical Diagrams | Bar Diagram Math | Basic Diagramming ...
- Mathematical Diagrams | Mathematics Symbols | Math illustrations ...
- Mathematics | Mathematics Symbols | Mathematical Diagrams ...
- Mathematical Diagrams | Mathematics Symbols | Physics Diagrams ...
- Mathematical Diagrams | Mathematics Symbols | Mathematics ...
- Mathematical Diagrams | How to Draw Geometric Shapes in ...
- Mathematical Diagrams | Mathematics Symbols | Basic Flowchart ...
- Mathematical Diagrams | Mathematics | Mathematics Symbols ...
- Mathematics Symbols | Mathematical Diagrams | How to Draw ...
- Simple & Fast Diagram Software | Mathematical Diagrams | Pyramid ...
- Mathematics Symbols | Mathematical Diagrams | Mathematics ...
- Mathematics Symbols | Mathematical Diagrams | Basic Flowchart ...
- Math illustrations - Template | Basic Diagramming | Mathematical ...
- Mathematical Diagrams | Basic Diagramming | Mathematics ...
- Mathematical Diagrams | Basic Flowchart Symbols and Meaning | 3 ...
- Mathematics Symbols | Mathematical Diagrams | Scientific Symbols ...
- Mathematical Diagrams | Mathematics Symbols | Management Tools ...
- How to Draw Geometric Shapes | Mathematical Diagrams ...


