HelpDesk
How To Create Cause and Effect (Fishbone) Diagram in MS Visio
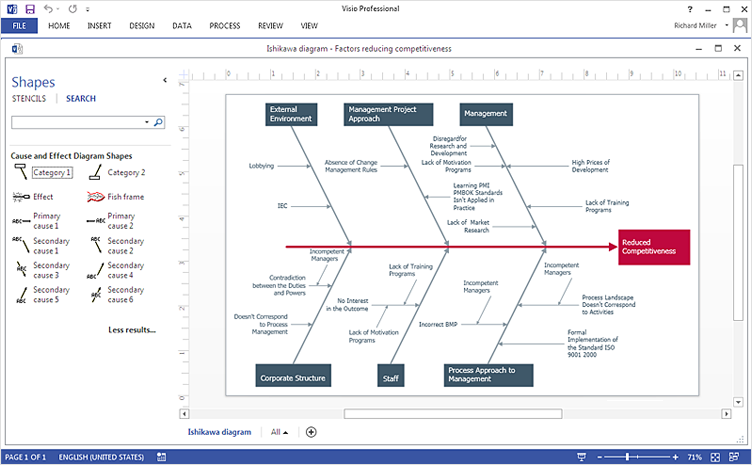
Cause-and-Effect Ishikawa Diagram is a graphical method of analysis and cause-effect relationships, a tool in the form of fish bone. It is used to systematically determine the cause of the problem and represent it graphically. The technique is primarily used in the framework of quality management for the analysis of quality problems and their causes. Nowadays, it has found worldwide distribution and is used in multiple problem areas. It is one of the tools of lean manufacturing, which is used in group work to find the problems and their causes. ConceptDraw DIAGRAM allows you to easily create Fishbone (Ishikawa) diagram and then make a MS Visio VSDX, or VSD files from your diagrams in a couple clicks, using the export capabilities of ConcewptDraw DIAGRAM.In searching of alternative to MS Visio for MAC and PC with ConceptDraw DIAGRAM
Undoubtedly MS Visio is a powerful and multifunctional tool, but however at times occur the instances, when it turns unable of meeting certain users' requirements. At this cases you may need to use an alternative program software, preferably it will be simple, convenient, and at the same time powerful and professional. In searching the alternative to MS Visio for MAC and PC we recommend you to pay attention for ConceptDraw DIAGRAM software, which was developed to satisfy all your drawing needs and requirements. It is a fully-functioned alternative product to MS Visio for both platforms. ConceptDraw DIAGRAM software has many advantages, the main among them are the cross-platform compatibility, a reasonable price, widespread ConceptDraw Solution Park with huge variety of different solutions that offer numerous libraries of specialized vector objects, useful examples, samples, and quick-start templates, extensive import / export capabilities, built-in script language, MS Visio support and certainly free technical support.- How To Create a MS Visio Cause and Effect Diagram Using ...
- How To Draw Fishbone Diagram In Visio
- Timeline Examples | Timeline Diagrams | How to Make a Timeline ...
- How To Create a MS Visio Business Process Diagram Using ...
- Fishbone Diagram | Fishbone Diagrams | How To Create a MS Visio ...
- Business and Finance | How To Create a MS Visio Cause and Effect ...
- How Do Fishbone Diagrams Solve Manufacturing Problems | Bar ...
- Sample Visio Diagrams
- Histogram Chart | Make a Histogram | Histogram | Histogram Visio
- Fishbone Diagram
- Cloud Computing Architecture Diagrams | How to Create an Azure ...
- Timeline Examples | Timeline Diagrams | How to Create a Timeline ...
- Diagram Visio Agile Process
- Ishikawa Diagram Visio
- Process Flowchart | How To Create a MS Visio Flowchart Using ...
- Visio Diagram Templates
- MS Visio Look a Like Diagrams | IDEF0 Visio | ConceptDraw PRO ...
- How To Send Presentation via Skype (Mac OS X) | Draw Fishbone ...
- Flowchart Software | IDEF0 Visio | Seating Chart Template Free ...

