 Composition Dashboard
Composition dashboard solution extends ConceptDraw PRO software with templates, samples and vector stencils library with charts and indicators for drawing visual dashboards showing data composition.
Pie Chart Software
A pie chart is a circular diagram showing a set of data divided into proportional slices. There are several variations of this chart such as donut chart, exploded pie chart, multi-level pie charts. Although it is not very informative when a ring chart or circle chart has many sections, so choosing a low number of data points is quite important for a useful pie chart.ConceptDraw PRO software with Pie Charts solution helps to create pie and donut charts for effective displaying proportions in statistics, business and mass media for composition comparison, i.e. for visualization of part percentage inside one total.
 What is a Dashboard Area
Solutions from the area What is a Dashboard of ConceptDraw Solution Park collects templates, samples and vector stencils libraries with of data driven charts and indicators for drawing the basic types of Visual Dashboards.
 Time Series Dashboard
Time series dashboard solution extends ConceptDraw PRO software with templates, samples and vector stencils libraries with charts, graphs and plots for drawing the visual dashboards showing data time series.
 Divided Bar Diagrams
Divided bar diagrams solution extends ConceptDraw PRO software with templates, samples and library of vector stencils for drawing the divided bar charts.
 What are Infographic Area
Solutions of the area What is Infographics from ConceptDraw Solution Park collect templates, samples and vector stencils libraries with design elements for the drawing information graphics.
 Comparison Dashboard
Comparison dashboard solution extends ConceptDraw PRO software with samples, templates and vector stencils library with charts and indicators for drawing the visual dashboard comparing data.
 PM Presentations
This solution extends ConceptDraw MINDMAP and ConceptDraw PRO software, improving the efficiency of the project management process by using the same source data to build targeted presentations.
"A performance indicator or key performance indicator (KPI) is a type of performance measurement. An organization may use KPIs to evaluate its success, or to evaluate the success of a particular activity in which it is engaged. Sometimes success is defined in terms of making progress toward strategic goals, but often success is simply the repeated, periodic achievement of some level of operational goal (e.g. zero defects, 10/ 10 customer satisfaction, etc.). Accordingly, choosing the right KPIs relies upon a good understanding of what is important to the organization. 'What is important' often depends on the department measuring the performance - e.g. the KPIs useful to finance will be quite different from the KPIs assigned to sales. Since there is a need to understand well what is important (to an organization), various techniques to assess the present state of the business, and its key activities, are associated with the selection of performance indicators. These assessments often lead to the identification of potential improvements, so performance indicators are routinely associated with 'performance improvement' initiatives." [Performance indicator. Wikipedia]
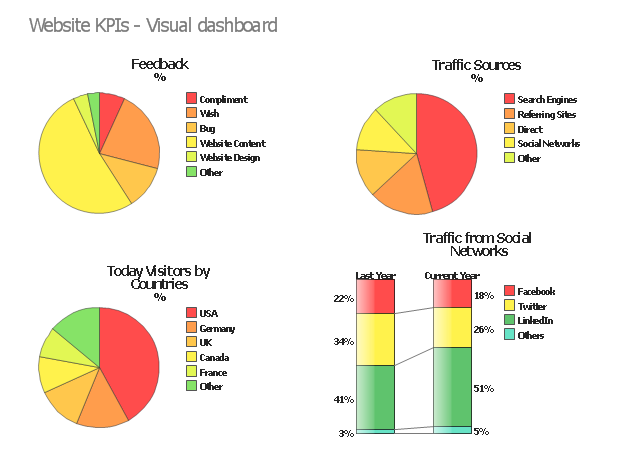
The example "Website KPIs - Visual dashboard" was created using the ConceptDraw PRO diagramming and vector drawing software extended with the Composition Dashboard solution from the area "What is a Dashboard" of ConceptDraw Solution Park.
The example "Website KPIs - Visual dashboard" was created using the ConceptDraw PRO diagramming and vector drawing software extended with the Composition Dashboard solution from the area "What is a Dashboard" of ConceptDraw Solution Park.
- Bar Chart Examples | Column Chart Software | How to Create a Bar ...
- Bar Chart Examples | Bar Chart Software | How to Create a Bar Chart |
- Pie Chart Examples | How to Create a Pie Chart | Pie chart template |
- Pie Chart Examples | Pie Charts | Pie Chart Software |
- Divided bar diagram template
- Types of Flowchart - Overview | Process Flowchart | How to Draw a ...
- Pie Chart Examples | Pie Chart Software | Basic Diagramming |
- Best Diagramming Software for Mac | The Best Drawing Program for ...
- Pie Chart Examples | Pie Chart Software | How to Create a Pie Chart |
- Network organization chart | Network Visualization with ...
- Area chart template | Area chart - San Francisco population history ...
- Composition Dashboard | Chart Examples | Pie Chart Software |
- Accounting Flowcharts | Basic Diagramming | Fishbone Diagram |
- Create Graphs and Charts | The Best Drawing Program for Mac ...
- Feature comparison chart - Digital scouting cameras | Marketing ...
- The Best Drawing Program for Mac | Best Software to Draw ...
- SWOT analysis Software & Template for Macintosh and Windows ...
- Example Process Flow | Accounting Flowcharts | Flowcharts |
- Basic Diagramming | Basic Diagramming | ConceptDraw PRO The ...
- Gantt charts for planning and scheduling projects | Gant Chart in ...

