The vector stencils library "Scrum people" contains 30 icons: scrum master, product owner, development team, etc.
Use this clipart set to design your agile software development diagrams and infographics with ConceptDraw PRO software.
"There are three core roles in the scrum framework. These core roles are those committed to the project in the scrum process — they are the ones producing the product (objective of the project). They represent the scrum team. ...
Product owner
The product owner represents the stakeholders and is the voice of the customer, who is accountable for ensuring that the team delivers value to the business. The product owner writes (or has the team write) customer-centric items (typically user stories), ranks and prioritizes them, and adds them to the product backlog. ...
Development team
The development team is responsible for delivering potentially shippable increments (PSIs) of product at the end of each sprint (the sprint goal). A team is made up of 3–9 individuals who do the actual work (analyse, design, develop, test, technical communication, document, etc.). Development teams are cross-functional, with all of the skills as a team necessary to create a product increment. The development team in scrum is self-organizing...
Scrum master
Scrum is facilitated by a scrum master, who is accountable for removing impediments to the ability of the team to deliver the product goals and deliverables. The scrum master is not a traditional team lead or project manager, but acts as a buffer between the team and any distracting influences. The scrum master ensures that the scrum process is used as intended. The scrum master helps ensure the team follows the agreed scrum processes, often facilitates key sessions, and encourages the team to improve." [Scrum (software development). Wikipedia]
The clip art sample "Design elements - Scrum people" is included in the Scrum solution from the Project Management area of ConceptDraw Solution Park.
Used Solutions
The Best Business Process Modeling Software
ConceptDraw DIAGRAM is a best business processes modeling software for graphical documenting processes of the company. ConceptDraw has 142 vector stencils in the 8 libraries that helps you to start using Diagramming Software for designing own Business Process Diagrams.
The vector stencils library "Project management" contains 30 project management icons.
Use it to design your business and finance illustrations and infographics with ConceptDraw PRO diagramming and vector drawing software.
"Project management is the discipline of initiating, planning, executing, controlling, and closing the work of a team to achieve specific goals and meet specific success criteria. A project is a temporary endeavor designed to produce a unique product, service or result with a defined beginning and end (usually time-constrained, and often constrained by funding or deliverables) undertaken to meet unique goals and objectives, typically to bring about beneficial change or added value." [Project management. Wikipedia]
The icon set example "Design elements - Project management" is included in the Business and Finance solution from Illustration area of ConceptDraw Solution Park.
How To Create Onion Diagram
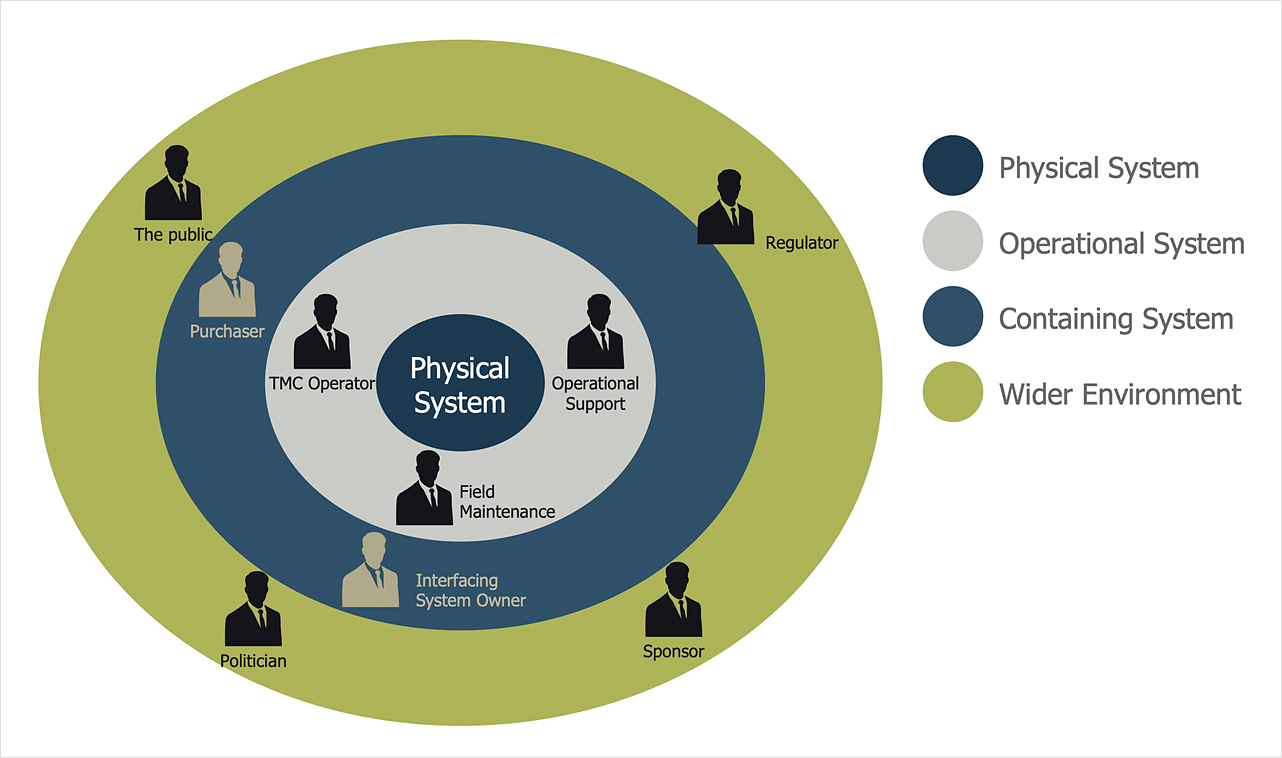
An onion diagram is a kind of chart that shows the dependencies among parts of an organization or process. The chart displays items in concentric circles, where the items in each ring depend on the items in the smaller rings. The Onion Diagram is able to show layers of a complete system in a few circles. But how to create Onion Diagram? Now, it's very easy thanks to the ConceptDraw DIAGRAM diagramming and vector drawing software extended with Stakeholder Onion Diagrams Solution from the Management Area of ConceptDraw Solution Park.The vector stencils library "Workflow management" contains 22 icons.
Use it to design your business process workflow diagrams with ConceptDraw PRO software.
"Management in businesses and organizations is the function that coordinates the efforts of people to accomplish goals and objectives by using available resources efficiently and effectively.
Management includes planning, organizing, staffing, leading or directing, and controlling an organization to accomplish the goal or target. Resourcing encompasses the deployment and manipulation of human resources, financial resources, technological resources, and natural resources." [Management. Wikipedia]
The icons example "Design elements - Workflow management" is included in the Business Process Workflow Diagrams solution from the Business Processes area of ConceptDraw Solution Park.
GUI Interface
What is the ideal GUI interface? The interface of mobile device it's all that users see on it and can interact - screen, bars, icons of applications. So the interface is the first that draws the user's attention. The main goal of software engineers, GUI interface designers, and GUI developers is to make the interface first of all easy for perception and understanding, convenient and attractive for the users. The iPhone's GUI interface meets all these requirements.Stakeholder Mapping Tool
Stakeholders are the groups of people or organizations whose contribution matters to the organization's success, this can be labour participation, financial participation, dissemination of information about organization, etc. So, the employees of the company, its suppliers, customers, media, public organizations, state authorities, all they are stakeholders of the company. ConceptDraw DIAGRAM diagramming and vector drawing software extended with Stakeholder Onion Diagrams Solution from the Management Area of ConceptDraw Solution Park is a powerful stakeholder mapping tool which allows easy create Stakeholder Onion diagrams and maps depicting the layers of a project, relationships of stakeholders to a project goal, and relationships between stakeholders.Stakeholder Onion Diagram Template
For depicting the onion model are actively used Stakeholder Onion Diagrams. The ConceptDraw DIAGRAM diagramming and vector drawing software extended with Stakeholder Onion Diagrams Solution from the Management Area of ConceptDraw Solution Park offers the number of useful tools and Stakeholder Onion Diagram template for their easy design.Football – 2014 FIFA World Cup Standings Group
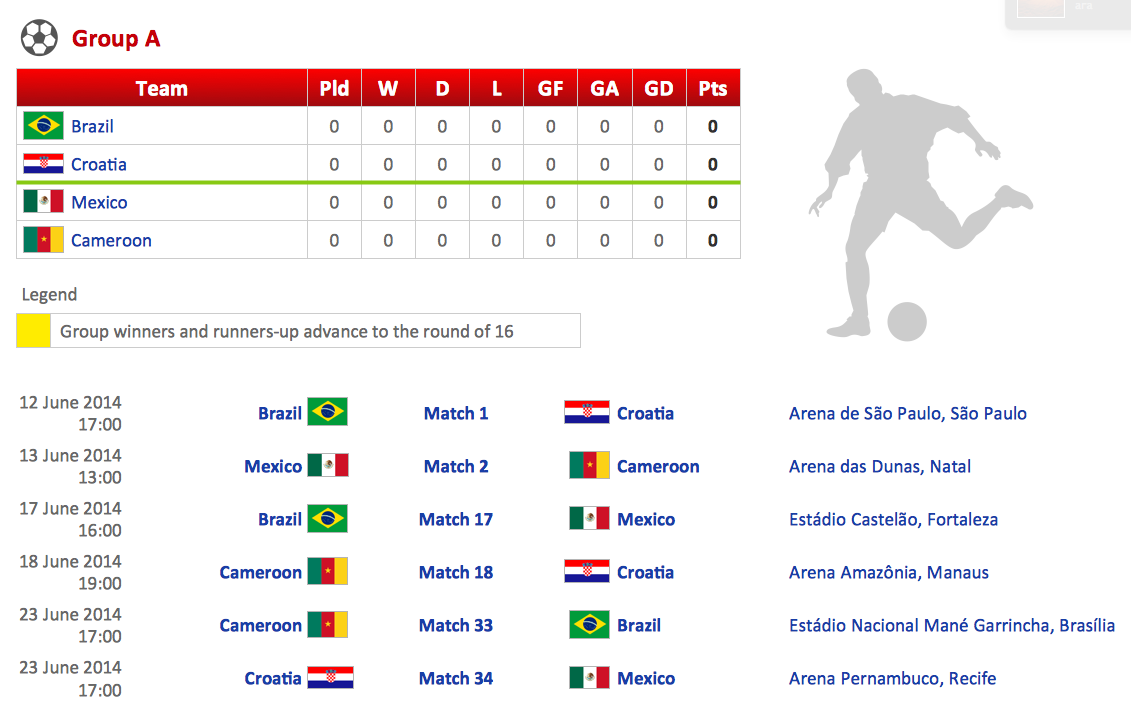
You can see the samples representing the 2014 FIFA World Cup schedules and tournament tables for each of eight groups. These samples was created in ConceptDraw DIAGRAM using the “FIFA World Cup 2014 team flags”, “Soccer pictograms” and “Soccer silhouettes” libraries from the Soccer solution from the Sport area of ConceptDraw Solution Park.Diagramming Software for Design UML Use Case Diagrams
Use Case Diagrams describes the functionality provided by a system in terms of actors, their goals represented as use cases, and any dependencies among those use cases.
The vector stencils library "Management pictograms" contains 72 management pictograms.
Use it to create your management infogram in the ConceptDraw PRO diagramming and vector drawing software.
The flat icons example "Management pictograms - Vector stencils library" is included in the solution "Marketing infographics" from the "Business infographics" area of ConceptDraw Solution Park.
Use it to create your management infogram in the ConceptDraw PRO diagramming and vector drawing software.
The flat icons example "Management pictograms - Vector stencils library" is included in the solution "Marketing infographics" from the "Business infographics" area of ConceptDraw Solution Park.
HelpDesk
How to Create a Stakeholder Onion Diagram
The Stakeholder Onion Diagram is stakeholder analysis tool from the arsenal of project management. It is used to display the relationships of stakeholders to a project goal. An Onion Diagram shows how stakeholder activities affect project results. The ConceptDraw Stakeholder Onion Diagram solution is intended to depict how the relationships that subsist in a project environment can influence on a project. A set of libraries and objects provided by this solution make short work of visualizing the stakeholder analysis of a project.ERD Symbols and Meanings
Entity Relationship Diagram (ERD) is a popular software engineering tool for database modeling and illustration the logical structure of databases, which uses one of two notations - Chen's or Crow’s Foot. Crow's foot notation is effective when used in software engineering, information engineering, structured systems analysis and design. Each of these notations applies its own set of ERD symbols. Crow's foot diagrams use boxes to represent entities and lines between these boxes to show relationships. Varied shapes at the ends of lines depict the cardinality of a given relationship. Chen's ERD notation is more detailed way to represent entities and relationships. ConceptDraw DIAGRAM application enhanced with all-inclusive Entity-Relationship Diagram (ERD) solution allows design professional ER diagrams with Chen's or Crow’s Foot notation on your choice. It contains the full set of ready-to-use standardized ERD symbols and meanings helpful for quickly drawing, collection of predesigned ERD samples, examples and templates. ConceptDraw Pro is a great alternative to Visio for Mac users as it offers more features and can easily handle the most demanding professional needs.
The vector stencils library "HR symbols" contains 45 HR pictograms.
Use this icon set with HR symbols to draw your HR flowcharts, workflow diagrams, process charts and infographics with the ConceptDraw PRO diagramming and vector drawing software.
The HR pictograms library "HR symbols" is included in the HR Flowcharts solution from the Management area of ConceptDraw Solution Park.
Process Flowchart Symbols
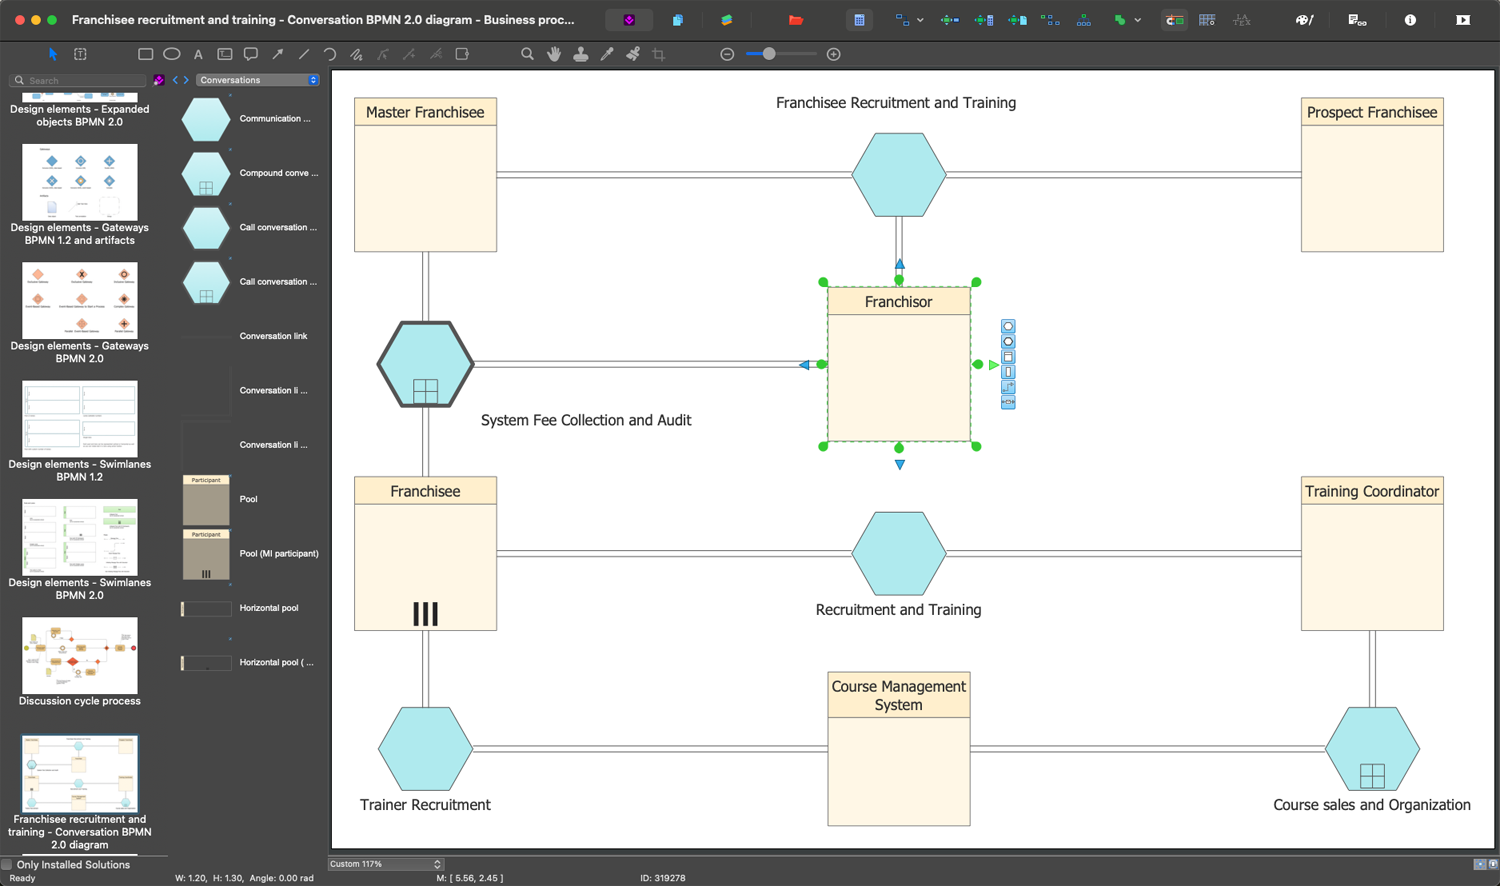
The Process Flowchart or Process Flowchart Diagram (PFD) is a visual representation relations between major parts of the system, the steps in a process, and even connections between various systems. The possibility to easy create professional-looking and attractive Process Flowcharts, Business Process Diagrams and Maps which visualize the steps of complex processes is provided by Business Process Diagram Solution from the Business Processes Area of ConceptDraw Solution Park and 16 libraries with 230 process flowchart symbols from BPMN 1.2 and BPMN 2.0.- Football Goal Icon Png
- Design elements - Stakeholder icons | Stakeholder Mapping Tool ...
- Cloud Computing Architecture Diagrams | Design elements - Cloud ...
- Management pictograms - Vector stencils library | Mission Flat Icon
- SWOT analysis for a small independent bookstore | Smo Icon
- Iphone Ios 9 Icon Pic
- Graphical User Interface | GUI Interface | UI Patterns | Ios 9 Icon ...
- GUI Interface | Graphical User Interface | UI Patterns | All Icon For Ios 9
- Icon Ios 9 Senttings Png
- Graphical User Interface | GUI Interface | UI Patterns | Iphone 9 Icon
- Goal Png
- App icons - Vector stencils library | Entity-Relationship Diagram ...
- Diagramming software for Amazon Web Service icon set: Storage ...
- App icons - Vector stencils library | What Is User Interface? | GUI ...
- GUI Interface | UI Patterns | Graphical User Interface | Ios 9 All Icon ...
- Iphone 6 Icon Images
- App icons - Vector stencils library | Android GUI | GUI Interface | Ios ...
- Graphical User Interface | App icons - Vector stencils library | GUI ...
- AWS Simple Icons for Architecture Diagrams | Flowchart design ...
- iPhone User Interface | Design elements - Apps icons | UI Patterns ...
