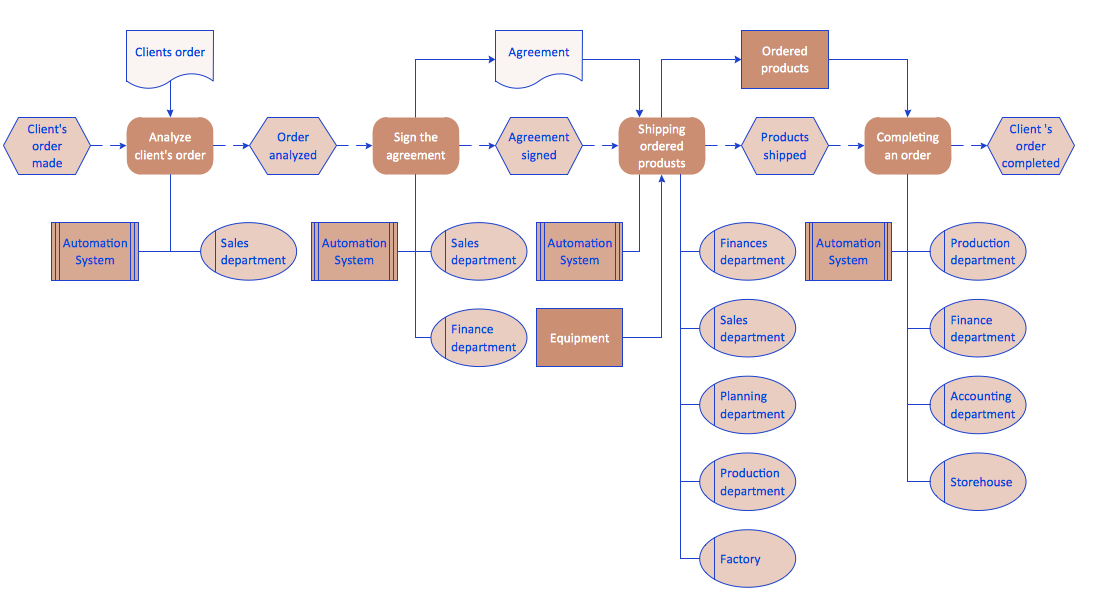
EPC Diagrams Illustrate Business Process Work Flows
The Event-driven Process Chain ( EPC ) Diagrams allows users present business process models in terms of work flows. The EPC diagram can show various ways for improvement throughout an organisation.Diagram to illustrate concept of PageRank. Suppose each circle is a website, and an arrow is a link from one website to another, such that a user can click on a link within, say, website F to go to website B, but not vice versa. Google crawlers examine which websites link to each other and assume that websites with more incoming links are what users want.
"PageRank is an algorithm used by Google Search to rank websites in their search engine results. PageRank was named after Larry Page, one of the founders of Google. PageRank is a way of measuring the importance of website pages. ...
It is not the only algorithm used by Google to order search engine results, but it is the first algorithm that was used by the company, and it is the best-known. Google uses an automated web spider called Googlebot to actually count links and gather other information on web pages." [PageRank. Wikipedia]
This bubble diagram example was redesigned from the Wikimedia Commons file: Websites interlinking to illustrate PageRank.png.
[commons.wikimedia.org/ wiki/ File:Websites_ interlinking_ to_ illustrate_ PageRank.png]
This file is made available under the Creative Commons CC0 1.0 Universal Public Domain Dedication. [creativecommons.org/ publicdomain/ zero/ 1.0/ deed.en]
The bubble diagram example "Websites interlinking to illustrate PageRank" was created using the ConceptDraw PRO diagramming and vector drawing software extended with the Bubble Diagrams solution from the area "What is a Diagram" of ConceptDraw Solution Park.
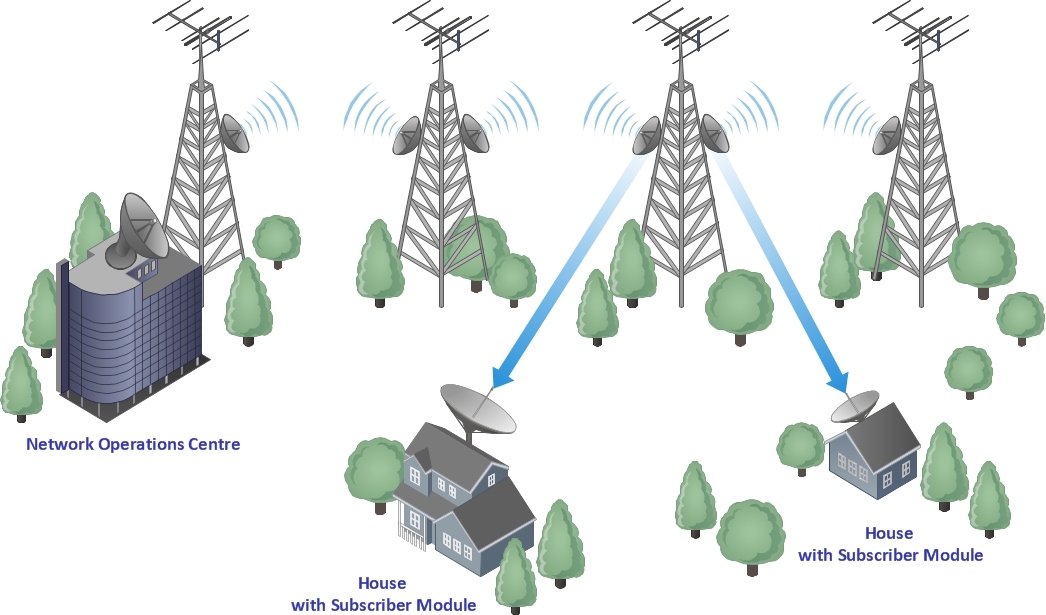
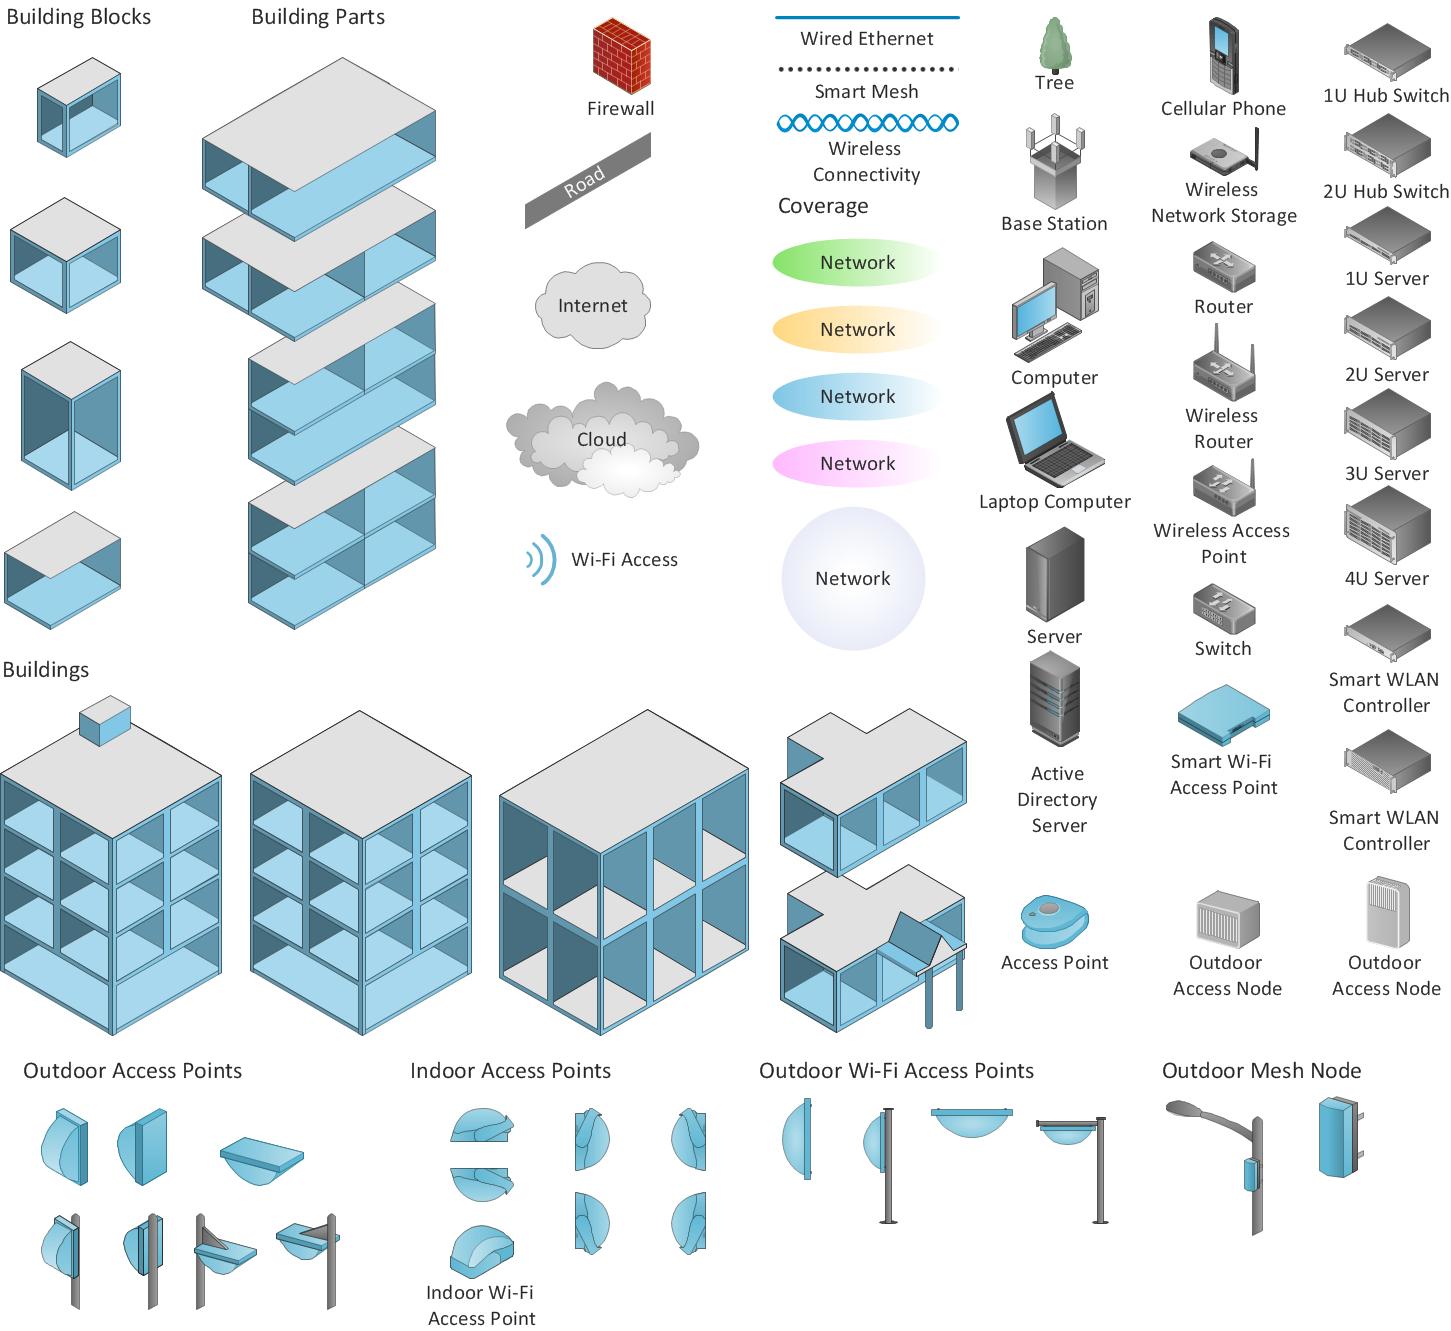
Illustrate the Computer Network of a Building
With best content of the Wireless Network solution that includes more than 10 building pre-designed objects network engineers can illustrate the computer network of a building.Venn Diagram Examples
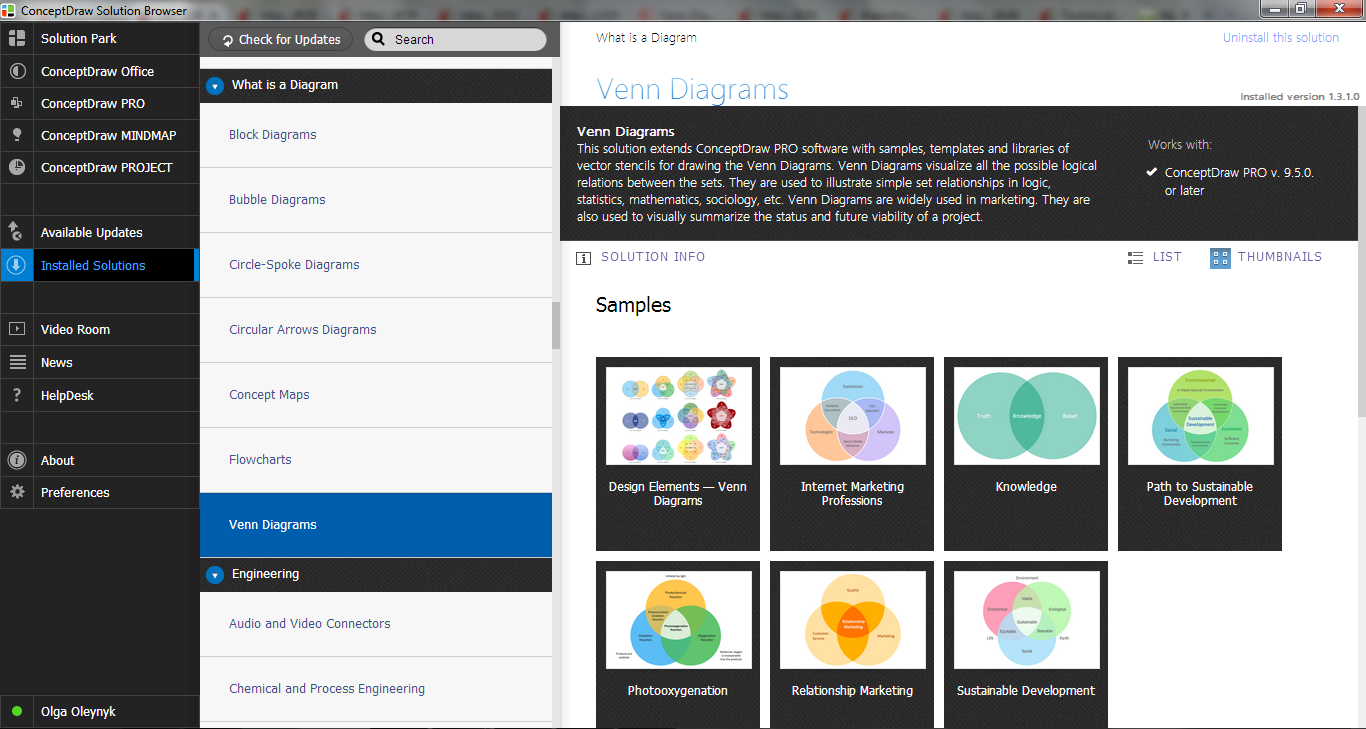
ConceptDraw PRO diagramming and vector drawing software extended with Venn Diagrams solution from "What is a Diagram" area offers a wide set of professionally designed Venn Diagram examples which can become the good start and beautiful source of inspiration for your own Venn Diagrams.Venn Diagram Examples for Problem Solving. Venn Diagram as a Truth Table
Venn diagrams are illustrations used in the branch of mathematics known as set theory. They show the mathematical or logical relationship between different groups of things (sets). A Venn diagram shows all the possible logical relations between the sets.Venn Diagram Template
It's impossible to overestimate the usefulness and convenience of using the ready templates when you create your own diagrams and charts. And Venn Diagrams are not exception. ConceptDraw PRO diagramming and vector drawing software presents the Venn Diagrams solution from "What is a Diagram" area which offers a set of Venn Diagram templates and samples. Use the suitable Venn Diagram Template to create your own Venn Diagram of any complexity.Venn Diagram
Venn diagrams are illustrations used in the branch of mathematics known as set theory. They show the mathematical or logical relationship between different groups of things (sets). A Venn diagram shows all the possible logical relations between the sets.ConceptDraw Pro is an Advanced tool for Professional Network Diagrams Creation
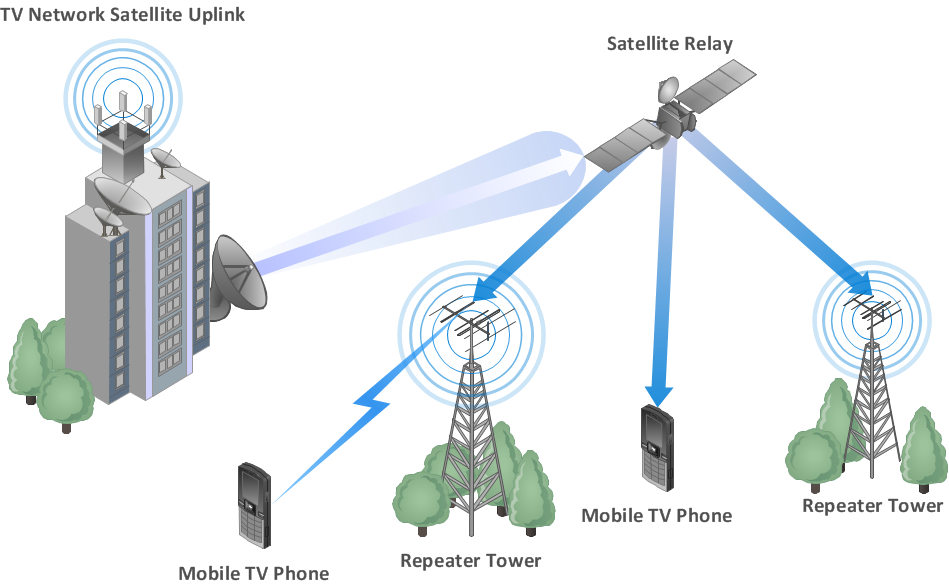
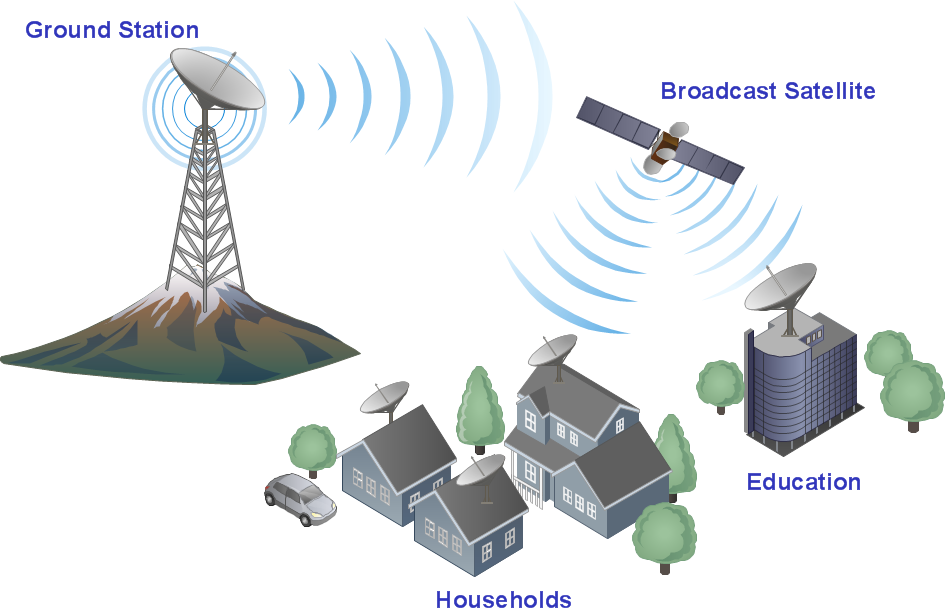
Wireless Network solution contains template, library and a set of design elements that help network engineers visualize Wireless Network. Network engineers and designers use this solution to design, create and illustrate the wireless networks.Venn Diagram Maker
ConceptDraw PRO diagramming and vector drawing software extended with Venn Diagrams solution from the "What is a Diagram" area of ConceptDraw Solution Park is a powerful Venn Diagram maker. Create fast and easy your own Venn Diagrams to visualize: all the possible logical relations between sets, simple set relationships in logic, statistics, mathematics, sociology, marketing, summarize the status and future viability of a project.Cylinder Venn Diagram
You need design Cylinder Venn Diagram? Nothing could be easier with ConceptDraw PRO diagramming and vector drawing software extended with Venn Diagrams Solution from the “What is a Diagram” Area. ConceptDraw PRO allows you to design various Venn Diagrams including Cylinder Venn Diagrams.Wireless Network WAN
Wireless Networks solution from ConceptDraw Solution Park extends ConceptDraw PRO diagramming and vector drawing software to help network engineers and designers efficiently design, create and illustrate WAN network diagram of any complexity. The ConceptDraw PRO software helps users to quickly transit from an idea to the implementation of a Wireless Network WANWireless Networking for Mac
ConceptDraw PRO is a Wireless Network Drawing Mac OS software.Venn Diagram Template for Word
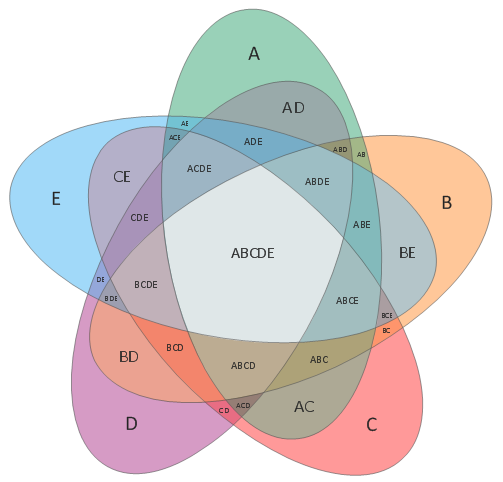
This template shows the Venn Diagram. It was created in ConceptDraw PRO diagramming and vector drawing software using the ready-to-use objects from the Venn Diagrams Solution from the "What is a Diagram" area of ConceptDraw Solution Park.Venn Diagrams
Venn Diagrams are the intuitive way to work with sets which allows to visualize all possible logical relations between several sets. They are widely used in mathematics, marketing, logic, statistics, sociology, etc.ConceptDraw PRO diagramming and vector drawing software extended with Venn Diagrams solution from "What is a Diagram" area offers set of useful drawing tools for easy creating the Venn Diagrams for any quantity of sets.
Venn Diagram Examples for Problem Solving. Computer Science. Chomsky Hierarchy
A Venn diagram, sometimes referred to as a set diagram, is a diagramming style used to show all the possible logical relations between a finite amount of sets. In mathematical terms, a set is a collection of distinct objects gathered together into a group, which can then itself be termed as a single object. Venn diagrams represent these objects on a page as circles or ellipses, and their placement in relation to each other describes the relationships between them.The Venn diagram example below visualizes the the class of language inclusions described by the Chomsky hierarchy.
- Draw A Diagram To Illustrate Glycolysis
- Marketing | ConceptDraw Solution Park | Venn Diagrams | Illustrate ...
- Wireless broadband network diagram | Illustrate the Computer ...
- EPC Diagrams Illustrate Business Process Work Flows | EPC ...
- Workflow diagram - Weather forecast | How can you illustrate the ...
- Illustrate the Computer Network of a Building | Network Diagram ...
- 4 Level pyramid model diagram - Information systems types | 5 Level ...
- How to Draw a Computer Network Diagrams | Illustrate the ...
- Types of Flowcharts | Describe And Illustrate A Schematic Diagram ...
- McKinsey 7S framework - Bubble diagram | Websites interlinking to ...
- With The Help Of Diagram Illustrate Any Bus Structures
- Wireless Network WAN | Illustrate the Computer Network of a ...
- Process Flowchart | With Aid Of Diagram Illustrate The Stages Of ...
- Process Flowchart | Pyramid Diagram | Business and Finance ...
- Illustrate The Wireless Communication Network With Diagram
- | How can you illustrate the weather condition | | Weather Conditions ...
- How to Draw a Computer Network Diagrams | Illustrate the ...
- How can you illustrate the weather condition | Affinity diagram ...
- Innovation life cycle - Arrow loop diagram | Illustrate In A Circle ...
