This site uses cookies. By continuing to browse the ConceptDraw site you are agreeing to our Use of Site Cookies.

3 Circle Venn. Venn Diagram Example

This example shows the 3 Circle Venn Diagram. The Venn Diagrams visualize all possible logical intersections between several sets. On this example you can see the intersections of 3 sets. Venn Diagrams are widely used in mathematics, logic, statistics, marketing, sociology, etc.

Venn Diagram

Venn diagrams are illustrations used in the branch of mathematics known as set theory. They show the mathematical or logical relationship between different groups of things (sets). A Venn diagram shows all the possible logical relations between the sets.

Venn Diagram Template

It's impossible to overestimate the usefulness and convenience of using the ready templates when you create your own diagrams and charts. And Venn Diagrams are not exception. ConceptDraw PRO diagramming and vector drawing software presents the Venn Diagrams solution from "Diagrams" area which offers a set of Venn Diagram templates and samples. Use the suitable Venn Diagram Template to create your own Venn Diagram of any complexity.

Venn Diagram Examples for Problem Solving. Venn Diagram as a Truth Table

Venn diagrams are illustrations used in the branch of mathematics known as set theory. They show the mathematical or logical relationship between different groups of things (sets). A Venn diagram shows all the possible logical relations between the sets.
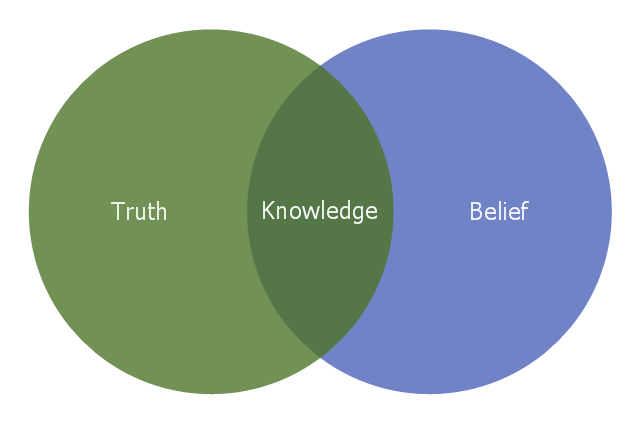
This Venn diagram sample illustrates the Plato's definition of knowledge. It was designed on the base of the Wikimedia Commons file: Belief Venn diagram.svg. [commons.wikimedia.org/ wiki/ File:Belief_ Venn_ diagram.svg]
"Justified true belief is a definition of knowledge that is most frequently credited to Plato and his dialogues. The concept of justified true belief states that in order to know that a given proposition is true, one must not only believe the relevant true proposition, but one must also have justification for doing so. In more formal terms, a subject S knows that a proposition P is true if and only if:
(1) P is true,
(2) S believes that P is true, and
(3) S is justified in believing that P is true" [Justified true belief. Wikipedia]
The Venn diagram example "Knowledge" was created using the ConceptDraw PRO diagramming and vector drawing software extended with the Venn Diagrams solution from the area "What is a Diagram" of ConceptDraw Solution Park.
Venn diagram
Venn diagram, Venn diagram,

Venn Diagram Examples for Problem Solving. Computer Science. Chomsky Hierarchy

A Venn diagram, sometimes referred to as a set diagram, is a diagramming style used to show all the possible logical relations between a finite amount of sets. In mathematical terms, a set is a collection of distinct objects gathered together into a group, which can then itself be termed as a single object. Venn diagrams represent these objects on a page as circles or ellipses, and their placement in relation to each other describes the relationships between them.
The Venn diagram example below visualizes the the class of language inclusions described by the Chomsky hierarchy.

Venn Diagram Examples

ConceptDraw PRO diagramming and vector drawing software extended with Venn Diagrams solution from "Diagrams" area offers a wide set of professionally designed Venn Diagram examples which can become the good start and beautiful source of inspiration for your own Venn Diagrams.

Multi Layer Venn Diagram. Venn Diagram Example

To visualize the relationships between subsets of the universal set you can use Venn diagrams. To construct one, you should divide the plane into a number of cells using n figures. Each figure in the chart represents a single set of, and n is the number of represented sets. Splitting is done in a way that there is one and only one cell for any set of these figures, the points of which belong to all the figures from the set and do not belong to others. The plane on which the figures are represented, is the universal set U. Thus, the point which does not belong to any of the figures, belongs only to U.

Examples of Flowcharts, Org Charts and More

ConceptDraw examples covers a broad spectrum of business graphics categories. We separated all the graphic documents on application areas and had produced multiple solutions for each of them. ConceptDraw provides a wide variety of examples such as flowcharts, organizational charts, business charts, UML diagrams, database and ERD, directional map, network diagrams and lots more. Each solution accommodates 10+ examples that shows specific application cases of a diagram. ConceptDraw STORE is an application for downloading solutions with examples, templates and stencil libraries. Please choose any examples you are interested in, alternatively download them for free; you will need to install ConceptDraw to view them. As you will see, ConceptDraw is very powerful, you can use more than 10000 symbols, examples, and many pre-drawn templates, to create your own spectacular flowcharts, business diagrams, network diagrams and lots more, effortlessly, and in no time at all.
What is ConceptDraw OFFICE

2 Circle Venn Diagram. Venn Diagram Example

Using the ready-to-use predesigned objects, samples and templates from the Venn Diagrams Solution for ConceptDraw PRO you can create your own professional looking Venn Diagrams quick and easy.

Process Flowchart

ConceptDraw is Professional business process mapping software for making process flow diagram, workflow diagram, general flowcharts and technical illustrations for business documents. It is includes rich examples, templates, process flowchart symbols. ConceptDraw flowchart maker allows you to easier create a process flowchart. Use a variety of drawing tools, smart connectors, flowchart symbols and shape libraries to create flowcharts of complex processes, process flow diagrams, procedures and information exchange.
How To Create a Process Flow Chart (business process modelling techniques)

Interactive Venn Diagram

Venn Diagrams Solution offers you the Venn Diagrams library of ready-to-use vector objects and large collection of templates and samples allowing you create your own Interactive Venn Diagram in minutes.
Venn Diagrams designed in ConceptDraw PRO are visual, bright, colorful, so they can be successfully used in different reports, appearances on the conferences, meetings.

Example of Flowchart Diagram

ConceptDraw - feature-rich flowchart software. This software includes flowchart diagram examples set. Libraries contain vector stencils that allow users to use RapidDraw technology. Users can start draw their own flowchart diagrams from existing examples by clicking on direction arrows.

Basic Audit Flowchart. Flowchart Examples

This sample shows the Audit Process Flowchart. It was created in ConceptDraw PRO diagramming and vector drawing software using the Flowcharts solution from the Diagrams area of ConceptDraw Solution Park.
The Audit Flowcharts are widely used in the financial management, accounting, money management and in many others fields.

3 Circle Venn Diagram. Venn Diagram Example

This template shows the Venn Diagram. It was created in ConceptDraw PRO diagramming and vector drawing software using the ready-to-use objects from the Venn Diagrams Solution from the "Diagrams" area of ConceptDraw Solution Park.
Venn Diagrams visualize all possible logical intersections between several sets and are widely used in mathematics, logic, statistics, marketing, sociology, etc.