Circular Flow Diagram Template
You need to draw the Circular Arrows Diagram, Segmented Diagram or Circular Flow Diagram? Any of these diagrams can be fast and easy designed in ConceptDraw PRO.ConceptDraw PRO diagramming and vector drawing software offers the Circular Arrows Diagrams Solution from the "What is a Diagram" Area with extensive drawing tools, predesigned samples and circular flow diagram template. Use of ready template is the easiest way of drawing.Circular Arrow
ConceptDraw PRO diagramming and vector drawing software extended with Circular Arrows Diagrams solution from the "What is a Diagram" Area is a powerful software that will help you design professional looking Circular Arrow Diagrams.Circular Arrows
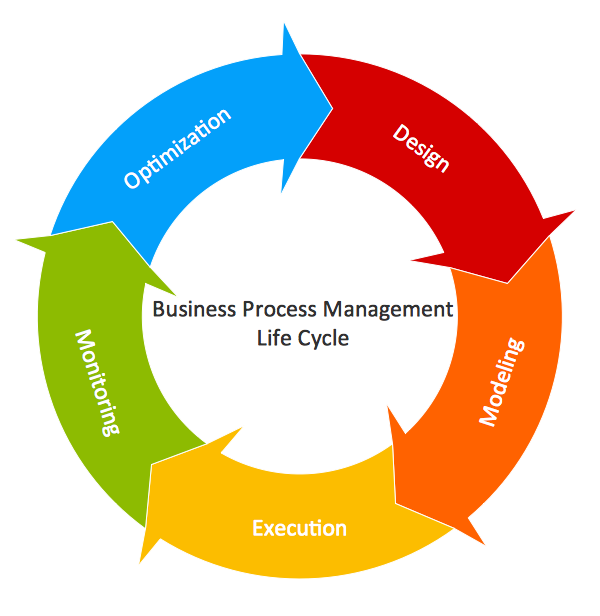
The Circular Arrows Diagrams are very popular in management and marketing. They are the useful way to visualize a sequence of steps, tasks, or events as a circular flow. But how design the Circular Arrows Diagram quick and easy? You will need a powerful software. ConceptDraw PRO diagramming and vector drawing software is exactly what you need. Extended with Circular Arrows Diagrams solution from the "What is a Diagram" Area, ConceptDraw PRO is the best for drawing the Circular Arrows Diagrams.
 Target and Circular Diagrams
This solution extends ConceptDraw PRO software with samples, templates and library of design elements for drawing the Target and Circular Diagrams.
Circular Diagram
Circular Diagram is a type of diagram widely used in marketing and economics for visualization information in a clear and visual form. ConceptDraw PRO diagramming and vector drawing software offers the useful tools of the Target and Circular Diagrams solution from the Marketing area of ConceptDraw Solution Park for effective drawing a Circular Diagram of any complexity and design.Concept Maps
As concept map consists from conception-blocks and links between them, you can use ConceptDraw library objects and add to a document as much objects as you need. ConceptDraw tools let you to edit, group, move objects, change their appearance and add text signs and raster or vector pictures. ConceptDraw PRO diagramming and vector drawing software extended with Concept Maps Solution from the "What is a Diagram" Area is effective tool for creating professional looking Concept Maps.Relative Value Chart Software
Relative value is a value measured in the terms of liquidity, risks, return of one investment or financial instrument relative to another. Relative values are widely used in:business, economics, investment, management, marketing, statistics, etc. ConceptDraw PRO software is the best for drawing professional looking Relative Value Charts. ConceptDraw PRO provides Divided Bar Diagrams solution from the Graphs and Charts Area of ConceptDraw Solution Park.- How can you illustrate the weather condition | Affinity diagram ...
- Drawing Illustration | Drawing a Nature Scene | Water cycle ...
- Business Cycle Diagram
- Water cycle diagram | Drawing Illustration | Drawing a Nature ...
- Flow Chart Creator | Process Flowchart | BPR Diagram. Business ...
- Purchasing Cycle Duagram
- Water cycle diagram | Strategic planning - Cycle diagram ...
- Business Cycle Example
- Example Of A Business Cycle
- Water cycle diagram | Innovation life cycle - Arrow loop diagram ...
- Workflow diagram - Weather forecast | How can you illustrate the ...
- Water cycle diagram | Active indirect water heater diagram | Piping ...
- Cycle Chart Maker
- Affinity diagram - Business expansion | Affinity Diagram | Seven ...
- Content marketing cycle - Ring chart | Sales Process Flowchart ...
- Process Flowchart | Life cycle analysis - Ring chart | Pyramid Chart ...
- Examples Of Cycle Charts
- Biology Symbols | Biology Illustration | Chemical Engineering ...
- Production Cycle Flowchart Manufacturing Business
- What is the Accounting Cycle ? | Steps of Accounting Cycle | Biology ...


