LLNL Flow Charts
These flow charts help scientists analysts and other decision makers to visualize the complex interrelationships involved in managing our nation x2019.Chemical Engineering
ConceptDraw PRO is a powerful diagramming and vector drawing software. Extended with Chemical and Process Engineering Solution from the Engineering Area of ConceptDraw Solution Park, it became the best Chemical Engineering software.Pyramid Charts
ConceptDraw PRO extended with Pyramid Diagrams Solution from the Marketing Area of ConceptDraw Solution Park is a powerful Pyramid Charts making software. A Pyramid Chart has the form of triangle and hierarchically structures, organizes and help to analyze the information, data or ideas. Triangle is divided on the sections that usually have different widths. The width indicates the level of hierarchy among the topics.
 Picture Graphs
Typically, a Picture Graph has very broad usage. They many times used successfully in marketing, management, and manufacturing. The Picture Graphs Solution extends the capabilities of ConceptDraw PRO v10 with templates, samples, and a library of professionally developed vector stencils for designing Picture Graphs.
Chart Examples
Easy charting software comes with beautiful chart templates and examples. This makes it easy to create professional charts without prior experience.
 Manufacturing and Maintenance
Manufacturing and maintenance solution extends ConceptDraw PRO software with illustration samples, templates and vector stencils libraries with clip art of packaging systems, industrial vehicles, tools, resources and energy.
Line Graph Charting Software
To design line and scatter charts use ConceptDraw PRO diagramming and vector drawing software extended with Line Graphs solution from Graphs and Charts area of ConceptDraw PRO Solution Park. (Line chart, scatter chart, 2d chart).Chemistry Drawings
ConceptDraw PRO diagramming and vector drawing software extended with Chemistry solution from the Science and Education area is a powerful chemistry drawing software that is ideal for quick and easy designing of various: chemistry drawings, scientific and educational chemistry illustrations, schemes and diagrams of chemical and biological lab set-ups, images with chemical formulas, molecular structures, chemical reaction schemes, schemes of labware, that can be then successfully used in the field of science and education, on various conferences, and so on.How to Create a Scatter Chart
Simple tutorial help you learn how to draw a scatter chart and increase you possibilities of understanding and work more effective with our scatter chart software.Building Drawing Software for Design Registers, Drills and Diffusers
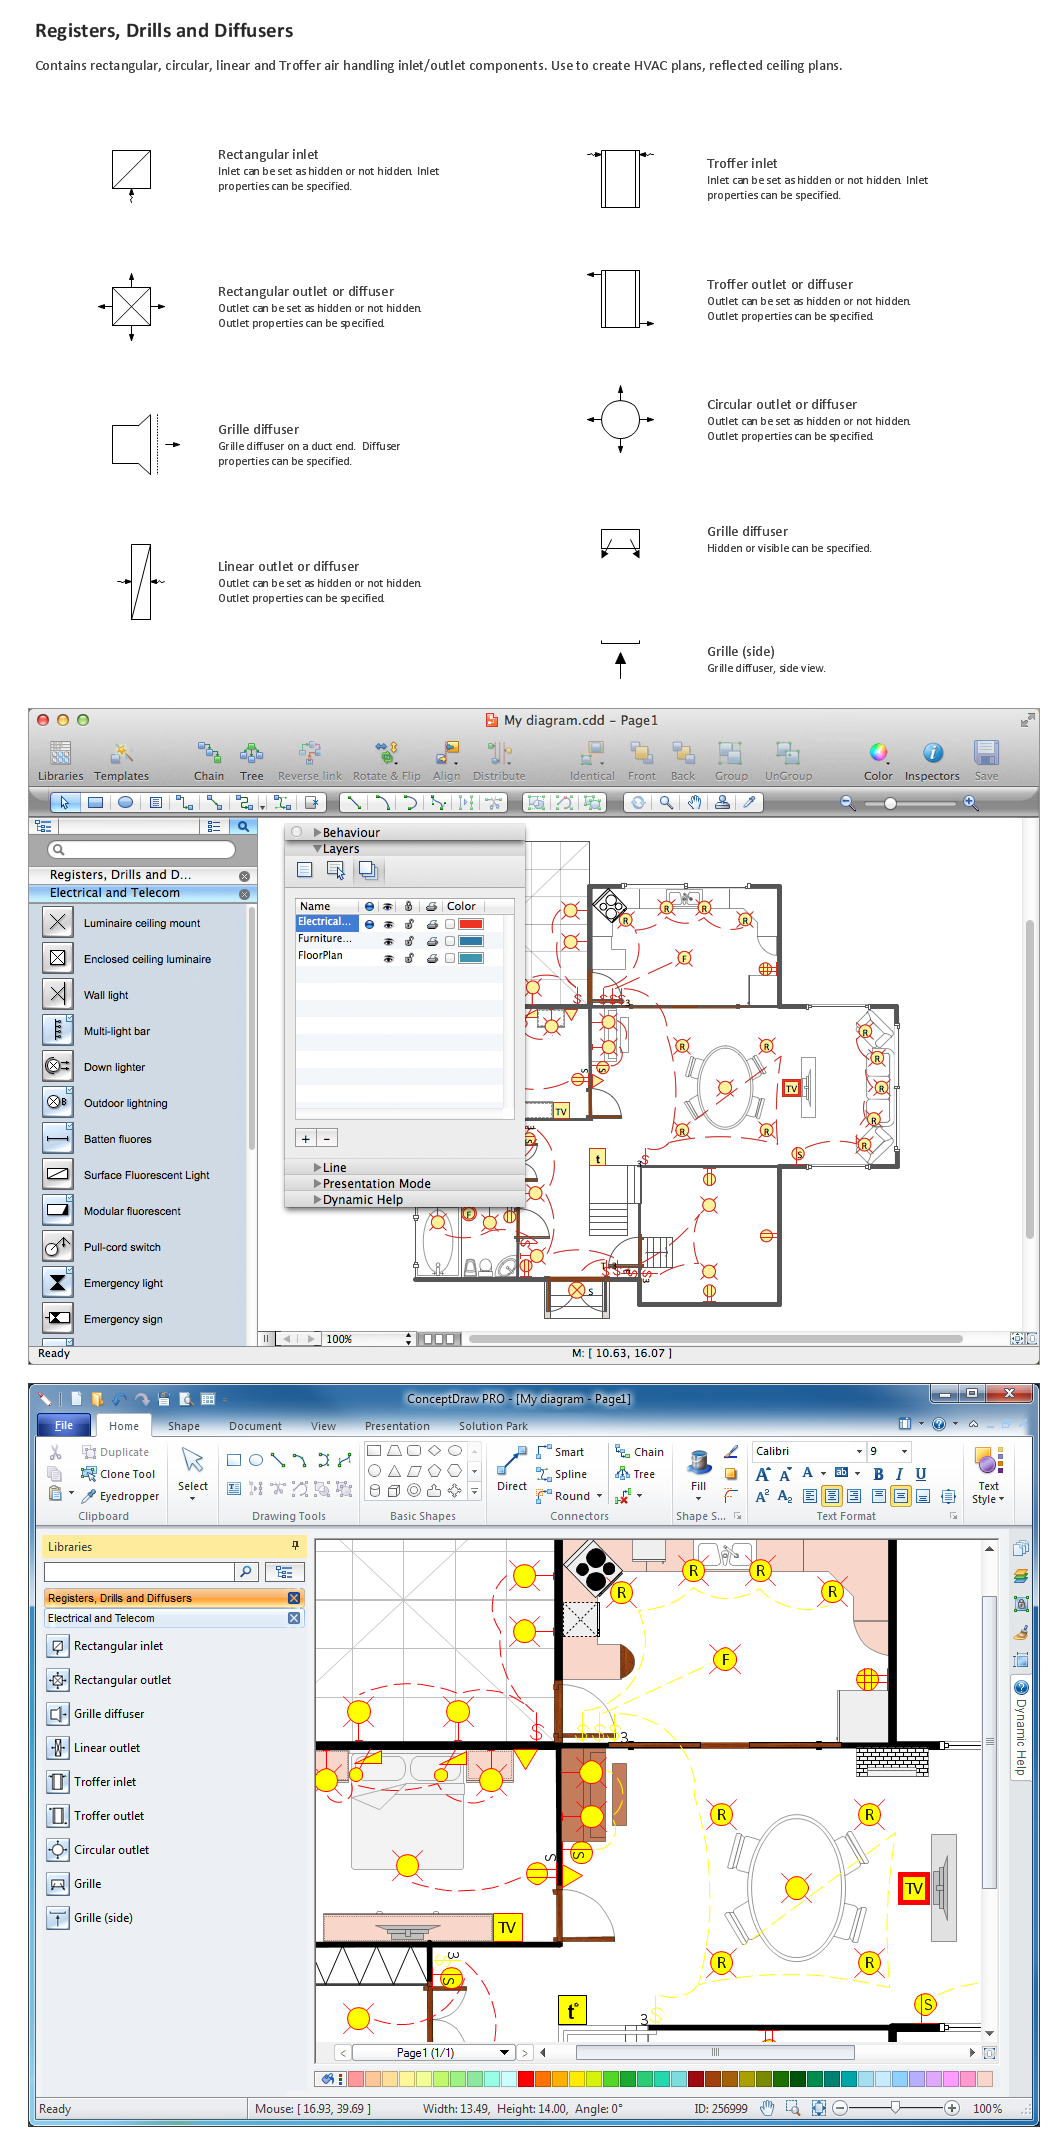
Use the appropriate stencils from Registers, Drills and Diffusers library for create building plans.
 Pie Charts
Pie Charts are extensively used in statistics and business for explaining data and work results, in mass media for comparison (i.e. to visualize the percentage for the parts of one total), and in many other fields. The Pie Charts solution for ConceptDraw PRO v10 offers powerful drawing tools, varied templates, samples, and a library of vector stencils for simple construction and design of Pie Charts, Donut Chart, and Pie Graph Worksheets.
 Biology
Biology solution extends ConceptDraw PRO software with samples, templates and libraries containing biological vector symbols, to help you create scientific and educational designs in the field of biology.
Chart Templates
Easy charting software comes with beautiful chart templates and examples. This makes it easy to create professional charts without prior experience.- Transformation Of Energy Flow Chart With Images
- US Energy Flow Chart
- LLNL Flow Charts | Manufacturing and Maintenance | Citric acid ...
- Images For Flow Charts
- Flow Chart On Source Of Energy
- Process Flowchart | Basic Flowchart Symbols and Meaning | Basic ...
- Biology | Biology Drawing Software | Biology Drawing | Diagram To ...
- Energy Pyramid Diagram | Resources and energy - Vector stencils ...
- Basic Flowchart Images . Flowchart Examples | Manufacturing and ...
- Resources and energy - Vector stencils library | Energy resources ...
- Resources and energy - Vector stencils library | Energy resources ...
- PROBLEM ANALYSIS. Root Cause Analysis Tree Diagram | Coad ...
- Energy Pyramid Diagram | Fast food restaurant menu prices ...
- Energy resources diagram | Resources and energy - Vector stencils ...
- Market Picture Diagram And Graph
- Methabolic Chart
- Natural gas condensate - PFD | Resources and energy - Vector ...
- FTA diagram - Hazard analysis | Resources and energy - Vector ...
- Energy resources diagram | LLNL Flow Charts | Energy Pyramid ...
- Process Flowchart | How to Draw a Chemical Process Flow Diagram ...
.jpg)


