Basic Flowchart Symbols and Meaning
Flowcharts are the best for visually representation the business processes and the flow of a custom-order process through various departments within an organization. ConceptDraw PRO diagramming and vector drawing software extended with Flowcharts solution offers the full set of predesigned basic flowchart symbols which are gathered at two libraries: Flowchart and Flowcharts Rapid Draw. Among them are: process, terminator, decision, data, document, display, manual loop, and many other specific symbols. The meaning for each symbol offered by ConceptDraw gives the presentation about their proposed use in professional Flowcharts for business and technical processes, software algorithms, well-developed structures of web sites, Workflow diagrams, Process flow diagram and correlation in developing on-line instructional projects or business process system. Use of ready flow chart symbols in diagrams is incredibly useful - you need simply drag desired from the libraries to your document and arrange them in required order. There are a few serious alternatives to Visio for Mac, one of them is ConceptDraw PRO. It is one of the main contender with the most similar features and capabilities.
Dashboard
ConceptDraw PRO extended with Sales Dashboard solution from the Marketing area of ConceptDraw Solution Park is a perfect software for creating the live dashboard for the business data and progress visualization.Graphical User Interface
ConceptDraw PRO provides iPhone User Interface Solution from the Software Development Area of ConceptDraw Solution Park for quick and easy drawing professional looking graphical user interfaces. Even if you are not an artist, you will be able easily draw any iPhone graphical user interface using the ready-to-use predesigned vector objects from the offered libraries of iPhone User Interface Solution for ConceptDraw Solution Park.
 Graphic User Interface
Graphic User Interface solution extends ConceptDraw PRO software with templates, samples and libraries of vector stencils for design of the GUI prototypes and diagrams for Windows, Mac OS and iOS software.
PROBLEM ANALYSIS. Root Cause Analysis Tree Diagram
Root Cause Analysis Tree Diagram. Use the Root Cause Diagram to perform visual root cause analysis. Root Cause Analysis Tree Diagram is constructed separately for each highly prioritized factor. The goal of this is to find the root causes for the factor and list possible corrective action. ConceptDraw Office suite is a software for problem analysis.
HelpDesk
How to Create a Time Series Dashboard
Time Series Dashboard means an integration of some type of diagrams: Line Charts, Bar Charts, Column Charts, and Dot Plots on a single space. The ConceptDraw Time Series Dashboard solution can be used to create the interactive Time Series dashboard. The libraries of Time Series Charts solution contain the Live Objects, that can change their appearance depending on the external data. Each chart from the Time Series dashboard displays particular source data. You can include Time Series Charts in your business or technical dashboards to show and compare the items changing over time.
 Android User Interface
The Android User Interface solution allows ConceptDraw PRO act as an Android UI design tool. Libraries and templates contain a variety of Android GUI elements to help users create images based on Android UI design.
 Status Dashboard
Status dashboard solution extends ConceptDraw PRO software with templates, samples and vector stencils libraries with graphic indicators for drawing the visual dashboards showing status data.
Educational Technology Tools
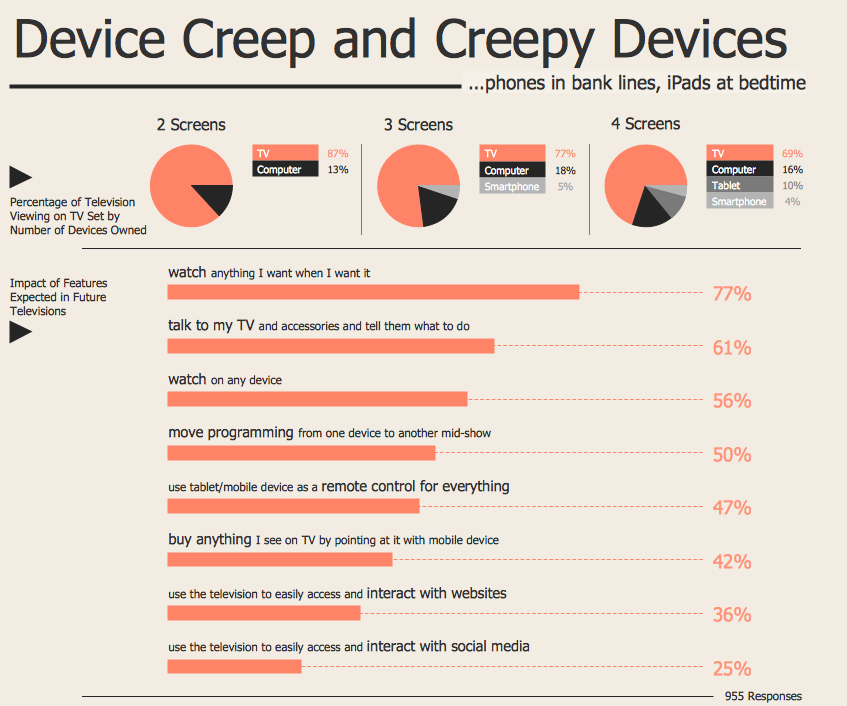
What are the favorite educational technology tools and techniques for teachers? Of course these are pictures, images and education infographics! ConceptDraw PRO software supplied with Education Infographics Solution from the Business Infographics Area provides powerful drawing tools to help design the education infographics of any complexity.Coloring Graphs
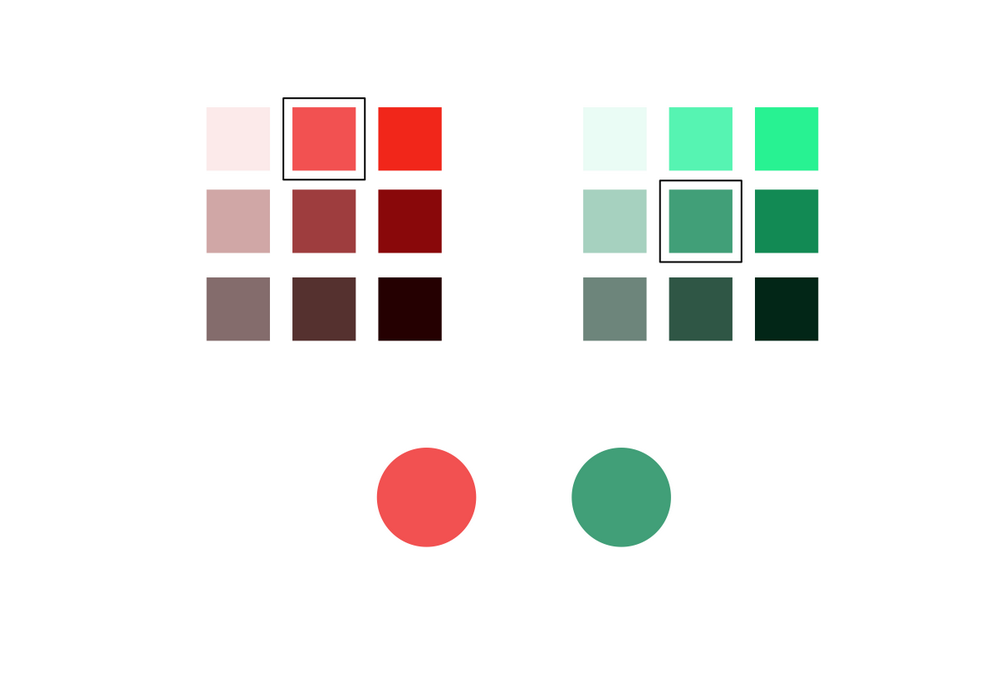
Color can be a very powerful tool when crafting images. Often, however, its usage is not justified.Balanced Scorecard Software
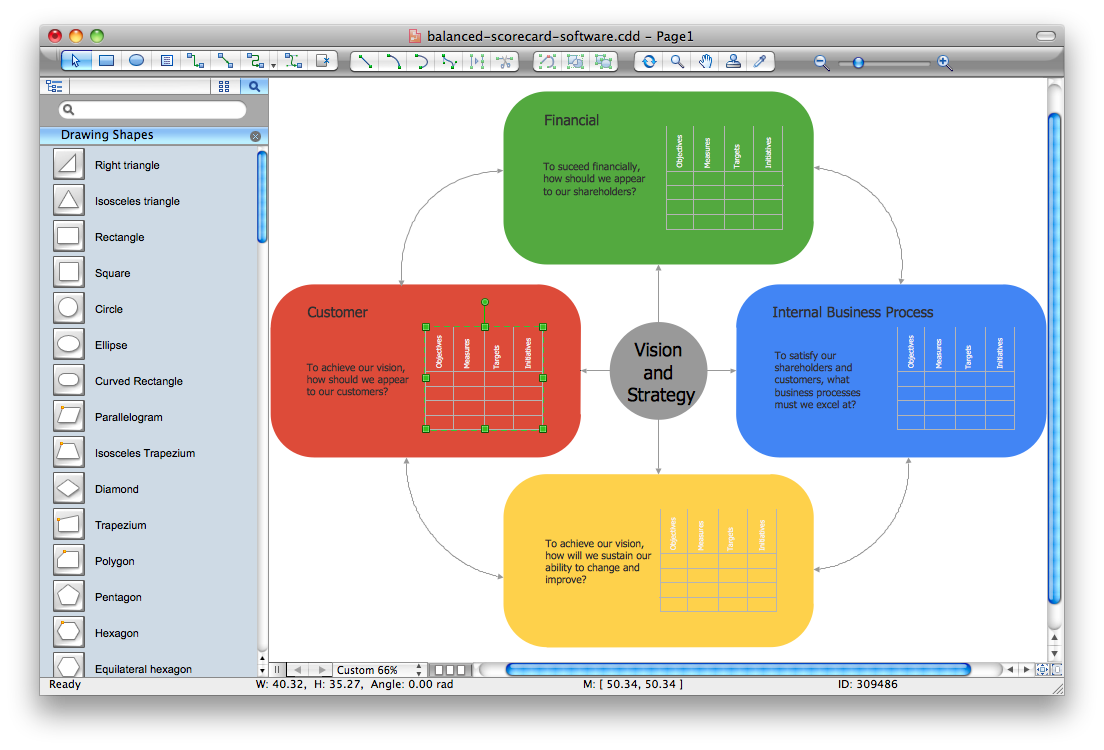
Balanced Scorecard Software provide incredible large variety of samples, templates and libraries of predesigned vector objects. Nothing could be easy that use the predesigned template and fill it, and simply drag the ready-to-use objects for designing your own balanced scorecard diagram.
 Meter Dashboard
Meter dashboard solution extends ConceptDraw PRO software with templates, samples and vector stencils library with meter indicators for drawing visual dashboards showing quantitative data.
Internet Marketing Infographic
ConceptDraw PRO extended with Marketing Infographics Solution from the Business Infographics Area is the best software for creating Internet Marketing Infographic of any complexity in minutes. Make sure in it right now!- Pie Chart Of Slum Diagram Images
- Picture graphs - Vector stencils library | Management indicators ...
- Management indicators - Vector stencils library | Education ...
- Dashboard Indicator Images
- How to Get Images for Project Presentation on Macintosh | How to ...
- Manufacturing in America | Picture graph - Template | Manufacturing ...
- Performance Indicators | PM Dashboards | Design elements - Sales ...
- Comparison Dashboard | Feature Comparison Chart Software ...
- Images For Bubbl Diagram
- Picture Graphs | Sales Growth. Bar Graphs Example | Barrie ...
- Kpi Images
- Dashboard Indicators
- Picture Graphs | Basic Flowchart Examples | Feature Comparison ...
- Pie Graph Worksheets | Bar Diagram Math | Pie Chart Examples and ...
- Picture Graph | Tools to Create Your Own Infographics | Feature ...
- Marketing Process Model Image
- Picture Graphs | Design elements - Picture graphs | Picture Graph ...
- Barrie population - Picture bar graph | Picture graphs - Vector ...
- Pie Chart Image
- Chart Examples | Column Chart Software | Chart Maker for ...


