 SWOT Analysis
SWOT and TOWS Matrix Diagrams solution extends ConceptDraw PRO and ConceptDraw MINDMAP software with features, templates, samples and libraries of vector stencils for drawing SWOT and TOWS analysis matrices and mind maps.
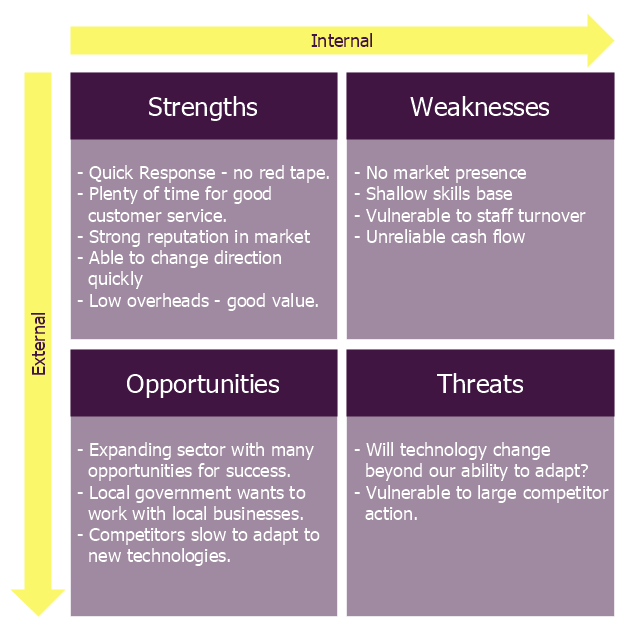
"The name says it: Strength, Weakness, Opportunity, Threat. A SWOT analysis guides you to identify the positives and negatives inside your organization (S-W) and outside of it, in the external environment (O-T). Developing a full awareness of your situation can help with both strategic planning and decision-making.
The SWOT method (which is sometimes called TOWS) was originally developed for business and industry, but it is equally useful in the work of community health and development, education, and even personal growth.
SWOT is not the only assessment technique you can use, but is one with a long track record of effectiveness. The strengths of this method are its simplicity and application to a variety of levels of operation." [ctb.ku.edu/ en/ table-of-contents/ assessment/ assessing-community-needs-and-resources/ swot-analysis/ main]
The diagram example "Small business consultancy SWOT analysis matrix" was created using the ConceptDraw PRO diagramming and vector drawing software extended with the SWOT Analysis solution from the Management area of ConceptDraw Solution Park.
 Management
This solution extends ConceptDraw PRO v9 and ConceptDraw MINDMAP v7 with Management Diagrams and Mind Maps (decision making, scheduling, thinking ideas, problem solving, business planning, company organizing, SWOT analysis, preparing and holding meetings
 Quality
This solution extends ConceptDraw PRO v9 and ConceptDraw MINDMAP v7 with Quality Management Diagrams (Total Quality Management Diagrams, Timelines, Workflows, Value Stream Maps) and Mind Maps (Presentations, Meeting Agendas, Problem to be solved).
 PM Easy
This solution extends ConceptDraw PROJECT software with the ability to quickly start a project; it lists task relationships and dependencies to make iterative planning easy.
 Crystal Mapping
With Crystal Mapping all goals and relevant information can be observed in one radiant dashboard.
 Management Area
The solutions from Management area of ConceptDraw Solution Park collect templates, samples and libraries of vector stencils for drawing the management diagrams and mind maps.
 Block Diagrams
Block diagrams solution extends ConceptDraw PRO software with templates, samples and libraries of vector stencils for drawing the block diagrams.
 Bar Graphs
The Bar Graphs solution enhances ConceptDraw PRO v10 functionality with templates, numerous professional-looking samples, and a library of vector stencils for drawing different types of Bar Graphs, such as Simple Bar Graph, Double Bar Graph, Divided Bar Graph, Horizontal Bar Graph, Vertical Bar Graph, and Column Bar Chart.
 ConceptDraw Solution Park
ConceptDraw Solution Park collects graphic extensions, examples and learning materials
HelpDesk
How to Draw a Pareto Chart Using ConceptDraw PRO
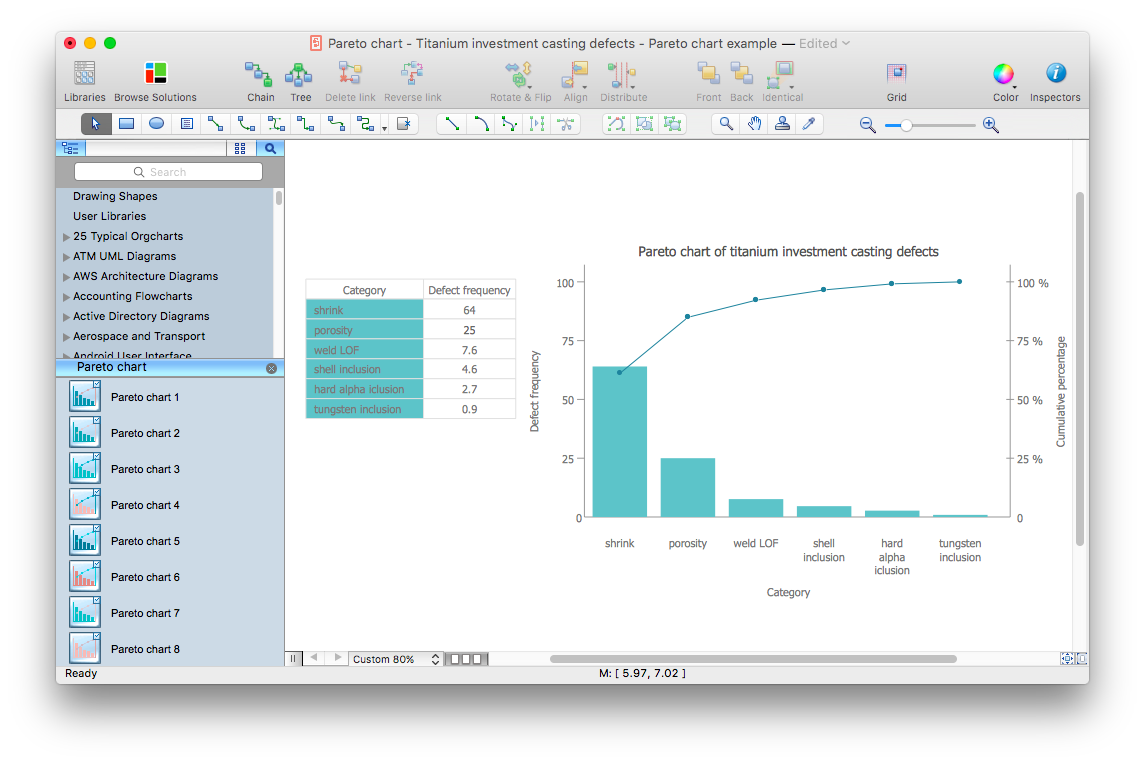
The Seven Basic Tools of Quality were picked as effective visual tool-set for identifying the root cause of quality-related problems within the workplace. Seven Basic Tools of Quality comprise of seven diagram that are diverse enough to be used to any business troubleshooting scenario, but simple enough that employees of all types can understand and apply them. One of these tools is a Pareto chart. It combines both a line graph and a bar chart, where the bar chart displays data values, and a line represents a total value. Pareto chart is used for quality control to identify the source of the quality problem.ConceptDraw Seven Basic Tools of Quality solution delivers a big set of vector stencil libraries and samples for each quality control diagram, including a Pareto chart.
 Winter Sports
The Winter Sports solution from Sport area of ConceptDraw Solution Park contains winter sports illustration examples, templates and vector clipart libraries.
 Social Media Response
This solution extends ConceptDraw PRO and ConceptDraw MINDMAP with the ability to draw interactive flow charts with action mind map templates, to help create an effective response to applicable social media mentions.
 Australia Map
For graphic artists creating accurate maps of Australia. The Australia Map solution - allows designers to map Australia for their needs, offers a collection of scalable graphics representing the political geography of Australia, split into distinct state
 PM Planning
This solution extends ConceptDraw MINDMAP and ConceptDraw Project software, allowing you to automatically create documents that reflect a project's status, for people who have different project roles.
 Histograms
How to make a Histogram? Making a Histogram is an incredibly easy process when it is done with ConceptDraw PRO. The Histograms Solution enhances ConceptDraw PRO v10 functionality with extensive drawing tools, numerous samples, and examples; also a quick-start template and library of ready vector stencils for visualization the data and professional drawing Histograms.
- SWOT Analysis | Swot Analysis Examples | SWOT Sample in ...
- SWOT Analysis | New business opportunity SWOT analysis matrix ...
- SWOT Analysis | Swot Analysis Examples | How to Create SWOT ...
- SWOT Analysis | Small business consultancy SWOT analysis matrix ...
- SWOT analysis matrix diagram templates | Swot Analysis Examples ...
- SWOT Matrix Template
- SWOT analysis matrix
- SWOT Analysis | New business opportunity SWOT analysis matrix ...
- Swot Analysis Examples | SWOT analysis matrix diagram templates ...
- Swot Analysis Strengths, Weaknesses, Opportunities, and Threats ...
- SWOT Sample in Computers | SWOT Analysis | How to Make SWOT ...
- Swot Analysis Strengths, Weaknesses, Opportunities, and Threats ...
- Four-quadrant matrix template | New business opportunity SWOT ...
- Swot Analysis Strengths, Weaknesses, Opportunities, and Threats ...
- Swot Analysis Strengths, Weaknesses, Opportunities, and Threats ...
- SWOT Analysis Solution - Strategy Tools | Pyramid Chart Examples ...
- Swot Analysis Strengths, Weaknesses, Opportunities, and Threats ...
- SWOT Analysis Solution - Strategy Tools | SWOT and TOWS Matrix ...
- SWOT Analysis Tool for Small Business | SWOT matrix template ...
- TOWS analysis matrix diagram - instructional sample | Swot Analysis ...

