Tools to Create Your Own Infographics
Over the past few centuries, data visualization has evolved so much that we use it every day in all areas of our lives. Many believe that infographic is an effective tool of storytelling, as well as analytics, and that it is able to overcome most of the language and educational barriers. Understanding the mechanisms of human perception will help you to understand how abstract forms and colors used in data visualization can transmit information more efficient than long paragraphs of text.Spatial infographics Design Elements: Location Map
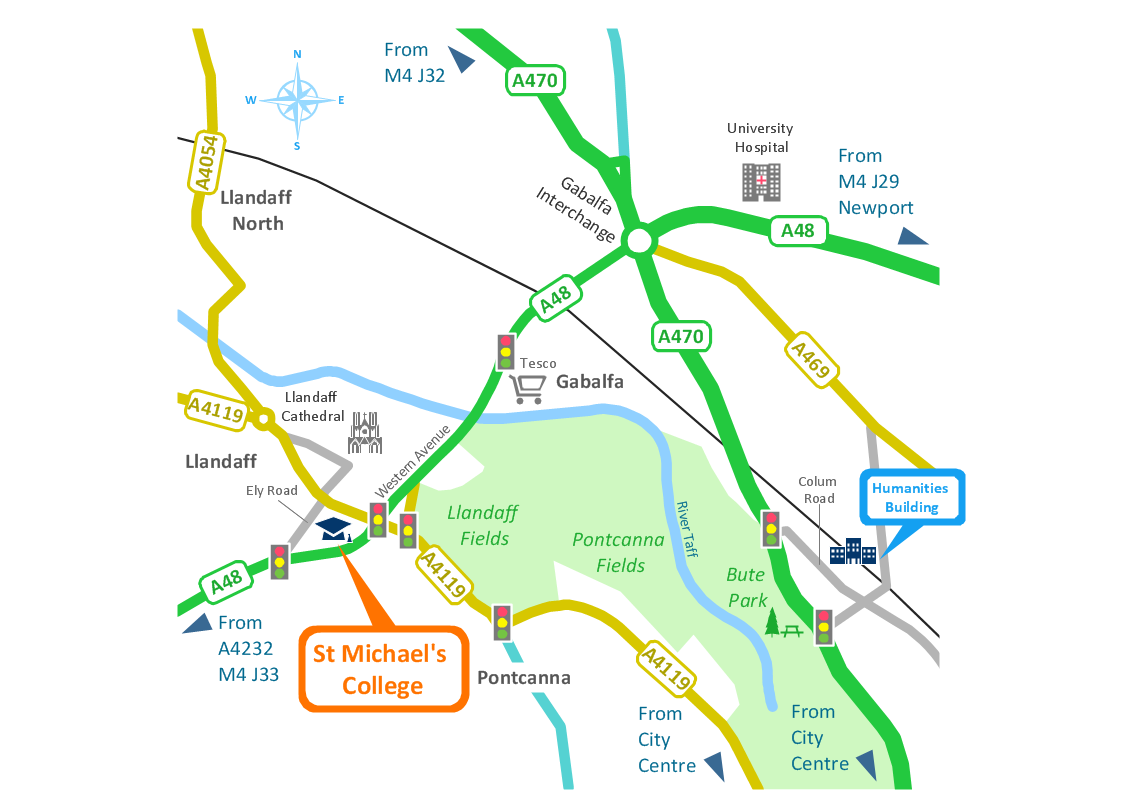
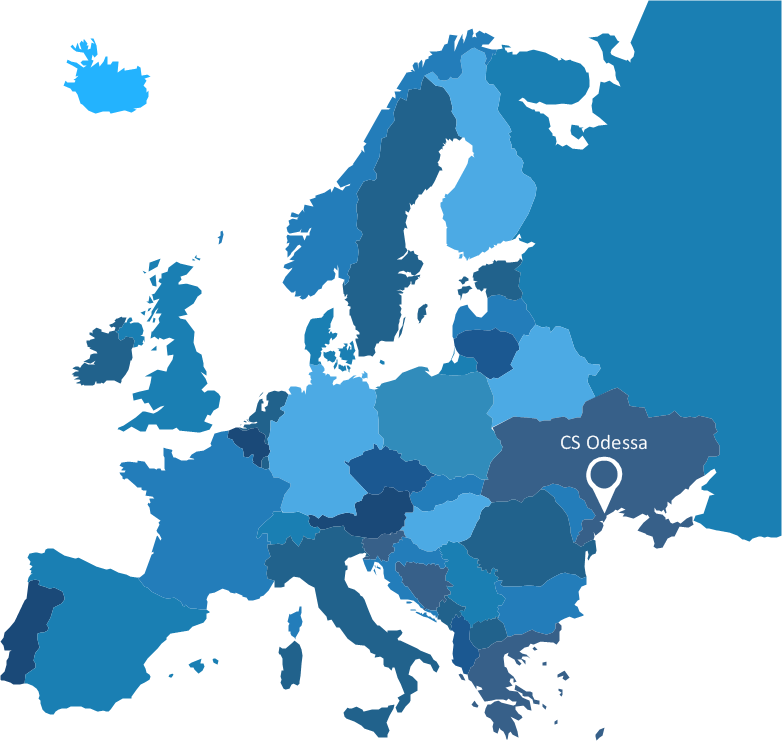
Infographic Design Elements for visually present various geographically distributed information.Subway infographic design elements - software tools
Subway infographic design elements of MetroMap and ConceptDraw software tools.Spatial infographics Design Elements: Transport Map
Do you like infographics and data visualization? Creating infographics is super-easy with ConceptDraw.Infographic design elements, software tools Subway and Metro style
Subway infographic design elements for ConceptDraw PRO (mac and pc).Excellent Examples of Infographic Maps
Create Spatial infographics with ConceptDraw using its excellent examples of infographic maps. We hope these can inspire and teach you!How tо Represent Information Graphically
ConceptDraw Infographics is a great visual tool for communicating the large amounts of data and graphic visualization and representations of data and information.HelpDesk
How to Draw a Pyramid Diagram in ConceptDraw PRO
Pyramid diagram (triangle diagram) is used to represent data, which have hierarchy and basics. Due to the triangular form of diagram, each pyramid section has a different width. The width of the segment shows the level of its hierarchy. Typically, the top of the pyramid is the data that are more important than the base data. Pyramid scheme can be used to show proportional and hierarchical relationships between some logically related items, such as departments within an organization, or successive elements of any process. This type of diagram is often used in marketing to display hierarchical related data, but it can be used in a variety of situations. ConceptDraw PRO allows you to make a pyramid diagram, quickly and easily using special libraries.Visualization Spatial Data Using Thematic Maps Combined with Infographics
Now anyone can build an infographics from their data using ConceptDraw. Nice and simple, but the features it have are power-packed!HelpDesk
How To Import Shape Data from Visio to ConceptDraw PRO
MS Visio has objects, that can contain data. When user select a shape, the data is shown in the Shape Data window. This is useful for providing additional information, for instance, about some details in a process steps or nodes of equipment in a network diagram without overloading the general diagram with text. ConceptDraw PRO supports the possibility to import MS Visio files including custom libraries, shapes and even the shape data. The Shape Data you have assigned to the shapes in Visio will be fully preserved when opening in ConceptDraw PRO. The following article describes how Conceptdraw PRO can be used as alternative to Visio, including the import of Visio files together with custom data assigned to shapes.HelpDesk
How to Make a Rapid Draw Object in ConceptDraw PRO
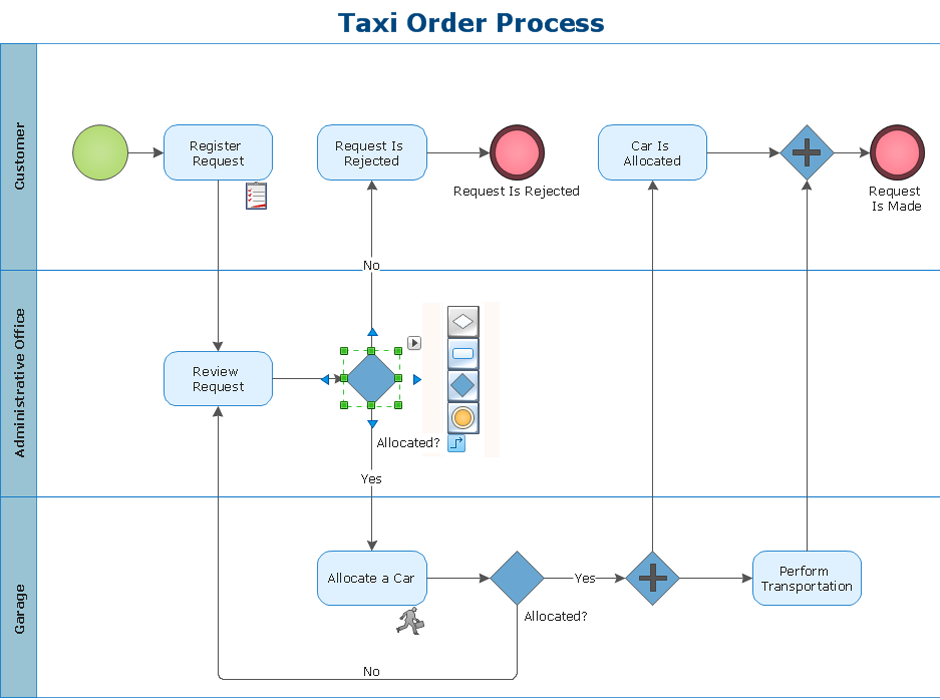
The Rapid Draw technology is an automatic drawing system. It is designed to significantly reduce the time of creating flowcharts and diagrams. Especially those, consisting from some typical entities. You can extend the standard ConceptDraw PRO object libraries with new objects by customizing any item from any library and assigning it with Rapid Draw features. You can quickly create and edit complex drawings using Rapid Draw technology and your self-created objects.HelpDesk
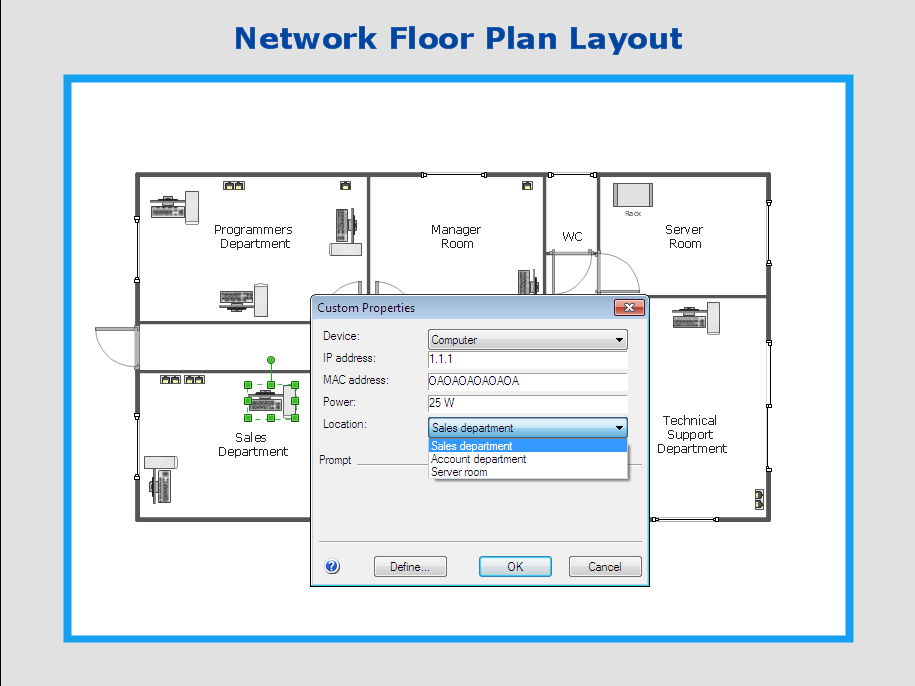
How to Work with Custom Properties in ConceptDraw PRO on PC
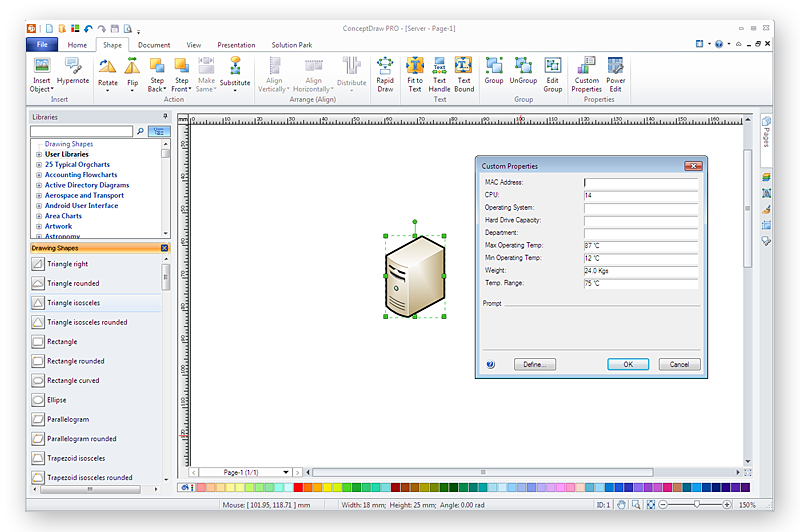
ConceptDraw PRO can store additional, user-defined data that can be assigned to a particular shape. This data is stored in the Custom Properties options.HelpDesk
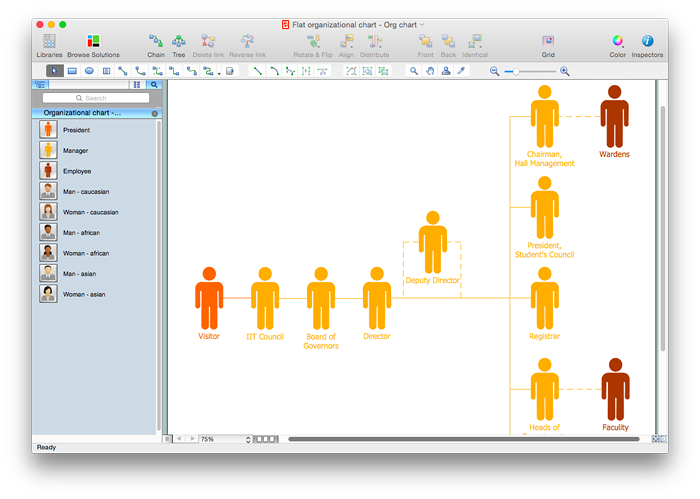
How to Draw a Flat Organizational Chart with ConceptDraw PRO
A clear organizational chart helps you to understand the relationships of positions in an organization in terms of authority and responsibility. A Flat organizational structure is one of the most typical organizational structure. Use The Flat Organizational chart template to draw an organizational structure of your company. ConceptDraw 25 Typical Orgcharts solution provides you with the possibility to develop typical organizational charts quickly and easily.How to draw Metro Map style infographics? Moscow, New York, Los Angeles, London
The solution handles designs of any complexity, and the comprehensive library covers all key aspects of a transportation system. To further enhance your map design, there is the option to embed links, that can display station images or other relevant, important information. We have also included a set of samples in the solution, that show the possible real-world application — complex tube systems including the London Tube and New York City Subway show the level of detail possible when using the Metro Map Solution.- Spatial infographics Design Elements: Continental Map | How to ...
- Process Flowchart | Typography Infographic Software | Make an ...
- Process Flowchart | ConceptDraw PRO Network Diagram Tool ...
- Design elements - Title blocks | Design elements - Education title ...
- Spatial infographics Design Elements: Continental Map | Spatial ...
- Basic Diagramming | Winter Sports. Olympic Games Infographics ...
- Design elements - Education titled callouts | Design elements ...
- Map of Germany | Subway infographic design elements - software ...
- Infographic Titles
- Infographic Generator | How to Create a Timeline Diagram in ...
- Subway infographic design elements - software tools | Spatial ...
- People | Cisco People. Cisco icons, shapes , stencils and symbols ...
- Construction Project Chart Examples | Best Tool for Infographic ...
- Visio Infographic Stencil
- Design elements - Management title blocks | Design elements ...
- Design elements - Education titled callouts | Design elements ...
- Sample Pictorial Chart. Sample Infographics | Infographic Maker ...
- Infographic Generator | ConceptDraw Solution Park | Typography ...
- Spatial infographics Design Elements: Continental Map ...


