Process Flowchart


How to Create Flowcharts for an Accounting Information System

Types of Flowcharts


Types of Flowchart - Overview

Flow chart Example. Warehouse Flowchart


Accounting Flowchart: Purchasing, Receiving, Payable and Payment

Basic Audit Flowchart. Flowchart Examples

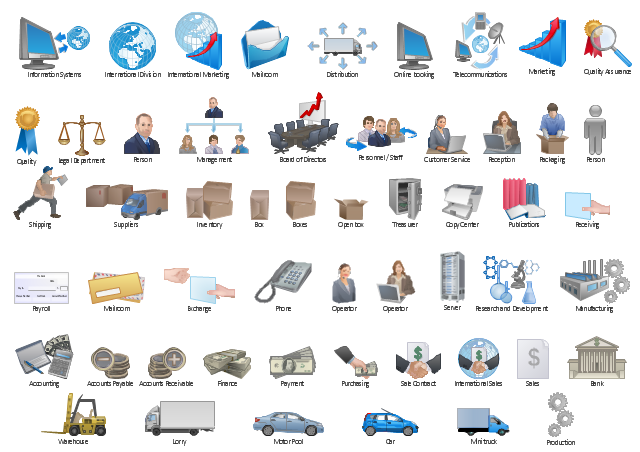
The vector stencils library "Workflow diagrams" contains 54 symbol icons of workflow diagrams.
The workflow diagrams represent information flow, automation of business processes, business process re-engineering, accounting, management, and human resources tasks in industry, business, and manufacturing.
Use this library to draw workflow diagrams in the ConceptDraw PRO diagramming and vector drawing software extended with the Workflow Diagrams solution from the Business Processes area of ConceptDraw Solution Park.
www.conceptdraw.com/ solution-park/ business-process-workflow-diagrams
Accounting

Accounts Payable

Accounts Receivable

Bank

Board of Directors

Copy Center

Customer Service

Distribution

Finance

Information Systems

International Division

International Marketing

International Sales

Inventory

Legal Department

Mailroom 2

Mailroom 1

Management

Manufacturing

Marketing

Motor Pool

Packaging

Payroll

Person 1

Person 2

Personnel/ Staff

Publications

Purchasing

Quality Assurance

Exchange

Reception

Research and Development

Sale contract

Shipping

Suppliers

Telecommunications

Treasurer

Warehouse

Lorry

Quality

Production

Box

Boxes

Open box

Payment

Receiving

Sales

Phone

Operator 1

Online booking

Operator 2

Server

Car

Mini truck

The vector stencils library "Workflow diagrams" contains 54 symbol icons of workflow diagrams.
Use these clipart to represent information flow, automation of business processes, business process re-engineering, accounting, management, and human resources tasks in industry, business, and manufacturing.
"The term workflow is more commonly used in particular industries, such as printing and professional domains, where it may have particular specialized meanings.
(1) Processes: A process is a more general notion than workflow and can apply to physical or biological processes, for instance; whereas a workflow is typically a process or collection of processes described in the context of work, such as all processes occurring in a machine shop.
(2) Planning and scheduling: A plan is a description of the logically necessary, partially ordered set of activities required to accomplish a specific goal given certain starting conditions. A plan, when augmented with a schedule and resource allocation calculations, completely defines a particular instance of systematic processing in pursuit of a goal. A workflow may be viewed as an (often optimal or near-optimal) realization of the mechanisms required to execute the same plan repeatedly.
(3) Flow control is a control concept applied to workflows, to distinguish from static control of buffers of material or orders, to mean a more dynamic control of flow speed and flow volumes in motion and in process. Such orientation to dynamic aspects is the basic foundation to prepare for more advanced job shop controls, such as just-in-time or just-in-sequence.
(4) In-transit visibility is a monitoring concept that applies to transported material as well as to work in process or work in progress, i.e., workflows." [Workflow. Wikipedia]
The example "Workflow diagram - Business" was drawn using the ConceptDraw PRO diagramming and vector drawing software extended with the Workflow Diagrams solution from the Business Processes area of ConceptDraw Solution Park.
Business - Work flow chart

Flow Diagram Software

The vector stencils library "Workflow diagrams" contains 54 symbol icons for drawing the work flow charts.
Use these clipart to represent information flow, automation of business processes, business process re-engineering, accounting, management, and human resources tasks in industry, business, and manufacturing.
"A workflow consists of an orchestrated and repeatable pattern of business activity enabled by the systematic organization of resources into processes that transform materials, provide services, or process information. It can be depicted as a sequence of operations, declared as work of a person or group, an organization of staff, or one or more simple or complex mechanisms.
From a more abstract or higher-level perspective, workflow may be a view or representation of real work, thus serving as a virtual representation of actual work. The flow being described may refer to a document, service or product that is being transferred from one step to another.
Workflows may be viewed as one fundamental building block to be combined with other parts of an organisation's structure such as information silos, teams, projects, policies and hierarchies." [Workflow. Wikipedia]
The clipart example "Design elements - Workflow diagram" was drawn using the ConceptDraw PRO diagramming and vector drawing software extended with the Workflow Diagrams solution from the Business Processes area of ConceptDraw Solution Park.
Workflow symbols
Process Flow Diagram

Cross-Functional Flowchart


HelpDesk
How to Draw a Chemical Process Flow Diagram

Bar Diagrams for Problem Solving. Create manufacturing and economics bar charts with Bar Graphs Solution

- Process Flowchart | How to Create Flowcharts for an Accounting ...
- Account Flowchart Stockbridge System. Flowchart Examples | Basic ...
- Accounting Flow Diagrams
- Basic Flowchart Symbols and Meaning | Audit Flowchart Symbols ...
- Invoice payment process - Flowchart | Accounting Flowchart ...
- Flow chart Example. Warehouse Flowchart | Accounting Flowcharts ...
- Management Control And Information Systems Flowchart
- Process Flowchart | How to Create Flowcharts for an Accounting ...
- Process Flowchart | Accounting Data Flow from the Accounting ...
- Circular Flow Diagram Template | Accounting Flowcharts | Why ...
- Account Flow Chart Sample
- Material Requisition Flowchart . Flowchart Examples | Flow chart ...
- Data Flow Diagram | Accounting Information Systems Flowchart ...
- Basic Flowchart Symbols and Meaning | Audit Flowchart Symbols ...
- Information Flow Diagram
- Flow Diagrams In Industry Pdf
- Accounting Flowchart : Purchasing, Receiving, Payable and ...
- Process Flowchart | DFD Library System | Data Flow Diagram ...
- Data Flow Diagram Process | Why Flowchart Important to ...
- Material Requisition Flowchart . Flowchart Examples | Workflow ...