What is Interactive Flowcharts
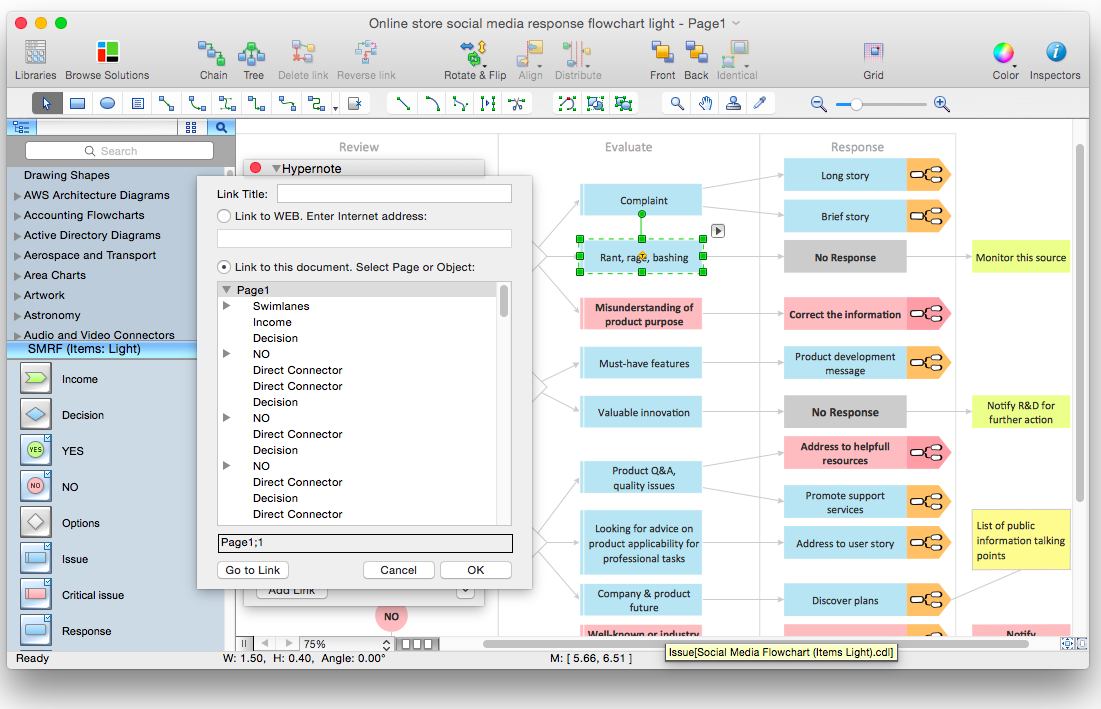
Organizing and Selecting Social Media Response Messages. Interactive Flowcharts can change the way one creates and organizes their social media response process.Create Response Charts
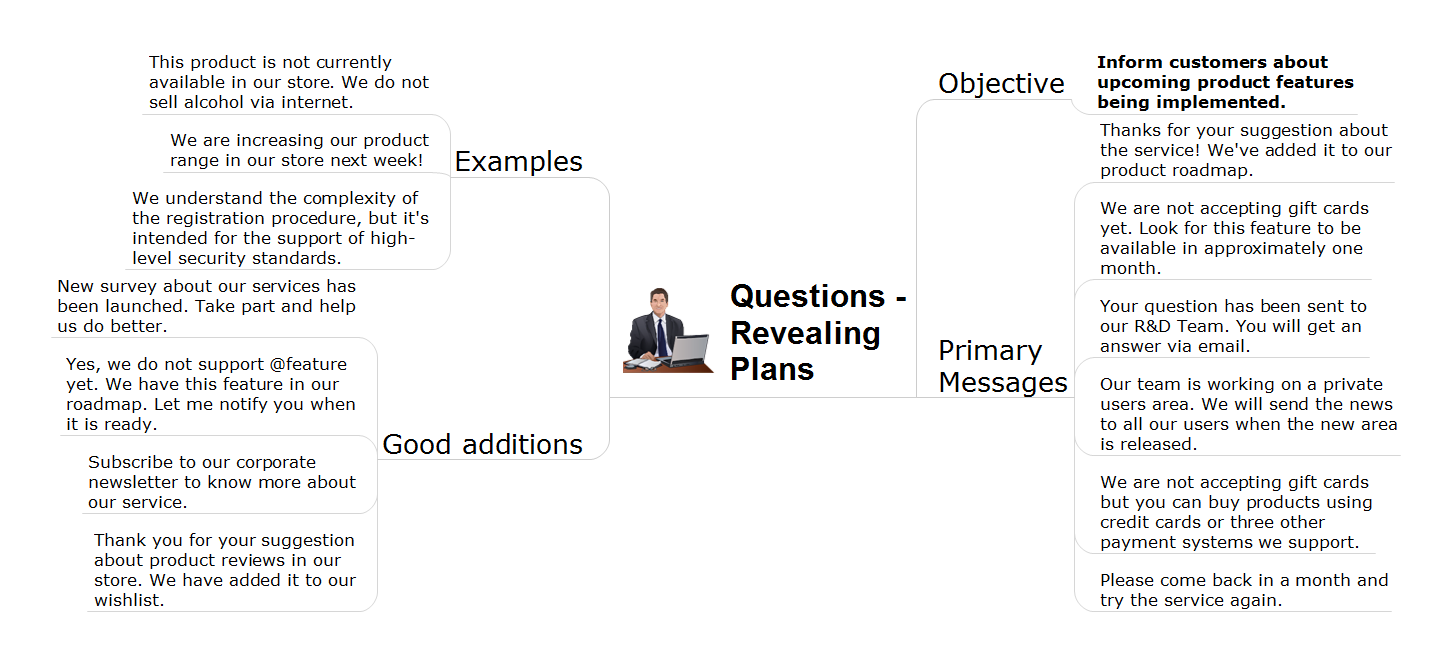
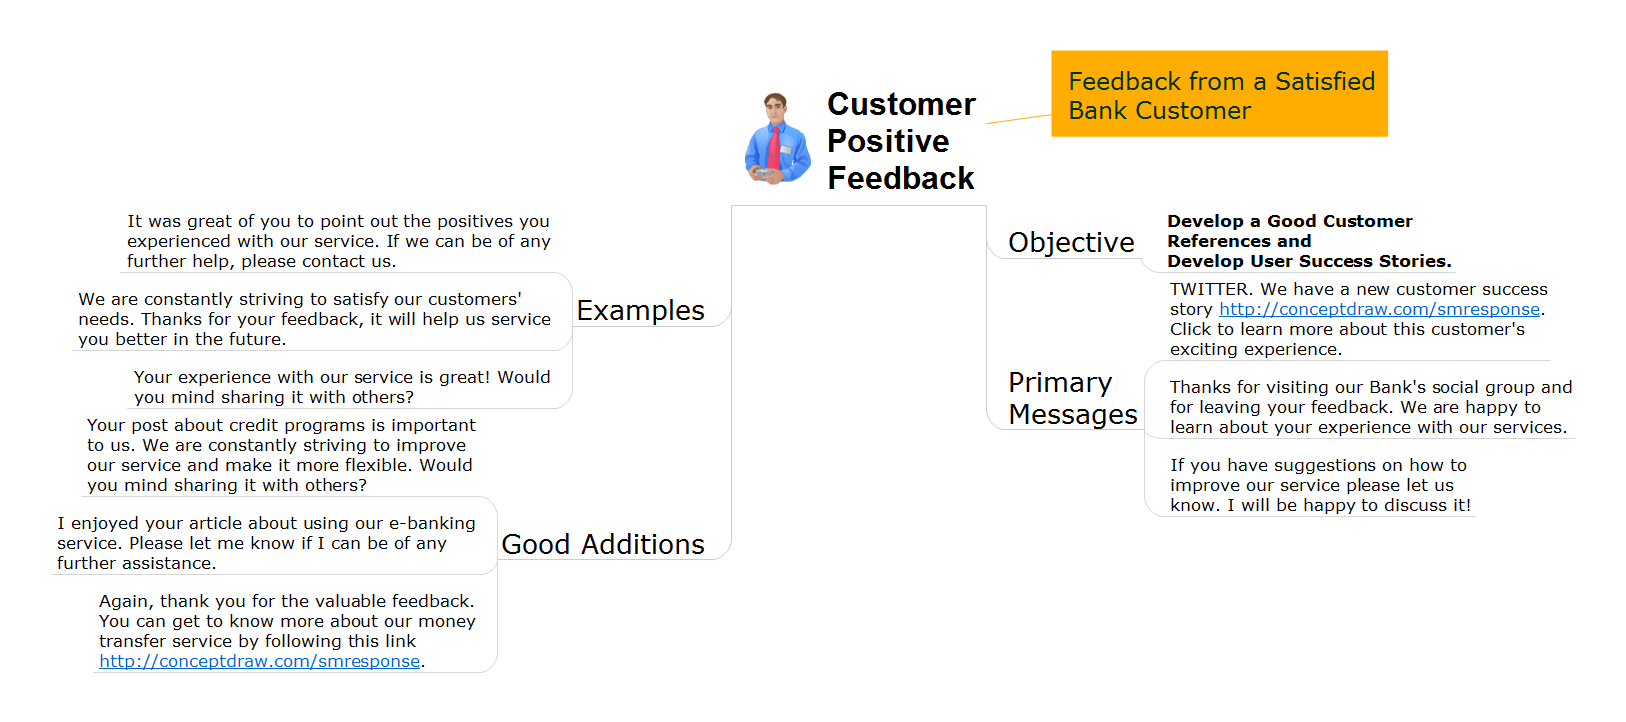
Visual navigation through the stages of a response process helps you locate specific actions to be taken via Action Mind Maps. Use ConceptDraw PRO and ConceptDraw MINDMAP for organize the process of response for interactions occurring in social media.Social Media Response DFD Flowcharts - diagramming software ( Mac PC )
Diagramming software for Mac and PC - create flowcharts and presentations for Social Media Organizing.
 Social Media Response
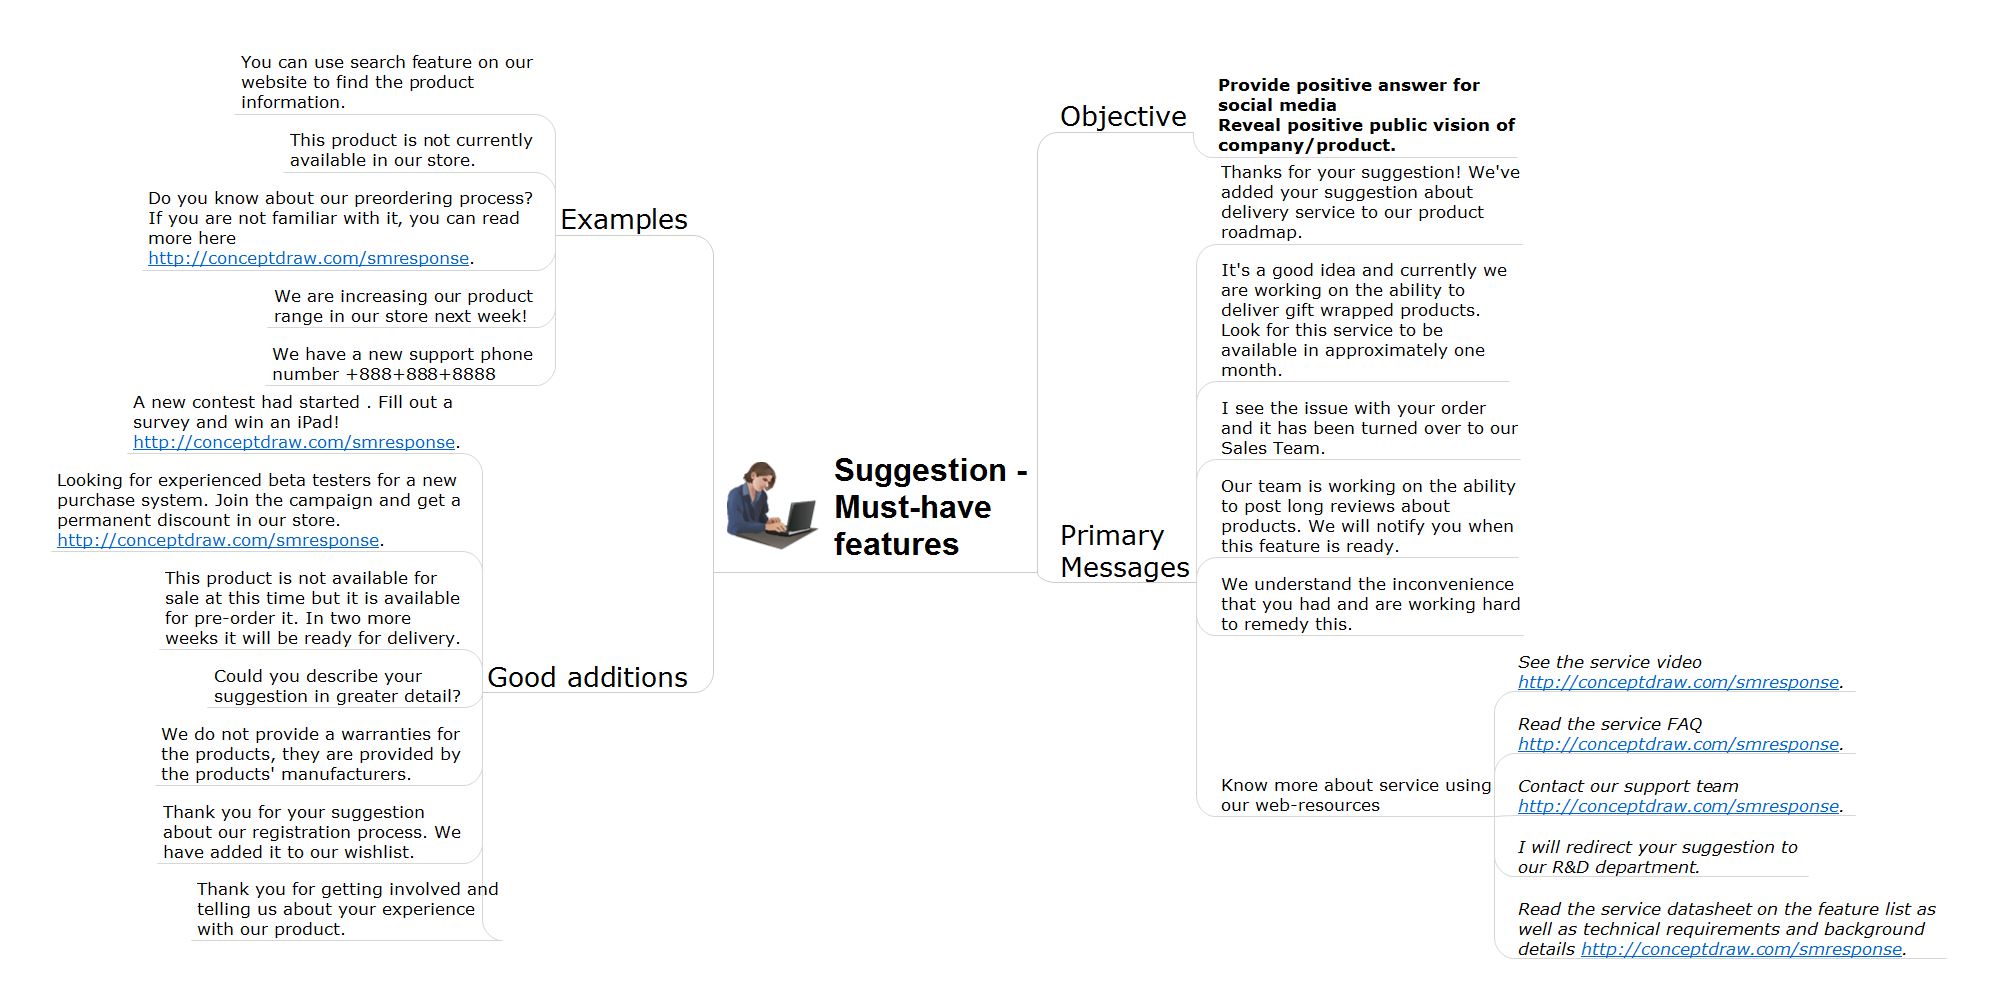
This solution extends ConceptDraw PRO and ConceptDraw MINDMAP with the ability to draw interactive flow charts with action mind map templates, to help create an effective response to applicable social media mentions.
HelpDesk
How to Organize a Social Media Activity Using Social Media Response Solution
Tips on how to use flowcharting and mindmapping for social media activity organizing
Social Media Response Management DFD Charts - software tools
ConceptDraw is your tool for driving social integration and managing change across and streamline social media processes of your organisation.This tool keeps the entire team on the same page allowing you to realize your social media strategy, improve the quality of your answers, and minimize the time it takes to respond.
 Interactive Voice Response Diagrams
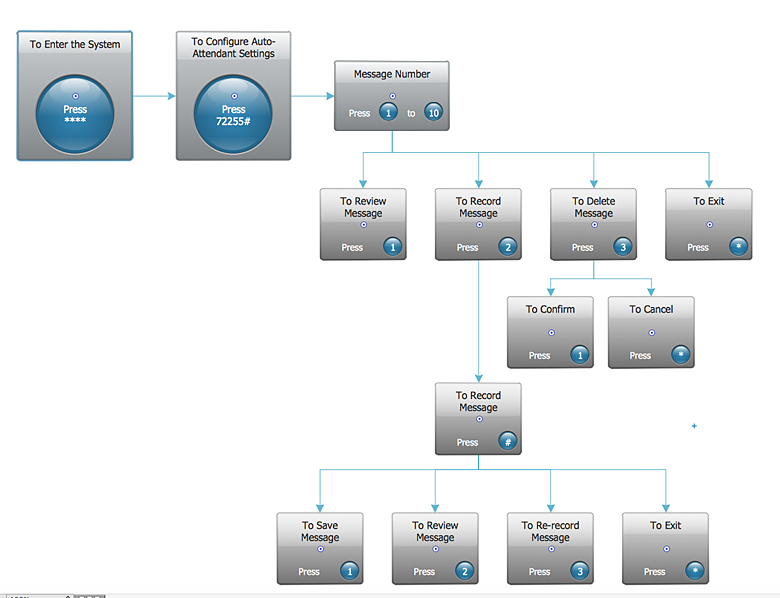
Interactive Voice Response Diagrams solution extends ConceptDraw PRO v10 with samples, templates and library of ready-to-use vector stencils to help create Interactive Voice Response (IVR) diagrams illustrating a work of interactive voice response system, Voice-over-Internet Protocol (VoIP) diagrams and Action VoIP diagrams with representing voice actors on them.
Provide Team Training
ConceptDraw MINDMAP has a new challenges in leading or taking instruction during remote mind map presentation and available to deliver lessons to a remote group via a Skype conference call. ConceptDraw PRO provides tools to develop a response flowchart that can be connected with Action Mind Maps.HelpDesk
How to Create an Interactive Voice Response (IVR) Diagram in ConceptDraw PRO
Interactive Voice Response (IVR) Diagram is used to create and conduct the Interactive Voice Response systems for call-centers and voice mail services. IVR diagrams intended to visualize the logical and physical structure of Interactive voice response systems. ConceptDraw solution for Interactive Voice Response (IVR) Diagram allows you to create and communicate the Interactive Voice Response diagram of any complexity. Interactive Voice Response (IVR) System is a telecommunication technology that enables a computer to automatically process voice and touch phone signals. IVR systems allows users to interact through a computer with various service systems, available by telephone. The objective of IVR system is to reduce customer service costs by delivering self service to customers and guiding them to the information that they look for.The Means to Respond to Social Media Mentions
Which trends are on the horizont of social media? What’s we have to prepare for? Look into the future with ConceptDraw products.HelpDesk
How to Create a Sales Dashboard Using ConceptDraw PRO
Visual dashboard is a valuable tool for any sales team. Sales dashboard allows you to view and monitor sales indicators that are important for manager and sales staff . It helps to use the timely and reliable information to improve the quality of sales performance and increase sales revenues. ConceptDraw Sales Dashboard solution is a tool for both: sales manager and sales team. It provides the visualization of key performance indicators that are critical to the entire sales organization. The custom sales dashboard displays the real-time information on sales performance KPIs with the help of intuitive and easy-to-understand diagrams and charts.
How to Connect Social Media DFD Flowchart with Action Maps
The Social Media Response solution creates interactive social media flow charts and action mind maps. The solution includes a video tutorial and a number of samples helping social media teams refine and organize their response process.
 ConceptDraw Solution Park
ConceptDraw Solution Park collects graphic extensions, examples and learning materials
HelpDesk
How to Use ConceptDraw Sales Dashboard Solution
The interactive visual dashboard is a valuable tool for any sales team. Sales dashboard allows you to view and monitor sales indicators that are important for manager and sales staff . It helps to use the timely and reliable information to improve the quality of sales performance and increase sales revenues. ConceptDraw Sales Dashboard solution is a tool for both: sales manager and sales team. It provides the visualization of key performance indicators that are critical to the entire sales organization. The custom sales dashboard displays the real-time information on sales performance KPIs with the help of intuitive and easy-to-understand diagrams and charts. Sales Dashboard helps the entire team see where they are, and what needs to be done. With ConceptDraw PRO you can easily create a visual Sales Dashboard using Live Objects Technology.
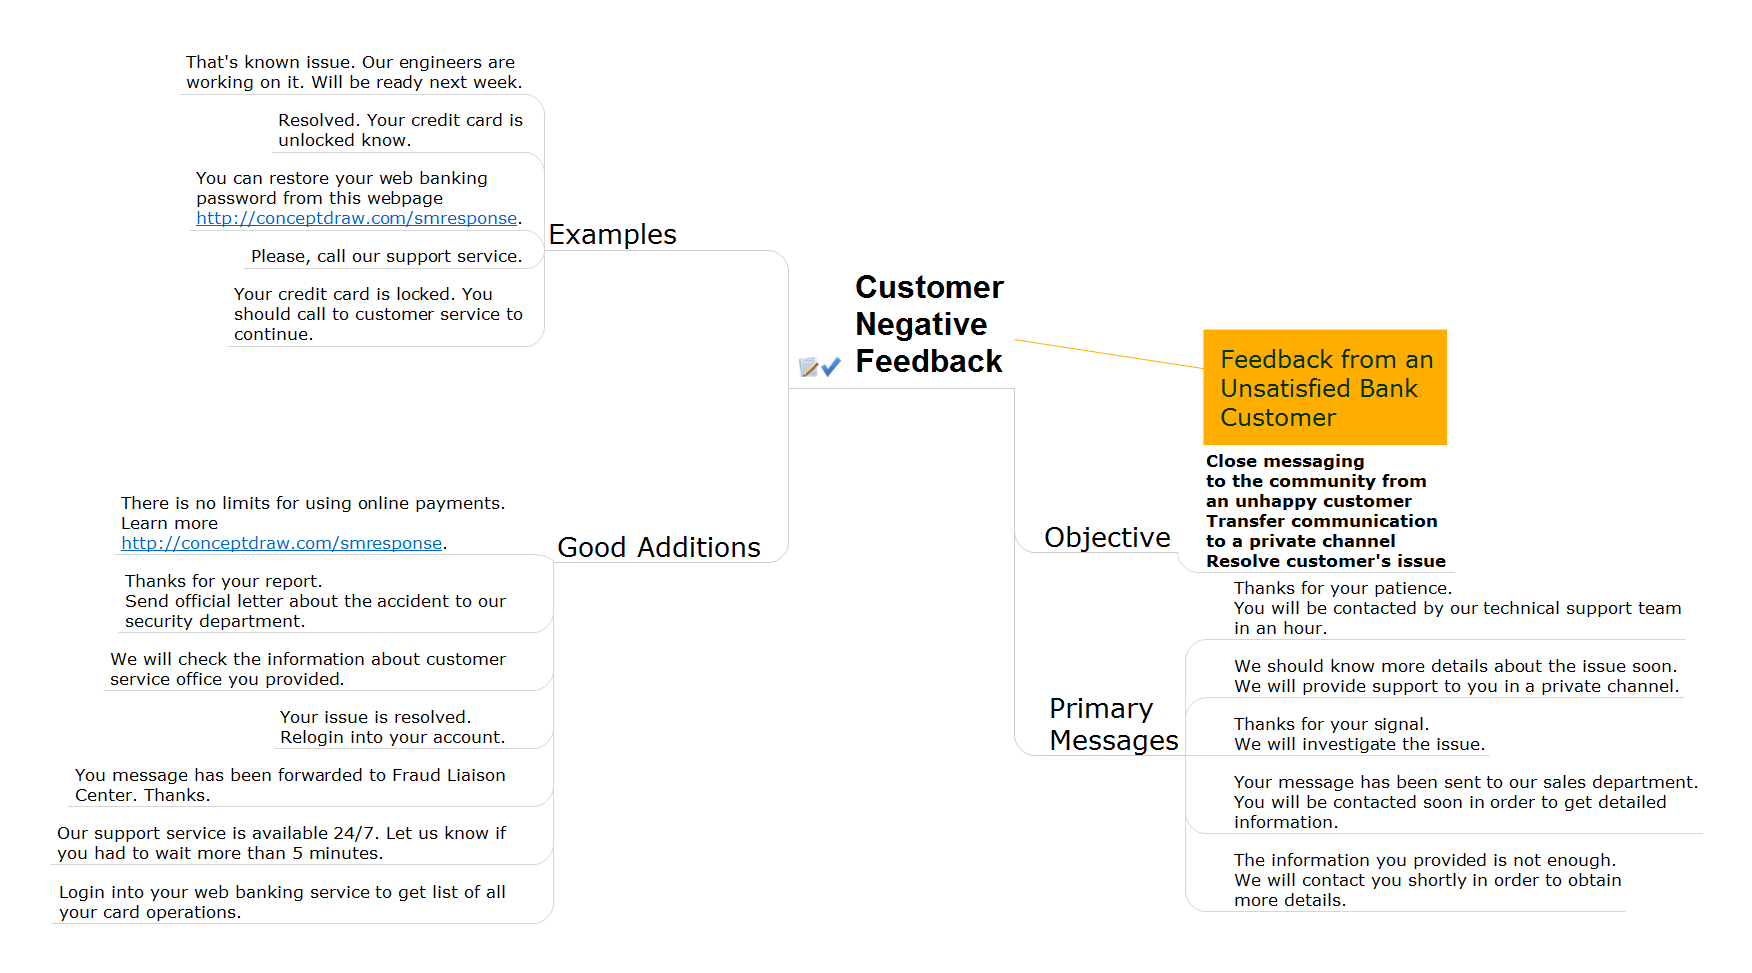
Response to Customer Negative Feedback
Response to Customer Negative feedback - ConceptDraw PRO helps to realize the process of response for interactions occurring in social media. Interactive Flowcharts can change the way one creates and organizes their social media response process.How to Present Workflow to Team
To pull a social media team together, to set your objectives, to develope an integrated communications strategy.HelpDesk
How to Connect Text Data to a Time Series Chart on Your Live Dashboard
Time Series Dashboard means an integration of some type of diagrams: Line Charts, Bar Charts, Column Charts, and Dot Plots on a single space. The ConceptDraw Time Series Dashboard solution can be used to create the interactive Time Series dashboard. The libraries of Time Series Charts solution contain the Live Objects, that can change their appearance depending on the external data. Each chart from the Time Series dashboard displays particular source data. You can include Time Series Charts in your business or technical dashboards to show and compare the items changing over time.
 Audit Flowcharts
Audit flowcharts solution extends ConceptDraw PRO software with templates, samples and library of vector stencils for drawing the audit and fiscal flow charts.
 Accounting Flowcharts
Accounting Flowcharts solution extends ConceptDraw PRO software with templates, samples and library of vector stencils for drawing the accounting flow charts.
 Sales Flowcharts
The Sales Flowcharts solution lets you create and display sales process maps, sales process workflows, sales steps, the sales process, and anything else involving sales process management.
- What is Interactive Flowcharts | Program to Make Flow Chart ...
- What is Interactive Flowcharts | Create Response Charts | How to ...
- How to Create a Social Media DFD Flowchart | What is Interactive ...
- What is Interactive Flowcharts | Cross-Functional Flowchart (Swim ...
- Cross-Functional Flowcharts | Accounting Flowcharts | What is ...
- Types of Flowchart - Overview | Create Response Charts | What is ...
- Social Media Response | What is Interactive Flowcharts | How to ...
- Flow Chart Online | What is Interactive Flowcharts | How to Create a ...
- Create Response Charts | What is Interactive Flowcharts | Manage ...
- Interactive Training Tool | What is Interactive Flowcharts | Interactive ...
- Examples of Flowcharts , Org Charts and More | What is Interactive ...
- Cross-Functional Flowcharts | Types of Flowcharts | What is ...
- What is Interactive Flowcharts | How to Create a Sales Dashboard ...
- What is Interactive Flowcharts | Create Response Charts | Interactive ...
- Project Management Area | Basic Flowchart Symbols and Meaning ...
- Process Flowchart | What is Interactive Flowcharts | Flowchart ...
- Cross-Functional Flowcharts | What is Interactive Flowcharts ...
- Best Flowchart Software | Create Flowchart | What is Interactive ...
- Applications | Program Structure Diagrams | What is Interactive ...
- Basic Diagramming | Create Response Charts | What is Interactive ...


