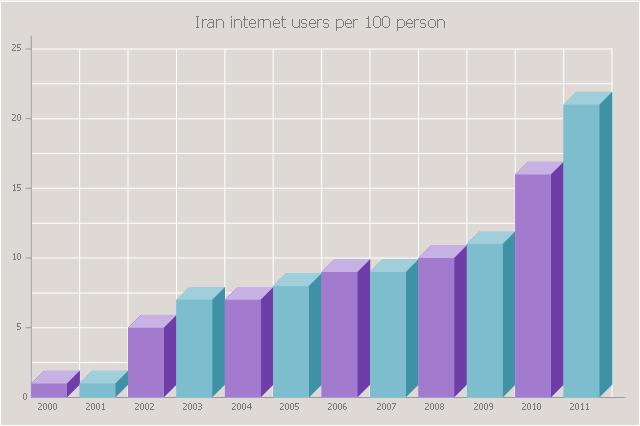
The 3D vertical bar graph sample shows the Iran internet users per 100 person from 2000 to 2011. It was designed on the base of the Commons Wikimedia file: Iran internet users per 100 person.png.
[commons.wikimedia.org/ wiki/ File:Iran_ internet_ users_ per_ 100_ person.png]
This file is licensed under the Creative Commons Attribution-Share Alike 3.0 Unported license. [creativecommons.org/ licenses/ by-sa/ 3.0/ deed.en]
The data source is World Bank: [data.worldbank.org/ country/ iran-islamic-republic]
"In 1993 Iran became the second country in the Middle East to be connected to the Internet, and since then the government has made significant efforts to improve the nation's ICT infrastructure. Iran's national Internet connectivity infrastructure is based on two major networks: the public switched telephone network (PSTN) and the public data network. The PSTN provides a connection for end-users to Internet service providers (ISPs) over mostly digital lines and supports modem-based connections. The Data Communication Company of Iran (DCI), a subsidiary of TCI, operates the public data network." [Internet in Iran. Wikipedia]
The 3D column chart example "Iran internet users per 100 person" was created using the ConceptDraw PRO diagramming and vector drawing software extended with the Bar Graphs solution from the Graphs and Charts area of ConceptDraw Solution Park.
Column Chart Software
ConceptDraw Column Chart software allows drawing column charts using predesigned objects or drawing tools. In ConceptDraw Column Chart software you can find a complete set of column chart tools and objects.
 ConceptDraw Solution Park
ConceptDraw Solution Park collects graphic extensions, examples and learning materials
Internet Marketing Infographic
ConceptDraw DIAGRAM extended with Marketing Infographics Solution from the Business Infographics Area is the best software for creating Internet Marketing Infographic of any complexity in minutes. Make sure in it right now!The Best Mac Software for Diagramming or Drawing
ConceptDraw DIAGRAM is a powerful intelligent vector graphics engine that can be used to create basic diagrams including flowcharts, charts, workflows, flowcharts, organizational charts, business diagram, learn business diagrams, flow diagrams.
Pictorial Chart
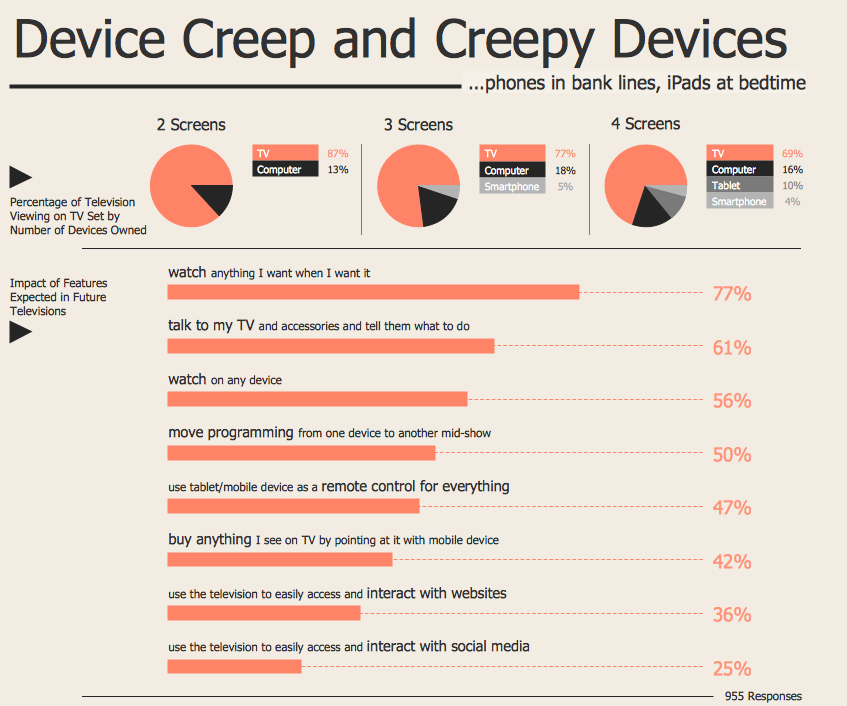
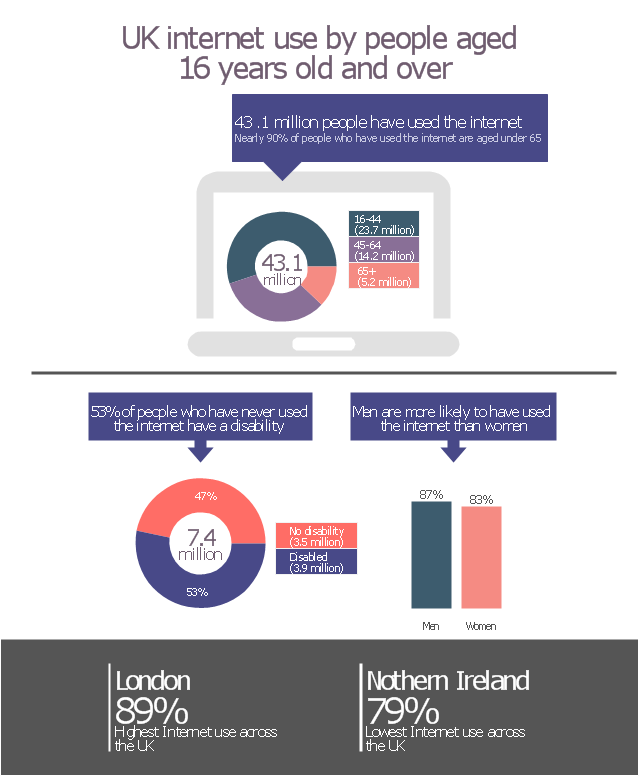
You want design Pictorial Chart or Infographic? And you need powerful infographic software? Then ConceptDraw DIAGRAM diagramming and vector drawing software extended with Pictorial Infographics Solution from the “Infographics” Area is exactly what you need.This data-driven infographics example was redesigned from the Wikimedia Commons file: UK internet use by people aged 16 years and over. Estimates of people who have ever or never used the Internet, Quarter 1 2013.png.
"UK internet use by people aged 16 years and over. Estimates of people who have ever or never used the Internet, Quarter 1 2013." [commons.wikimedia.org/ wiki/ File:UK_ internet_ use_ by_ people_ aged_ 16_ years_ and_ over._ Estimates_ of_ people_ who_ have_ ever_ or_ never_ used_ the_ Internet,_ Quarter_ 1_ 2013.png]
The donut chart and column graph sample "UK internet use by people" was created using the ConceptDraw PRO diagramming and vector graphics software extended with the Data-driven Infographics" solution from the area "What is infographics" of ConceptDraw Solution Park.
Radar Chart
This sample shows the Radar Chart that compares the internet dimensions in the four countries. The Radar Chart represents the multivariate data as a two-dimensional chart with three or more variables displayed on the axes that start in one point. The Radar Charts are used in the quality management, business, analytics and sport.HelpDesk
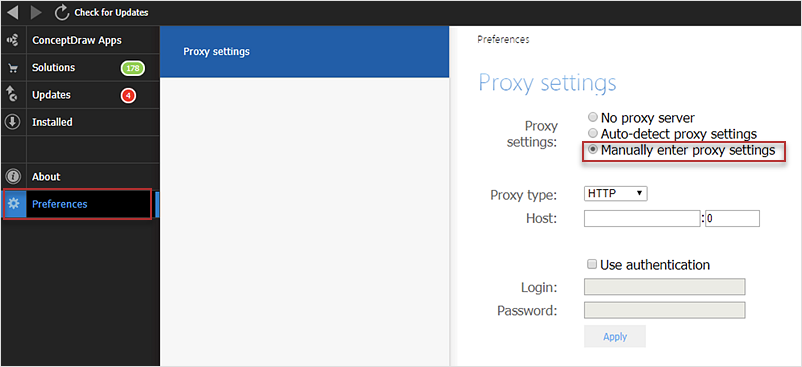
How to Download ConceptDraw Products Through a Proxy Server
If you are on a corporate network, there’s a good chance you connect to the Internet using a proxy server. Thankfully, ConceptDraw automatically detects your proxy settings and works just fine through HTTP(S) proxy servers.
 Bar Graphs
The Bar Graphs solution enhances ConceptDraw DIAGRAM functionality with templates, numerous professional-looking samples, and a library of vector stencils for drawing different types of Bar Graphs, such as Simple Bar Graph, Double Bar Graph, Divided Bar Graph, Horizontal Bar Graph, Vertical Bar Graph, and Column Bar Chart.
 Interactive Voice Response Diagrams
Interactive Voice Response Diagrams solution extends ConceptDraw DIAGRAM software with samples, templates and libraries of ready-to-use vector stencils that help create Interactive Voice Response (IVR) diagrams illustrating in details a work of interactive voice response system, the IVR system’s logical and physical structure, Voice-over-Internet Protocol (VoIP) diagrams, and Action VoIP diagrams with representing voice actions on them, to visualize how the computers interact with callers through voice recognition and dual-tone multi-frequency signaling (DTMF) keypad inputs.
Column Chart Examples
Column chart examples from ConceptDraw collection can help you find the best visual depiction for you data. You can easily modify column chart examples according to data you want to visualize.How to Create a Social Media DFD Flowchart
The use of social media in modern conditions helps the companies to be more effective in timely messaging - actively and rapidly response to a customer posts in social media, to find quickly the appropriate response to social media mentions, to save greatly the budget. Many companies even use the social media as a lead tool for promotion. But how to create a Social Media DFD Flowchart, Social Media Response Flowchart or Action Mind Map fast and easy? ConceptDraw DIAGRAM ector graphical software and Social Media Response solution included to ConceptDraw Solution Park assist greatly in their creation. This solution improves the quality of content in social media and helps to build an active customer community. The samples and examples included to Social Media Response solution are helpful for social media teams in developing a social media strategy, in refining and organizing the response process, in creation training materials by trainers and consultants for education the social media groups on how to accomplish the most effectiveness in their daily work.- Internet solutions with ConceptDraw PRO | 3D Column chart - Iran ...
- Concept map - Internet marketing | Internet solutions with ...
- ConceptDraw PRO Compatibility with MS Visio | Internet solutions ...
- Internet solutions with ConceptDraw PRO | Internet Marketing ...
- Marketing | Internet marketing - Concept map | Design elements ...
- Internet Connectivity. Computer and Network Examples | 3D Column ...
- Internet solutions with ConceptDraw PRO | How To Use ...
- Social Media Marketing Infographic | Internet Marketing Infographic ...
- Organization chart - Foodbank | Horizontal Orgchart | Management ...
- 3D Column chart - Iran internet users per 100 person | Isp Chart
- Internet marketing - Concept map | Concept Maps | What Is a ...
- Column Chart Software | Chart Maker for Presentations | Column ...
- 3D Column chart - Iran internet users per 100 person | Person ...
- Internet marketing - Concept map | Flowchart Marketing Process ...
- Marketing | How to Share Mind Maps via Internet | What is SWOT ...
- Internet marketing - Concept map | Marketing - Vector stencils library ...
- Network Layout Floor Plans | ConceptDraw Solution Park ...
- Column Chart Software | Column Chart Examples | How to Create a ...
- The Best Mac Software for Diagramming or Drawing | Design ...
- Venn diagram - Internet marketing professions | Internet Connectivity ...


