The 3D vertical bar graph sample shows the Iran internet users per 100 person from 2000 to 2011. It was designed on the base of the Commons Wikimedia file: Iran internet users per 100 person.png.
[commons.wikimedia.org/ wiki/ File:Iran_ internet_ users_ per_ 100_ person.png]
This file is licensed under the Creative Commons Attribution-Share Alike 3.0 Unported license. [creativecommons.org/ licenses/ by-sa/ 3.0/ deed.en]
The data source is World Bank: [data.worldbank.org/ country/ iran-islamic-republic]
"In 1993 Iran became the second country in the Middle East to be connected to the Internet, and since then the government has made significant efforts to improve the nation's ICT infrastructure. Iran's national Internet connectivity infrastructure is based on two major networks: the public switched telephone network (PSTN) and the public data network. The PSTN provides a connection for end-users to Internet service providers (ISPs) over mostly digital lines and supports modem-based connections. The Data Communication Company of Iran (DCI), a subsidiary of TCI, operates the public data network." [Internet in Iran. Wikipedia]
The 3D column chart example "Iran internet users per 100 person" was created using the ConceptDraw PRO diagramming and vector drawing software extended with the Bar Graphs solution from the Graphs and Charts area of ConceptDraw Solution Park.
3D Column chart

Column Chart Software

 Bar Graphs
The Bar Graphs solution enhances ConceptDraw DIAGRAM functionality with templates, numerous professional-looking samples, and a library of vector stencils for drawing different types of Bar Graphs, such as Simple Bar Graph, Double Bar Graph, Divided Bar Graph, Horizontal Bar Graph, Vertical Bar Graph, and Column Bar Chart.
Column Chart Template

Column Chart Examples

Chart Templates

Chart Examples

SWOT Matrix

Diagram of a Pyramid

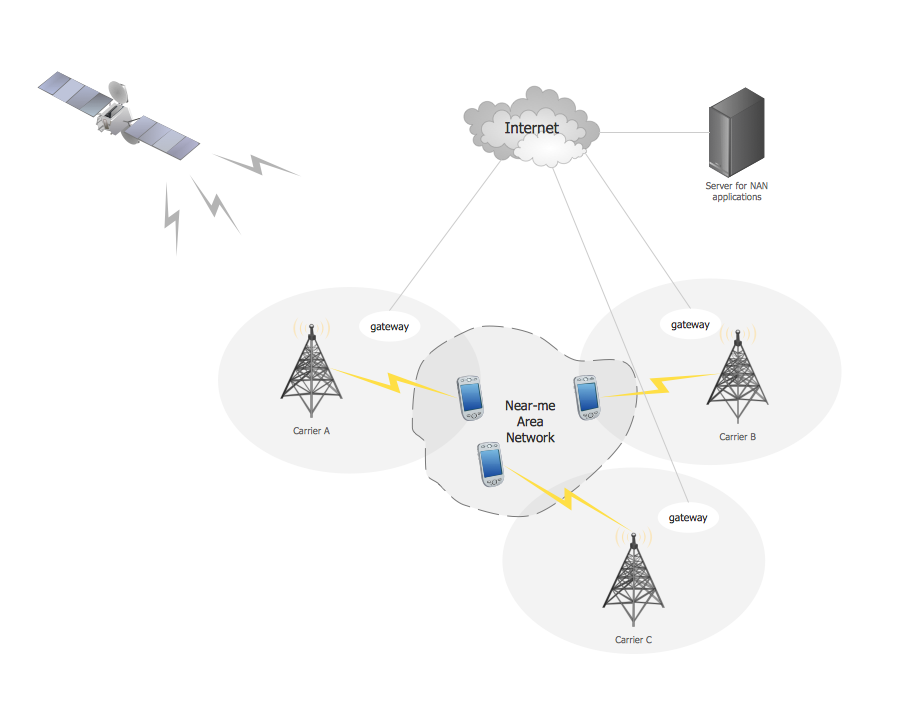
Near-me area networks (NAN). Computer and Network Examples

Flow Chart Design - How to Design a Good Flowchart

Flowcharting Software

Pyramid Chart Examples

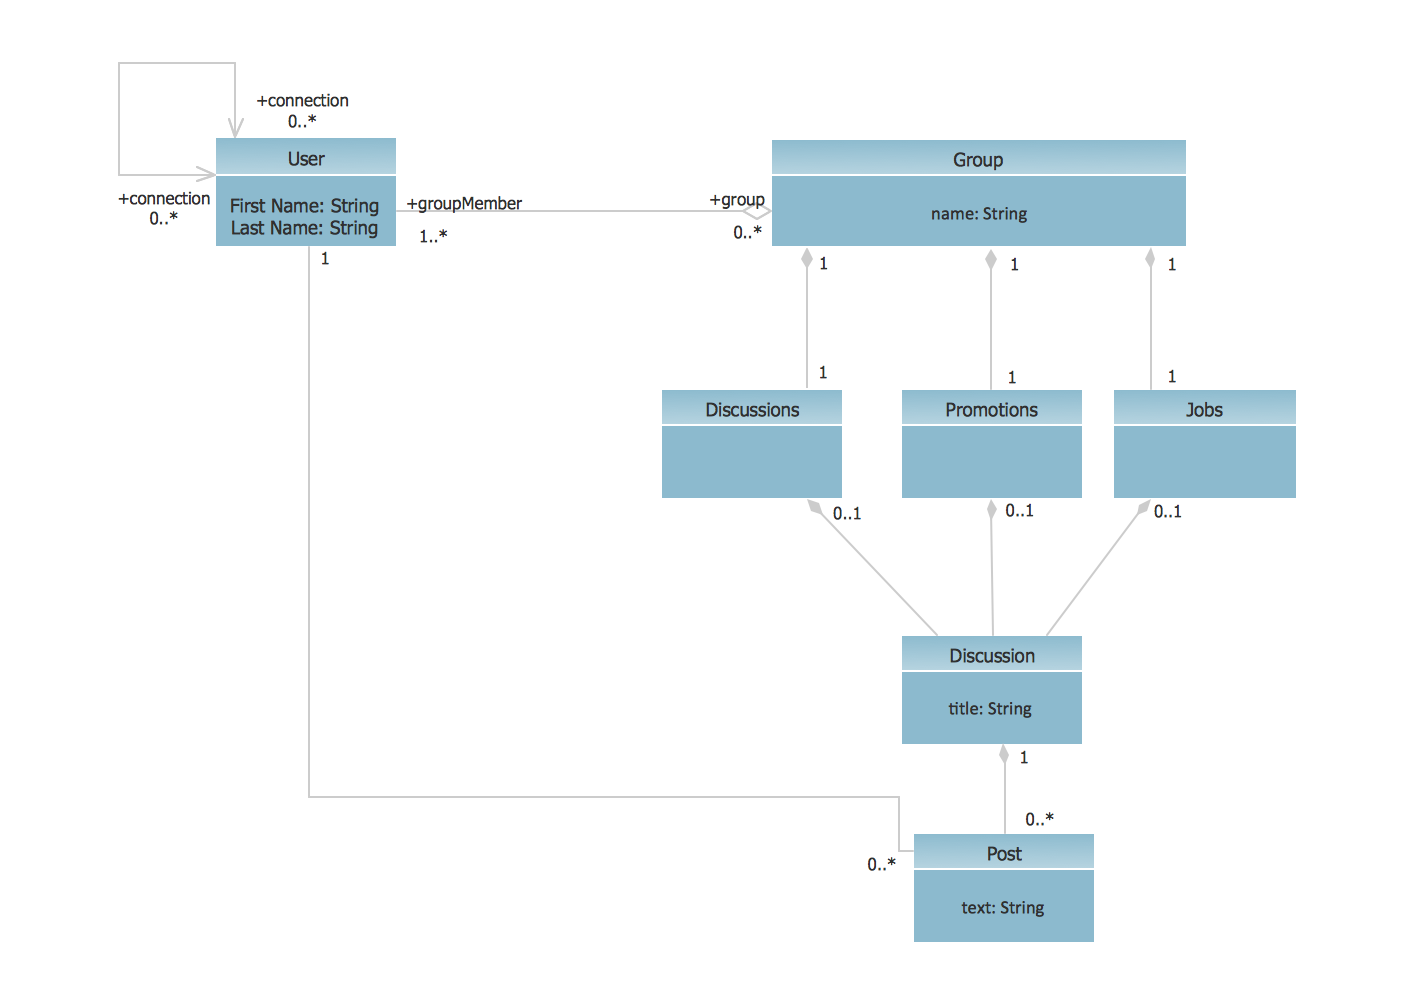
UML Class Diagram Example - Social Networking Site
- 3D Column chart - Iran internet users per 100 person | Column Chart ...
- Column Chart Examples | Column Chart Template | Column Chart ...
- How to Create a Bar Chart in ConceptDraw PRO | 3D Column chart ...
- 3D Column chart - Iran internet users per 100 person | Column Chart ...
- Bar Chart Software | Column Chart Software | Chart Maker for ...
- 3D Column chart - Iran internet users per 100 person | Person ...
- 3D Column chart - Iran internet users per 100 person | Providing ...
- 3D Column chart - Iran internet users per 100 person | Network ...
- Internet Connectivity. Computer and Network Examples | 3D Column ...
- 3D Column chart - Iran internet users per 100 person | Export from ...
- Waterfall Bar Chart | Process Flowchart | How to Create a Bar Chart ...
- Waterfall Bar Chart | How to Create a Bar Chart in ConceptDraw ...
- Bar Diagrams for Problem Solving. Create event management bar ...
- Internet Connectivity. Computer and Network Examples | Internet ...
- 3D Bar graph - Number of Members in the CNT between 1911 and ...
- Bar Chart Examples | Column Chart Examples | Sales Growth. Bar ...
- Internet Connectivity. Computer and Network Examples ...
- Column Chart Software | Bar Chart Software | Template For Double ...
- Column Chart Software | Bar Chart Software | Chart Maker for ...
- Column Chart Software | Laboratory equipment - Vector stencils ...