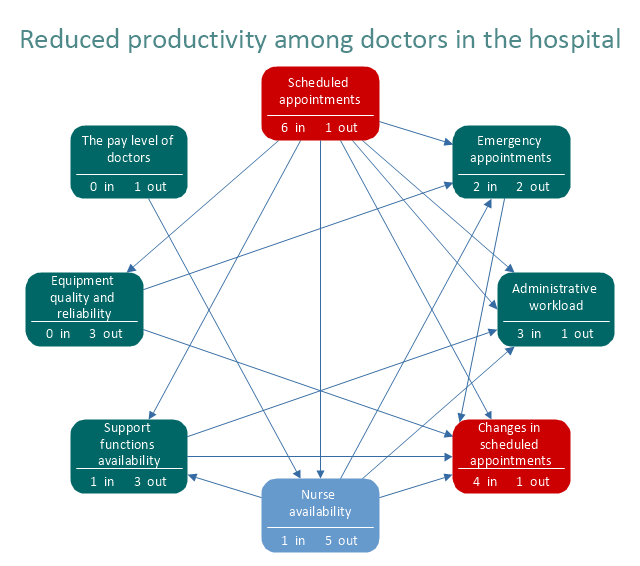
"Interrelationship Digraph (ID).
This tool displays all the interrelated cause-and-effect relationships and factors involved in a complex problem and describes desired outcomes. The process of creating an interrelationship digraph helps a group analyze the natural links between different aspects of a complex situation." [Seven Management and Planning Tools. Wikipedia]
"Causality (also referred to as causation) is the relation between an event (the cause) and a second event (the effect), where the second event is understood as a consequence of the first.
In common usage, causality is also the relation between a set of factors (causes) and a phenomenon (the effect). Anything that affects an effect is a factor of that effect. A direct factor is a factor that affects an effect directly, that is, without any intervening factors. (Intervening factors are sometimes called "intermediate factors".) The connection between a cause(s) and an effect in this way can also be referred to as a causal nexus.
Though the causes and effects are typically related to changes or events, candidates include objects, processes, properties, variables, facts, and states of affairs; characterizing the causal relation can be the subject of much debate." [Causality. Wikipedia]
The relations diagram example "Health care" was created using the ConceptDraw PRO diagramming and vector drawing software extended with the solution "Seven Management and Planning Tools" from the Management area of ConceptDraw Solution Park.
Cross-Functional Flowchart
Use of Cross-Functional Flowchart is a clear way of showing each team member’s responsibilities and how processes get shared or transferred between different responsible people, teams and departments. Use the best flowchart maker ConceptDraw PRO with a range of standardized cross-functional flowchart symbols to create the Cross-Functional Flowcharts simply and to visualize the relationship between a business process and the functional units responsible for that process. To draw the most quickly Cross-Functional Flowcharts, Cross Functional Process Maps, or Cross Functional Process Flow Diagrams, start with a Cross-functional flowchart samples and templates from ConceptDraw Solution Park. The ConceptDraw Arrows10 and RapidDraw technologies will be also useful for you in drawing. ConceptDraw PRO supports designing both types - horizontal and vertical Cross-functional flowcharts. A vertical layout makes the accents mainly on the functional units while a horizontal layout - on the process. If you need a Visio alternative in Mac OS X, try ConceptDraw PRO. Its interface is very intuitive and it’s actually much easier to use than Visio, yet somehow it’s just as powerful if not more so. ConceptDraw PRO performs professional quality work and seamless Visio interaction.
Chemical Engineering
ConceptDraw PRO is a powerful diagramming and vector drawing software. Extended with Chemical and Process Engineering Solution from the Industrial Engineering Area of ConceptDraw Solution Park, it became the best Chemical Engineering software.Physics Symbols
ConceptDraw PRO diagramming and vector drawing software extended with Physics solution from the Science and Education area is a powerful software for creating various physics diagrams. Physics solution provides all tools that you can need for physics diagrams designing. It includes 3 libraries with predesigned vector physics symbols: Optics Library, Mechanics Library and Nuclear Physics Library.- Inter Relationship Digraph Tool
- Interrelationship Wikipedia
- Interrelation Diagram Example
- Root cause analysis tree diagram - Sale problem solution | Root ...
- Decision tree diagram | Total Quality Management Business ...
- FTA diagram - Hazard analysis | Accident analytic tree - FTA ...
- Interrelationship Digraph Example
- PROBLEM ANALYSIS. Root Cause Analysis Tree Diagram ...
- Fault Tree Analysis Diagrams | PROBLEM ANALYSIS. Root Cause ...
- Decision tree diagram | Root cause analysis tree diagram - Personal ...
- Interrelationship Diagram
- Fishbone diagram - HAN project | Relations diagram - Health care ...
- Interrelationship Digraphs Example
- Root cause analysis tree diagram - Template
- Interrelationship Diagram Of Tool Management
- How to Create a Fault Tree Analysis Diagram (FTD) in ConceptDraw ...
- Fishbone Diagram Wiki
- Wiki Fishbone Diagram
- Fault Tree Diagram Software


