Introduction to bookkeeping: Accounting flowchart process
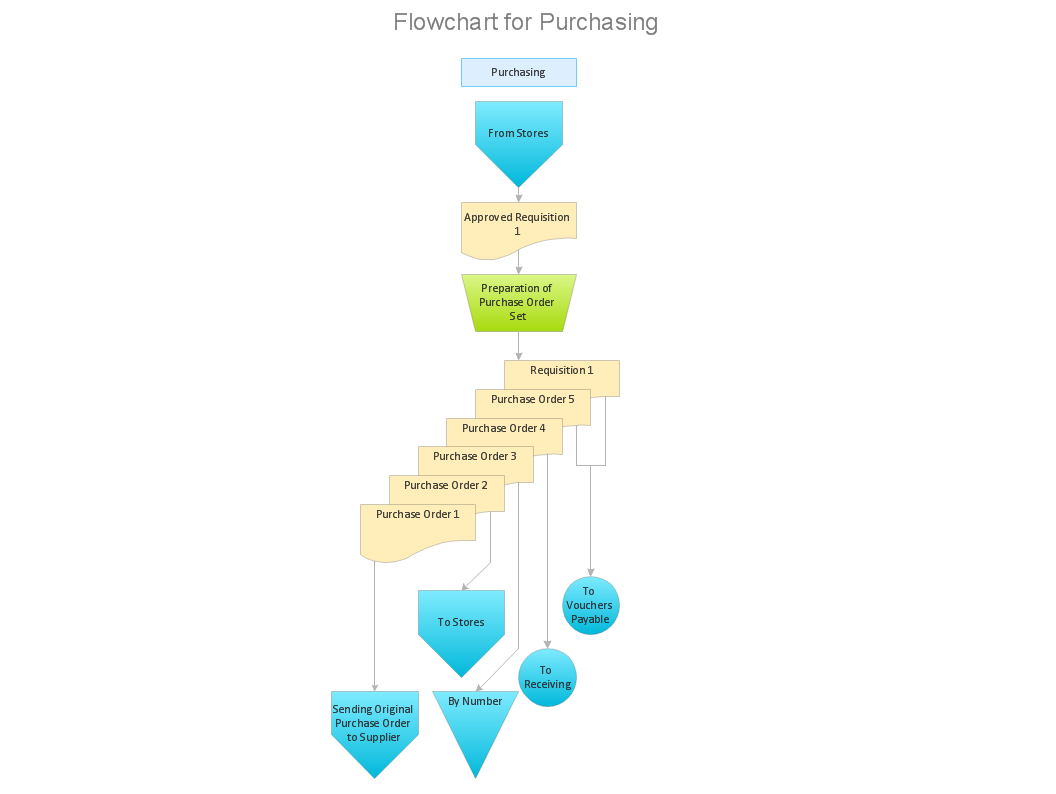
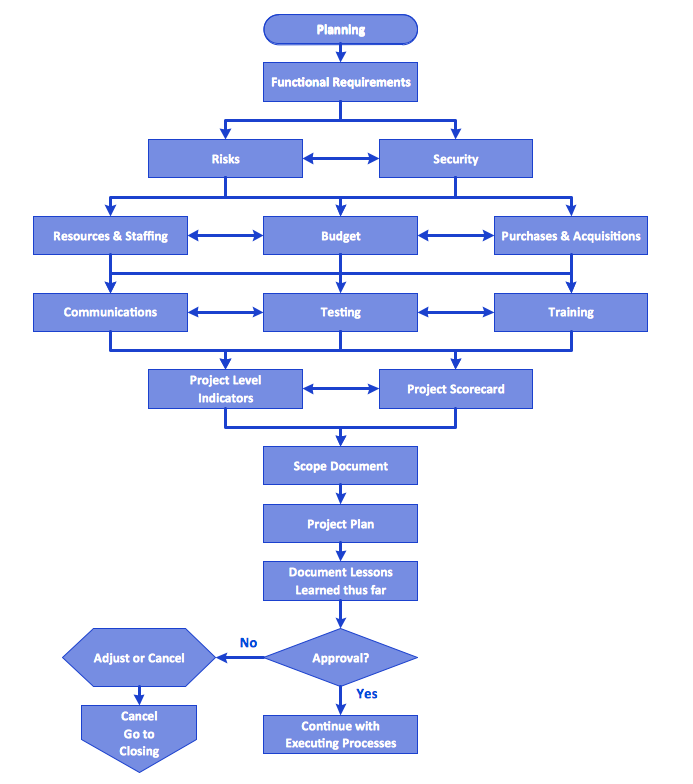
Everything about Bookkeeping: Accounting flowchart process. Which symbols to use, how to make a chart.Flowchart Process Example
ConceptDraw DIAGRAM is a professional software for creating great looking flowcharts. The samples included in this set of software allows users to draw any type of flowchart.Account Flowchart Stockbridge System. Flowchart Examples
Create your own flow charts of data processing systems using the ConceptDraw DIAGRAM diagramming and vector drawing software extended with the Cross-Functional Flowcharts solution from the Business Processes area of ConceptDraw Solution Park. This is a flowchart of a data processing system combining manual and computerized processing to handle accounts receivable, billing, and general ledger.Why flowchart is important to accounting information system?
Flowcharts are used to represent accounting information in a system. There are special symbols which are used to create accounting flowcharts."Product life cycle is a business analysis that attempts to identify a set of common stages in the life of commercial products. In other words the 'Product Life cycle' PLC is used to map the lifespan of the product such as the stages through which a product goes during its lifespan. ...
The stages of a product's life cycle... :
1. INTRODUCTION... 2. GROWTH... 3. MATURITY... 4. DECLINE...
The product life cycle is an important concept in marketing. It includes four stages that a product goes through from when it was first thought of until it is eliminated from the industry. Not all products reach this final stage. Some continue to grow and others rise and fall." [Product lifecycle. Wikipedia]
The flow chart example "Product life cycle process" was created using the ConceptDraw PRO diagramming and vector drawing software extended with the Flowcharts solution from the area "What is a Diagram" of ConceptDraw Solution Park.
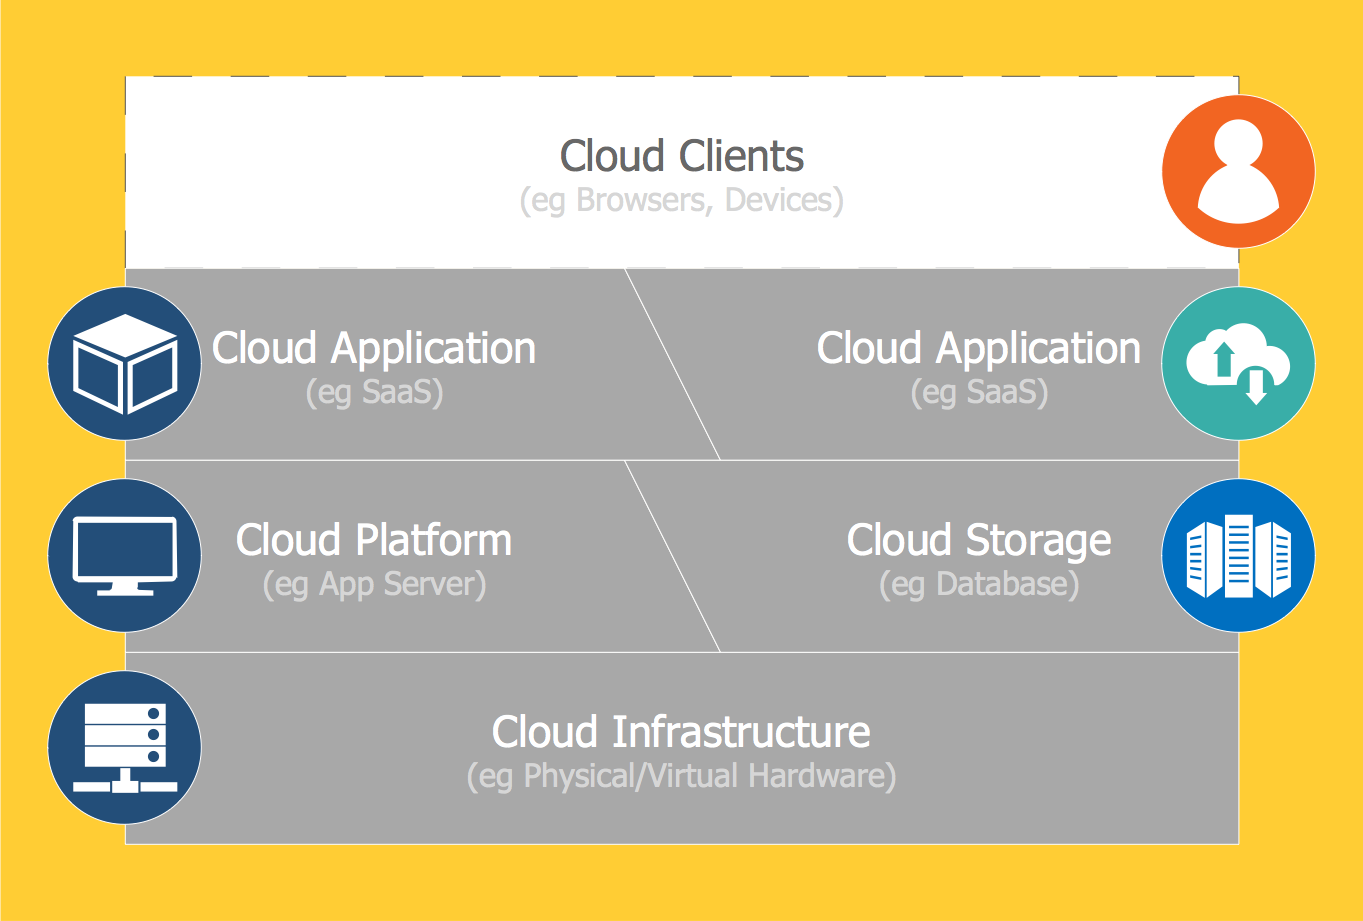
Introduction to Cloud Computing Architecture
The best way to visualize the introduction to Cloud computing architecture is to create diagrams and schematics representing what is a cloud computing and how it works. For their design, we recommend to use a powerful ConceptDraw DIAGRAM diagramming and vector drawing software supplied with Cloud Computing Diagrams solution from the Computers and Network area of ConceptDraw Solution ParkFlowchart Symbols Accounting. Activity-based costing (ABC) flowchart
The Accounting Flowcharts are helpful and popular kind of flowcharts in a field of business, finance and accounting. The ConceptDraw DIAGRAM diagramming software enhanced with Accounting Flowcharts solution from the Finance and Accounting area of ConceptDraw Solution Park is extremely comfortable for visually explaining the accounting processes and for designing Accounting Flowcharts and Accounting Process Flow Diagrams of any complexity. The library of vector design elements included to Accounting Flowcharts solution provides you with major accounting flowchart symbols, which make the drawing process incredibly easy and convenient. The use of them for designing of such sort of Accounting Flowcharts as the Activity-based costing (ABC) flowcharts will simplify the drawing process and will allow to make these flowcharts in a few minutes in ConceptDraw DIAGRAM. Design easily your own ABC flowcharts to demonstrate in details the relations and logics of activity-based distribution the costs between the company's units and departments.Data Flow Diagram Process
Data Flow Diagram (DFD) is a hierarchy of functional processes, connected by data flows. The purpose of this presentation is to show how each process converts its inputs into outputs and to identify relationships between these processes. DFD is convenient way of modeling and construction the information processes, it step-by-step illustrates the flow of information in a process. For construction a DFD traditionally are used two different notations, which appropriate to the methods of Yourdon-Coad and Gane-Sarson. These notations slightly different from each other by graphical representation of symbols for processes, data stores, data flow, external entities. When designing a DFD it is required to decompose the system into the components (sub-systems), for explaining a complex system you may need represent numerous levels. The Data Flow Diagrams solution from ConceptDraw Solution Park contains numerous predesigned DFD symbols for both notations, which help easy and effectively design professional-looking Data Flow Diagrams (DFDs) and DFD Process Diagrams.Use the Best FlowChart Tool for the Job
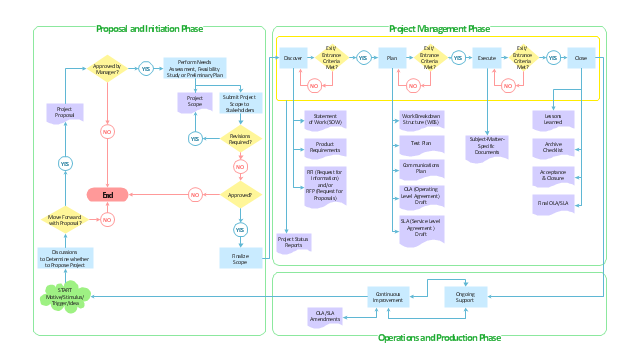
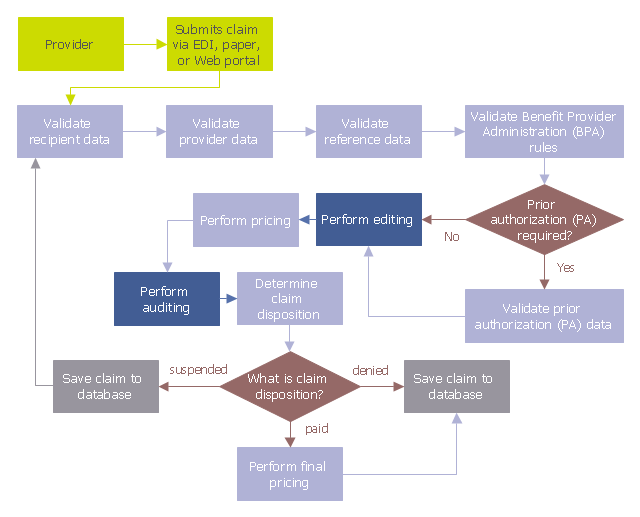
The ConceptDraw DIAGRAM is a best flow chart tool for the job. The samples and templates included in the basic set allows users to draw any type of a flowchart. The vector stencils created by designers give ability to draw great-looking flowchart. Flowcharts give to users the ability to represent structural data visually.This audit flowchart sample was created on the base of the figure illustrating the webpage "Introduction to Claims Edits, Audits, Error Status Codes, and EOBs" from the website of the Ohio Department of Medicaid.
"Process.
As claims are submitted and processed, the data on the claim is validated against a series of rules, edits, and audits. Review the flowchart below to follow the sequence in which claim data is processed to see where edits and audits impact the claim adjudication process." [medicaid.ohio.gov/ PROVIDERS/ MITS/ MITSNonProviderCommunications/ MITSOnlineTutorials/ IntroductiontoClaimsEdits,Audits.aspx]
The audit flowchart example "Claim data processing" was created using the ConceptDraw PRO diagramming and vector drawing software extended with the Audit Flowcharts solution from the Finance and Accounting area of ConceptDraw Solution Park.
www.conceptdraw.com/ solution-park/ finance-audit-flowcharts
Draw Flowcharts with ConceptDraw
Start design your own flowchart with ConceptDraw DIAGRAM and accomplish great results at the moment.Create Process Flowcharts
A process flowchart is a picture of the separate steps of a process in sequential order.Use ConceptDraw DIAGRAM software and the vector stencils from object libraries are designed objects you can use adding to process flowcharts for the best result.Looking at ConceptDraw MINDMAP as a Replacement for Mindjet Mindmanager
The comparing of ConceptDraw MINDMAP to Mindjet Mindmanager allows to identify a lot of benefits. At first, the ConceptDraw MINDMAP has a lower price, the flexible licensing, the license is per-named-user, no charge for major product upgrades and no charge for support. ConceptDraw MINDMAP is effective for launching the stalled projects to new heights, it possess the excellent possibility of importing and exporting to other mind mapping program file formats. ConceptDraw MINDMAP easily integrates with wide set of programs, among them Evernote, Skype, Twitter, Microsoft Word, Microsoft PowerPoint, Microsoft Project, Mindjet Mindmanager, ConceptDraw PROJECT, ConceptDraw DIAGRAM , with solutions from ConceptDraw Solution Park. Now you have a freedom to choose the best format for each your document, it is incredibly easy to make the Skype presentation, to take and share critical information, to send your Mind Map to Evernote, to import / export MS Word documents, MS PowerPoint presentations, the project data, open and save Mindmanager files, to map out the long-term Twitter messages and publish them to your Twitter account directly from a Mind Map.HelpDesk
How to Open MS Visio® 2013/2016 Files on a Mac®
Powerful business graphics and diagramming tools is the norm and not the exception for today’s businesses. For years the de facto standard file format for business has been Microsoft Visio™. Many people involved in visual communication need software tools that will read and write using the Visio file format. With the introduction of Visio 2013, Microsoft has changed the native file format used in earlier versions of Microsoft Visio. ConceptDraw DIAGRAM v12 file import and export works round-trip with the new Visio VSDX file format.HelpDesk
How to Convert MS Visio® 2003-2010 File to ConceptDraw DIAGRAM
ConceptDraw DIAGRAM is such a viable alternative for individuals and organizations that are looking for a professional business solution. ConceptDraw DIAGRAM file import and export works roundtrip with the Visio 2010-2013 file formats. With the introduction of Visio 2013 Microsoft has changed the native binary file format used in earlier versions of Microsoft Visio. ConceptDraw DIAGRAM file import and export works with the new Visio VSDX file format and at the same time supports the improved import of VDX file format. To Import Visio vsd files to ConceptDraw follow the steps described in this article.- Introduction to bookkeeping: Accounting flowchart process ...
- Introduction to bookkeeping: Accounting flowchart process | HR ...
- Introduction to bookkeeping: Accounting flowchart process | Audit ...
- Introduction to bookkeeping: Accounting flowchart process | How to ...
- Introduction to bookkeeping: Accounting flowchart process | Steps of ...
- Pyramid Diagram | Purchase funnel diagram | Introduction to ...
- Workflow to Make a Purchase. Accounting Flowchart Example ...
- Introduction to bookkeeping: Accounting flowchart process ...
- Introduction to bookkeeping: Accounting flowchart process | Steps of ...
- Introduction to bookkeeping: Accounting flowchart process | Banquet ...
- Purchase Process Flow Chart , Receiving Process Flow Chart
- Introduction to bookkeeping: Accounting flowchart process ...
- Why Flowchart Important to Accounting Information System ...
- Block Diagram | Introduction to Cloud Computing Architecture | SDL ...
- Introduction to bookkeeping: Accounting flowchart process | What ...
- Office Layout Plans | Use the Best FlowChart Tool for the Job ...
- Computer Network Diagrams | Examples of Flowcharts , Org Charts ...
- Product life cycle process - Flowchart | Use the Best FlowChart Tool ...
- Introduction to Cloud Computing Architecture | Office Layout Plans ...
- Sales Process Flowchart . Flowchart Examples | Simple Flow Chart ...
