"In elementary algebra, a quadratic equation (from the Latin quadratus for "square") is any equation having the form
ax^2+bx+c=0
where x represents an unknown, and a, b, and c are constants with a not equal to 0. If a = 0, then the equation is linear, not quadratic. The constants a, b, and c are called, respectively, the quadratic coefficient, the linear coefficient and the constant or free term.
Because the quadratic equation involves only one unknown, it is called "univariate". The quadratic equation only contains powers of x that are non-negative integers, and therefore it is a polynomial equation, and in particular it is a second degree polynomial equation since the greatest power is two.
Quadratic equations can be solved by a process known in American English as factoring and in other varieties of English as factorising, by completing the square, by using the quadratic formula, or by graphing." [Quadratic equation. Wikipedia]
The flowchart example "Solving quadratic equation algorithm" was created using the ConceptDraw PRO diagramming and vector drawing software extended with the Mathematics solution from the Science and Education area of ConceptDraw Solution Park.
The vector stencils library "Sales flowchart" contains 62 sales process flow chart symbols.
Use these flow chart icon set to draw your sales flowcharts, workflow diagrams and process charts with the ConceptDraw PRO diagramming and vector drawing software.
The sales process flowchart symbols library "Sales flowchart" is included in the Sales Flowcharts solution from the Marketing area of ConceptDraw Solution Park.
 Sales Flowcharts
The Sales Flowcharts solution lets you create and display sales process maps, sales process workflows, sales steps, the sales process, and anything else involving sales process management.
The vector stencils library "HR flowchart" contains 62 flowchart symbols.
Use it to draw your HR flowcharts, workflow diagrams and process charts with the ConceptDraw PRO diagramming and vector drawing software.
The flow chart symbols library "HR flowchart" is included in the HR Flowcharts solution from the Management area of ConceptDraw Solution Park.
Use it to draw your HR flowcharts, workflow diagrams and process charts with the ConceptDraw PRO diagramming and vector drawing software.
The flow chart symbols library "HR flowchart" is included in the HR Flowcharts solution from the Management area of ConceptDraw Solution Park.
HelpDesk
How to Create a Timeline Diagram in ConceptDraw PRO
A Timeline is a chart which displays a project plan schedule in chronological order. A Timeline is used in project management to depict project milestones and visualize project phases, and show project progress. The graphic form of a timeline makes it easy to understand critical project milestones, such as the progress of a project schedule. Timelines are particularly useful for project scheduling or project management when accompanied with a Gantt chart. It captures the main of what the project will accomplish and how it will be done. making a project timeline is one of the most important skills a project manager needs have. Making comprehensive, accurate timelines allows you getting every project off in the best way. ConceptDraw PRO allows you to draw a timeline charts using special library.The vector stencils library "Sales flowchart" contains 62 sales process flow chart symbols.
Use these flow chart icon set to draw your sales flowcharts, workflow diagrams and process charts with the ConceptDraw PRO diagramming and vector drawing software.
The sales process flowchart symbols library "Sales flowchart" is included in the Sales Flowcharts solution from the Marketing area of ConceptDraw Solution Park.
HelpDesk
How to Create SWOT Analysis Template Using ConceptDraw PRO
SWOT-analysis is used to develop a marketing strategy. SWOT-analysis includes determining the strengths and weaknesses in the company's activity, potential external threats and opportunities and assesses their relative strategic competitors. ConceptDraw SWOT and TOWS Matrix Diagrams solution provide a set of SWOT matrix in which should be recorded and then compared the strengths and weaknesses of the enterprise and the market opportunities and threats. This comparison allows you to determine what steps can be taken for the development of your company and what problems need to be addressed urgently.HelpDesk
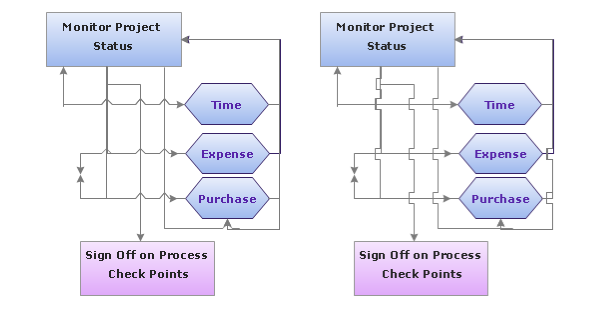
How to Set Line Jumps for Smart Connectors in ConceptDraw PRO
Connecting objects in ConceptDraw PRO is an easy task. You can use Chain, or Tree connection mode for automatic connection of multiple objects. Besides the automatic connection modes, ConceptDraw PRO offers few options to connect objects manually: Direct, Arc, Bezier, Smart, Curve and Round Connectors. You can make them square, arched or angled and also set vertical or horizontal orientation Thus, you can control how the jumps and orientation occurs on smart connectors. When two smart connectors cross each other you can control how the two intersecting lines look.Garrett IA Diagrams with ConceptDraw PRO
Garrett IA diagrams are used at development of Internet-resources, in particulars at projecting of interactions of web-resource elements. The diagram of information architecture of the web resource which is constructed correctly with necessary details presents to developers the resource in comprehensible and visual way.HelpDesk
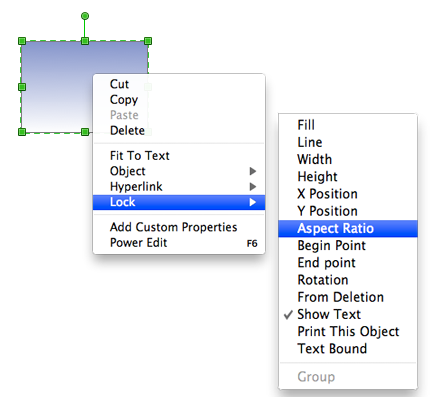
How to Resize Objects Disproportionately in ConceptDraw PRO
ConceptDraw PRO gives you possibility to freely move, re-size, and rotate objects. You can make them proportionally larger or smaller, as well as re-size objects to make them longer or shorter in only one direction.HelpDesk
How to Draw a Pyramid Diagram in ConceptDraw PRO
Pyramid diagram (triangle diagram) is used to represent data, which have hierarchy and basics. Due to the triangular form of diagram, each pyramid section has a different width. The width of the segment shows the level of its hierarchy. Typically, the top of the pyramid is the data that are more important than the base data. Pyramid scheme can be used to show proportional and hierarchical relationships between some logically related items, such as departments within an organization, or successive elements of any process. This type of diagram is often used in marketing to display hierarchical related data, but it can be used in a variety of situations. ConceptDraw PRO allows you to make a pyramid diagram, quickly and easily using special libraries.- Area Of Square Flowchart
- When To Use Parallelogram And Square In Flowchart
- Flow Chart Of The Area Of Square
- Solving quadratic equation algorithm - Flowchart | Types of ...
- In Process Flow Chart A Square Describes
- Square Page Flowchart
- Basic Flowchart Symbols and Meaning | Square Box White Inside ...
- Basic Flowchart Symbols and Meaning | Types of Flowcharts ...
- Flowchart For Area Of Square
- Solving quadratic equation algorithm - Flowchart | To Find Square ...
- Solving quadratic equation algorithm - Flowchart | Mathematics ...
- Pyramid Diagram | Sales Flowcharts | HR Management Software ...
- Euclidean algorithm - Flowchart | Solving quadratic equation ...
- Basic Flowchart Symbols and Meaning | Process Flow Chart Symbol ...
- Polygon types | Common joint types | Basic Flowchart Symbols and ...
- Solving quadratic equation algorithm - Flowchart | Process ...
- Arrows - Vector clipart library | Sales Process Flowcharts | Sales ...
- Solving quadratic equation algorithm - Flowchart | Basic Flowchart ...
- Solid geometry - Vector stencils library | Flowchart design. Flowchart ...
- Basic Flowchart Symbols and Meaning | DFD Library - Design ...


-sales-flowchart---vector-stencils-library.png--diagram-flowchart-example.png)
-sales-flowchart---vector-stencils-library.png--diagram-flowchart-example.png)

-sales-flowchart---vector-stencils-library.png--diagram-flowchart-example.png)

-sales-flowchart---vector-stencils-library.png--diagram-flowchart-example.png)
-sales-flowchart---vector-stencils-library.png--diagram-flowchart-example.png)

-sales-flowchart---vector-stencils-library.png--diagram-flowchart-example.png)






-sales-flowchart---vector-stencils-library.png--diagram-flowchart-example.png)

-sales-flowchart---vector-stencils-library.png--diagram-flowchart-example.png)



















-sales-flowchart---vector-stencils-library.png--diagram-flowchart-example.png)
-sales-flowchart---vector-stencils-library.png--diagram-flowchart-example.png)







-hr-flowchart---vector-stencils-library.png--diagram-flowchart-example.png)
-hr-flowchart---vector-stencils-library.png--diagram-flowchart-example.png)

-hr-flowchart---vector-stencils-library.png--diagram-flowchart-example.png)

-hr-flowchart---vector-stencils-library.png--diagram-flowchart-example.png)
-hr-flowchart---vector-stencils-library.png--diagram-flowchart-example.png)

-hr-flowchart---vector-stencils-library.png--diagram-flowchart-example.png)






-hr-flowchart---vector-stencils-library.png--diagram-flowchart-example.png)

-hr-flowchart---vector-stencils-library.png--diagram-flowchart-example.png)





















-hr-flowchart---vector-stencils-library.png--diagram-flowchart-example.png)
-hr-flowchart---vector-stencils-library.png--diagram-flowchart-example.png)


