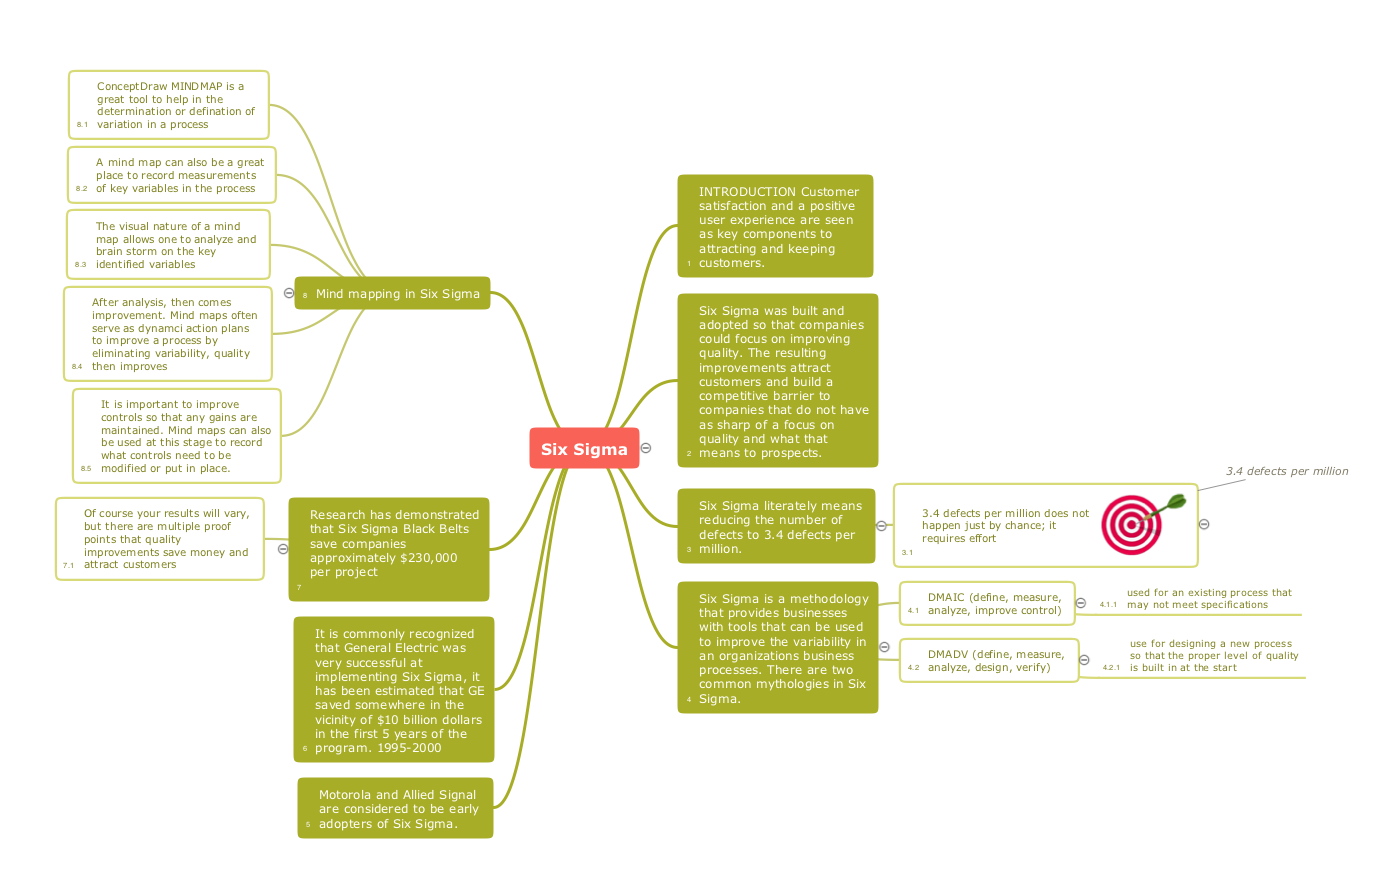
Constant improvement of key performance indicators
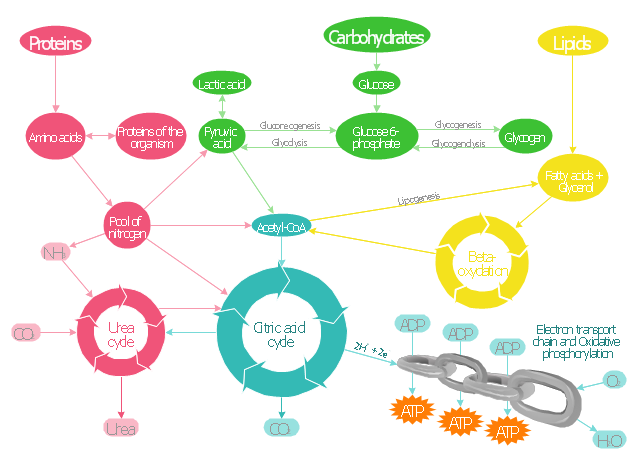
There are available tool to lend a fresh look to quality procedures - ConceptDraw MINDMAP."Metabolism is refer to all chemical reactions that occur in living organisms, including digestion and the transport of substances into and between different cells. Metabolism is usually divided into catabolism, that breaks down organic matter and harvests energy by way of cellular respiration, and anabolism that uses energy to construct components of cells such as proteins and nucleic acids.
The chemical reactions of metabolism are organized into metabolic pathways, in which one chemical is transformed through a series of steps into another chemical, by a sequence of enzymes." [Metabolism. Wikipedia]
The biochemical pathway map example "Key metabolic processes" was created using the ConceptDraw PRO diagramming and vector drawing software extended with the Biology solution from the Science and Education area of ConceptDraw Solution Park.
Sales Dashboard - insight about potential opportunities and key sales operations
ConceptDraw Sales Dashboard gives you a clear insight about potential opportunities and key sales operations. Analysing sales KPI is a proven way to see how your business can improve.Remote Learning Sessions - Webinars
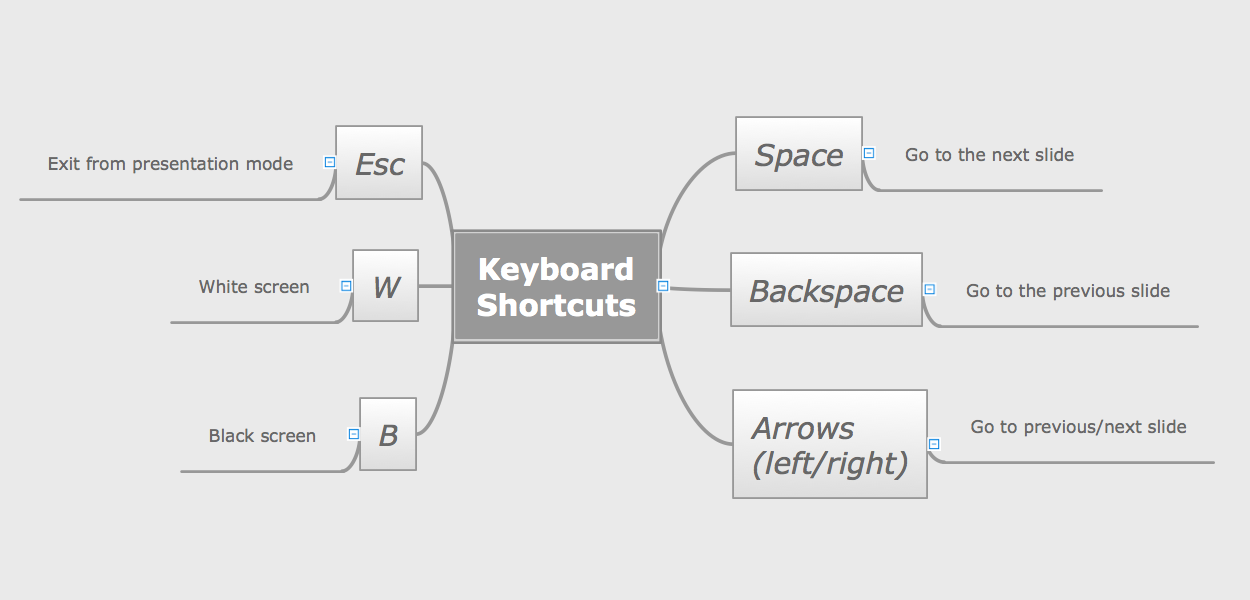
A perfect visual tool for presenting to a remote group via Skype. Participants receives document automatically. Participants are able to edit presentation after session. Helpful for webinars, online meetings, remote learning.
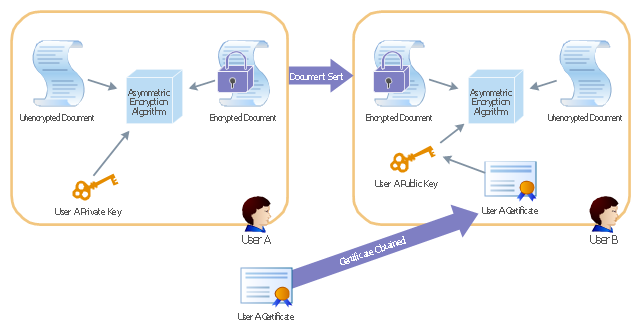
This AD diagram example was redesigned from the picture "Asymmetric
encryption" from the book "Active Directory for Dummies".
"Asymmetric Encryption:
This scenario uses a public and private key pair that is associated with each other. With this type of encryption, one of the keys is used to encrypt the data in such a way that only the corresponding second key is capable of decrypting the information. ...
In asymmetric encryption, two different keys are involved in the process: one for encrypting the document and a different but related key for decrypting the document. The two keys are generated at the same time so that if a document is encrypted with one of the keys, only the second related key can decrypt the document. ... Typically, these keys are referred to as a private key and a public key. A private key is one that is generated for a particular user and is never shared with any other user or computer. A public key is typically one of the pieces of data that’s stored in a PKI certificate. Although this type of encryption creates a very secure way of sharing data, an added benefit is you knowing that a piece of data decrypted by using a particular user’s public key must have come from that user because no other user would have the private key the document was encrypted with."
[Steve Clines and Marcia Loughry, Active Directory® For Dummies®, 2nd Edition. 2008]
The Active Directory diagram example "Asymmetric encryption" was created using the ConceptDraw PRO diagramming and vector drawing software extended with the Active Directory Diagrams solution from the Computer and Networks area of ConceptDraw Solution Park.
IDEF1X Standard
Use Case Diagrams technology. IDEF1x standard - for work with relational data bases. IDEF1x standard is meant for constructing of conceptual schemes which represent the structure of data in the context of the concerned system, for example, a commercial organization."Chen's notation for entity–relationship modeling uses rectangles to represent entity sets, and diamonds to represent relationships appropriate for first-class objects: they can have attributes and relationships of their own. If an entity set participates in a relationship set, they are connected with a line.
Attributes are drawn as ovals and are connected with a line to exactly one entity or relationship set.
Cardinality constraints are expressed as follows:
- a double line indicates a participation constraint, totality or surjectivity: all entities in the entity set must participate in at least one relationship in the relationship set;
- an arrow from entity set to relationship set indicates a key constraint, i.e. injectivity: each entity of the entity set can participate in at most one relationship in the relationship set;
- a thick line indicates both, i.e. bijectivity: each entity in the entity set is involved in exactly one relationship.
- an underlined name of an attribute indicates that it is a key: two different entities or relationships with this attribute always have different values for this attribute.
Attributes are often omitted as they can clutter up a diagram; other diagram techniques often list entity attributes within the rectangles drawn for entity sets." [Entity–relationship model. Wikipedia]
The vector stencils library ERD, Chen's notation contains 13 symbols for drawing entity-relatinship diagrams using the ConceptDraw PRO diagramming and vector drawing software.
The example "Design elements - ER diagram (Chen notation)" is included in the Entity-Relationship Diagram (ERD) solution from the Software Development area of ConceptDraw Solution Park.
HelpDesk
How to Activate ConceptDraw After Purchasing from the Web Store
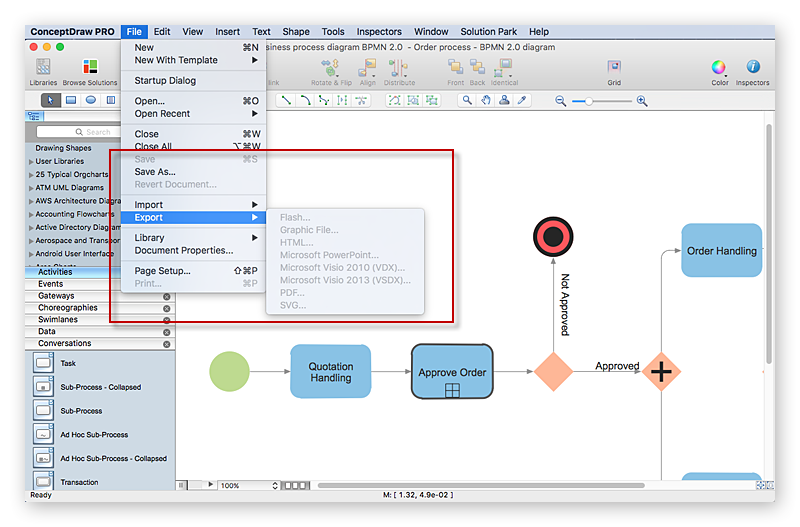
Instructions on how to activate ConceptDraw products using ConceptDraw Solution Browser
 PM Dashboards
This solution extends ConceptDraw PRO and ConceptDraw PROJECT software with the ability to clearly display the identified key performance indicators for any project.
Databases Access Objects Model with ConceptDraw PRO
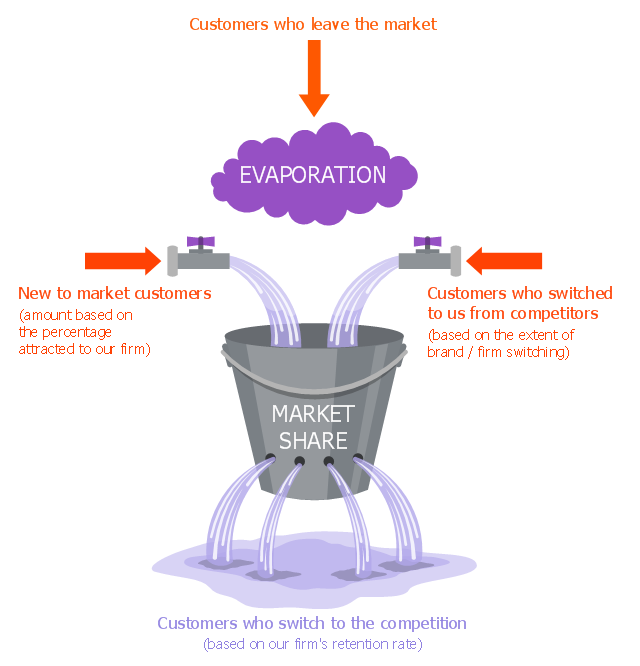
ConceptDraw Basic gives the opportunity of interaction with any ODBC-compatible databases. For this the Database Access Objects Model is provided. All calls to the database are made by certain methods of objects of this model."The leaky bucket theory The leaky bucket theory is the model that seeks to describe the process of customer gain and loss, otherwise known as customer churn . Customer retention is one of the key concepts in relationship marketing. Most companies concentrate on recruiting new customers to replace customers who move on, rather than seeking to retain customers." [Blythe J. Key Concepts in Marketing. 2009. knowledge.sagepub.com/ view/ key-concepts-in-marketing/ n5.xml]
"Customer attrition, also known as customer churn, customer turnover, or customer defection, is the loss of clients or customers.
Banks, telephone service companies, Internet service providers, pay TV companies, insurance firms, and alarm monitoring services, often use customer attrition analysis and customer attrition rates as one of their key business metrics (along with cash flow, EBITDA, etc.) because the "...cost of retaining an existing customer is far less than acquiring a new one." Companies from these sectors often have customer service branches which attempt to win back defecting clients, because recovered long-term customers can be worth much more to a company than newly recruited clients." [Customer attrition. Wikipedia]
The example "Leaky bucket diagram" was created using the ConceptDraw PRO diagramming and vector drawing software extended with the Marketing Diagrams solution from the Marketing area of ConceptDraw Solution Park.
HelpDesk
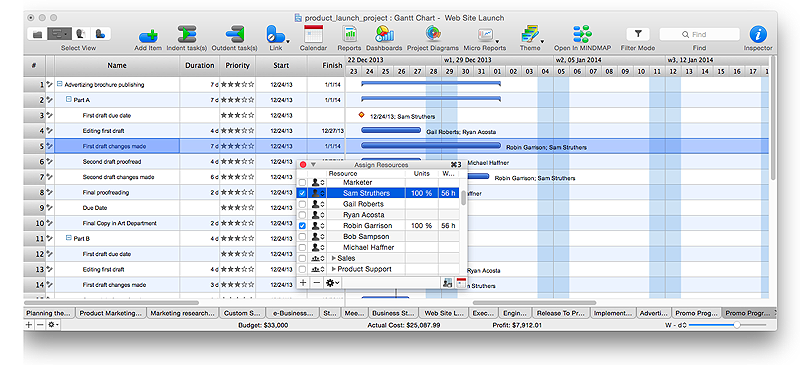
How to Plan and Allocate Resources in Your Project on Mac
CoceptDraw PROJECT provides easy ways to project Resources Management: Create a list of project resources and assign the right people to tasks, as well as the necessary materials to be used.DES Network. Computer and Network Examples
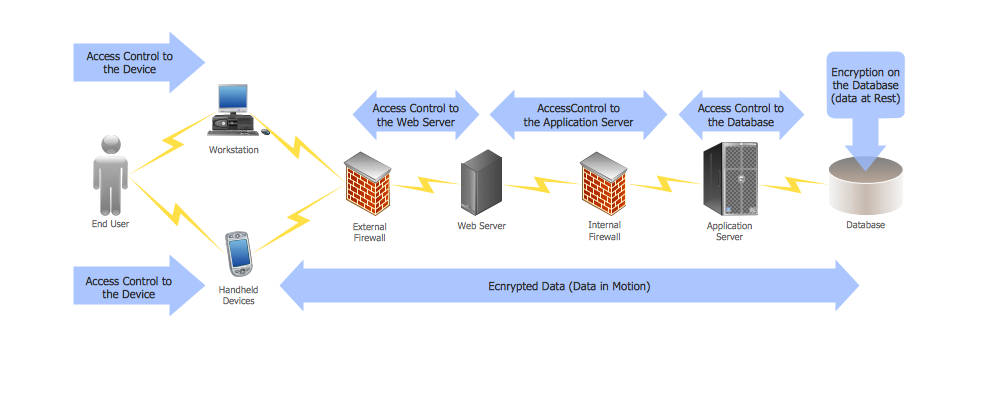
29095The Data Encryption Standard (DES) is a symmetric-key algorithm for the encryption of the electronic data.This diagram was created in ConceptDraw PRO using the Computer and Networks Area of ConceptDraw Solution Park and shows how the encryption and access control work together to secure data.

HelpDesk
ConceptDraw Software Full Versions Free Download
ConceptDraw software provides registered users a 21 day trial period at no charge. It functions exactly as a fully licensed copy of the product does. Once you have activated your account you are then able to download and install ConceptDraw software as well, as solutions from Solution Park. Here is an instructions on how to download and try ConceptDraw products for free. For 21 days the trial functions exactly like the purchased product. There are no limitations to file size, how many times you can print, or any of the products functionality. After the trial period expires, you will be able to open ConceptDraw documents to view.This financila dashboard example was drawn on the base of the Enterprise dashboard from the Mecklenburg County Government website.
[charmeck.org/ mecklenburg/ county/ CountyManagersOffice/ OMB/ dashboards/ Pages/ Enterprise.aspx]
"In management information systems, a dashboard is "an easy to read, often single page, real-time user interface, showing a graphical presentation of the current status (snapshot) and historical trends of an organization’s key performance indicators to enable instantaneous and informed decisions to be made at a glance."
For example, a manufacturing dashboard may show key performance indicators related to productivity such as number of parts manufactured, or number of failed quality inspections per hour. Similarly, a human resources dashboard may show KPIs related to staff recruitment, retention and composition, for example number of open positions, or average days or cost per recruitment.
Types of dashboards.
Dashboard of Sustainability screen shot illustrating example dashboard layout.
Digital dashboards may be laid out to track the flows inherent in the business processes that they monitor. Graphically, users may see the high-level processes and then drill down into low level data. This level of detail is often buried deep within the corporate enterprise and otherwise unavailable to the senior executives.
Three main types of digital dashboard dominate the market today: stand alone software applications, web-browser based applications, and desktop applications also known as desktop widgets. The last are driven by a widget engine.
Specialized dashboards may track all corporate functions. Examples include human resources, recruiting, sales, operations, security, information technology, project management, customer relationship management and many more departmental dashboards.
Digital dashboard projects involve business units as the driver and the information technology department as the enabler. The success of digital dashboard projects often depends on the metrics that were chosen for monitoring. Key performance indicators, balanced scorecards, and sales performance figures are some of the content appropriate on business dashboards." [Dashboard (management information systems). Wikipedia]
The example "Enterprise dashboard" was created using the ConceptDraw PRO diagramming and vector drawing software extended with the Composition Dashboard solution from the area "What is a Dashboard" of ConceptDraw Solution Park.
"Business process improvement (BPI) is a systematic approach to help an organization optimize its underlying processes to achieve more efficient results. ...
An organization is only as good as its processes. To be able to make the necessary changes in an organization, one needs to understand the key processes of the company. Rummler and Brache suggested a model for running a Process Improvement and Management project (PI&M), containing the following steps:
1. Identify the process to be improved (based on a critical business issue): The identification of key processes can be a formal or informal exercise. The management team might select processes by applying a set of criteria derived from strategic and tactical priorities, or process selection is based on obvious performance gaps. It is important is to select the process(es) which have the greatest impact on a competitive advantage or customer requirement.
2. Develop the objective(s) for the project based on the requirements of the process: The focus might be on quality improvement, productivity, cost, customer service or cycle time. The goal is however always the same; to get the key process under control.
3. Select the members of the cross-functional team: A horizontal (cross-functional) analysis is carried out by a team composed of representatives of all functions involved in the process. While a consultant or in-house staff person can do the job, the quality of the analysis and the commitment to change is far greater with a cross-functional team.
4. Document the current process by creating a flowchart or "organization map": Describe the process regarding the Organizational level, the Process level and the Job/ Performer level according to Rummler. Develop a cross-functional process map for the process.
5. Identify "disconnects" in the process: “Disconnections” are everything that inhibit the efficiency and effectiveness of the process. The identification should be categorized into the three levels: The Organizational level, the Process level and the Job/ Performer level.
6. Recommend changes (organizational, in the process or in its execution): Categorize and prioritize the main problems and possibilities, evaluate alternative solutions. Develop a cross-functional process map for the recommended process.
7. Establish process and sub-process measures: The process measures should reflect the objectives of the project.
8. Implement the improvements." [Business process improvement. Wikipedia]
The opportunity flow chart example "Replacing engine oil" was created using the ConceptDraw PRO diagramming and vector drawing software extended with the Cross-Functional Flowcharts solution from the Business Processes area of ConceptDraw Solution Park.
Program Structure Diagram
Program Structure Diagram - The Software Development solution from ConceptDraw Solution Park provides the stensils libraries of language level shapes and memory objects for drawing the structural diagrams of programs and memory objects using the ConceptDraw PRO diagramming and vector drawing software.How To Use Collaboration Software
Collaboration Software helps to transform shared MINDMAP documents to build an effective team collaboration.
- Constant improvement of key performance indicators | TQM Diagram ...
- Constant improvement of key performance indicators | What is a ...
- Relations diagram template | Constant improvement of key ...
- Constant improvement of key performance indicators | A KPI ...
- Biochemical pathway map - Key metabolic processes |
- Design elements - Meter indicators 2 | Constant improvement of key ...
- A KPI Dashboard | Constant improvement of key performance ...
- Biochemical pathway map - Key metabolic processes | Glucose ...
- Constant improvement of key performance indicators | Quality Mind ...
- Biochemical pathway map - Key metabolic processes | Design ...
- Key metabolic processes - Biochemical pathway map | Metabolic ...
- Design elements - Composition charts and indicators | Constant ...
- Biochemical pathway map - Key metabolic ... - Conceptdraw.com
- Quality Mind Maps - samples and templates | Quality Improvement ...
- Biochemical pathway map - Key metabolic processes | Catabolism ...
- Key metabolic processes - Biochemical pathway map | Biology ...
- Design elements - Biochemistry of metabolism | Biochemical ...
- Biochemical metabolic pathway map diagram | Biochemical ...
- Biochemical metabolic pathway map diagram | Business Diagram ...
- Meter Dashboard | Sales Dashboard - insight about potential ...


.png--diagram-flowchart-example.png)
