Landscape Architecture with ConceptDraw PRO
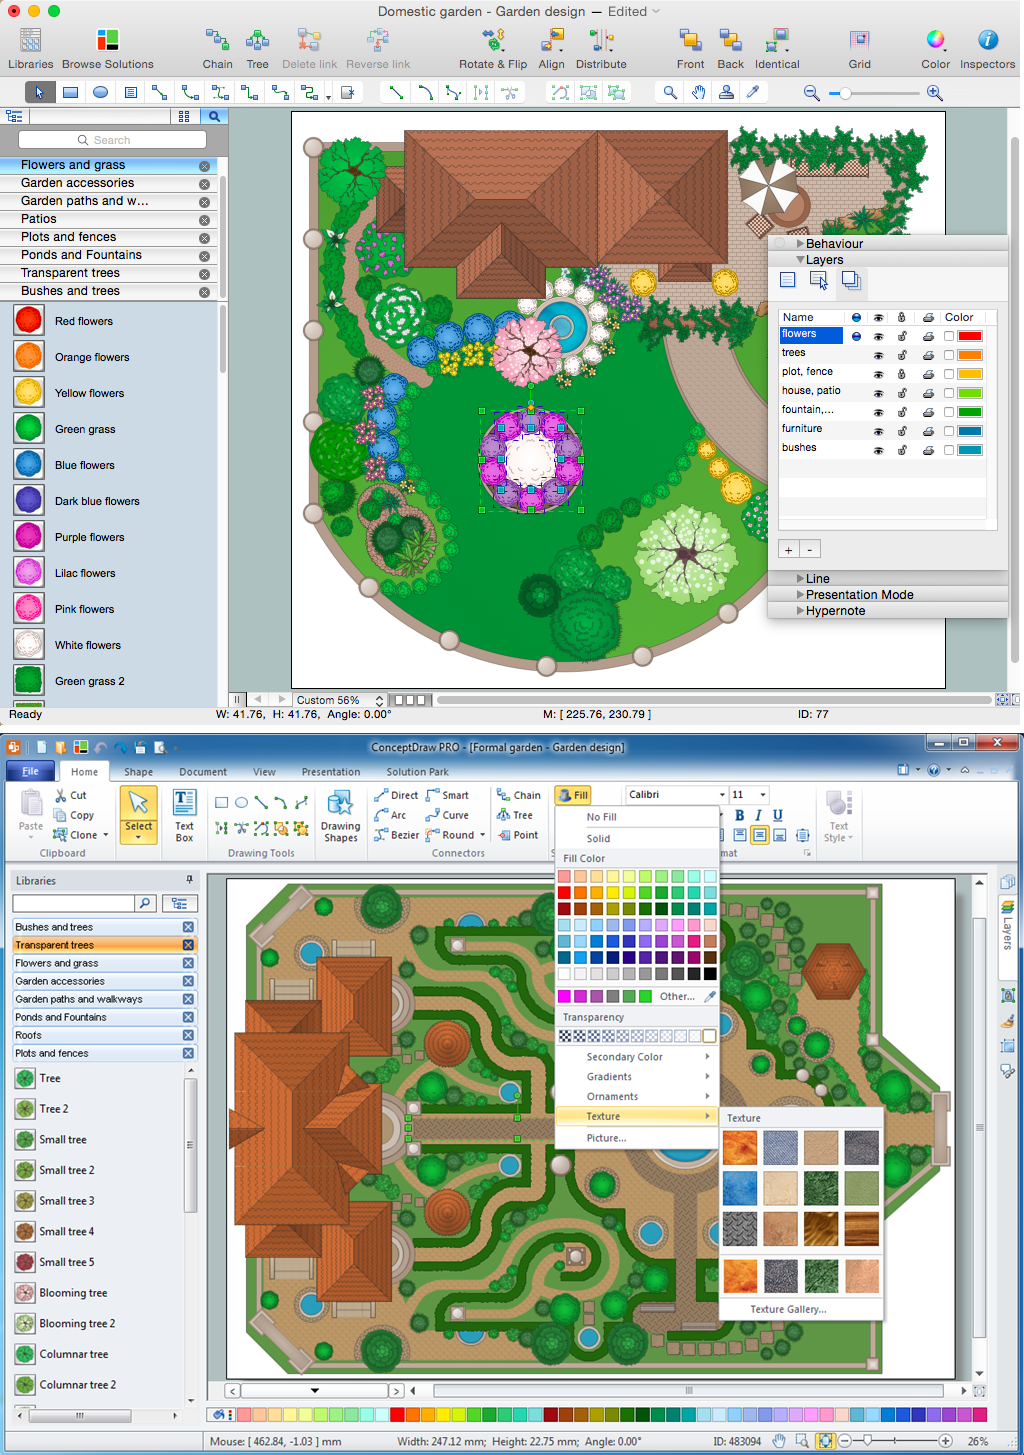
The landscape architecture includes landscape design, planning, and realization, as well as management of resources and buildings. The smaller scale landscape projects are well known as landscape design and garden design. The landscape design documentation is created independently from the project's scale and includes sketches, general plan and working documentation. On this stage the ConceptDraw PRO software extended with Landscape & Garden solution is irreplaceable assistant for you. The landscape designs created using ConceptDraw PRO are effectively used by landscape architects and engineers, also by landscape managers who maintain parks, gardens, natural landscapes like woodlands or nature reserves, and artificial landscapes. The Landscape and Garden solution contains 14 libraries with a lot of vector graphics objects of trees, flowers, bushes, fountains, ponds, furniture, roofs, patios, fences, garden accessories, entertainment, roads, junctions, etc., that are suitable for any gardener to simply design a wonderful garden.Building Drawing Software for Design Site Plan
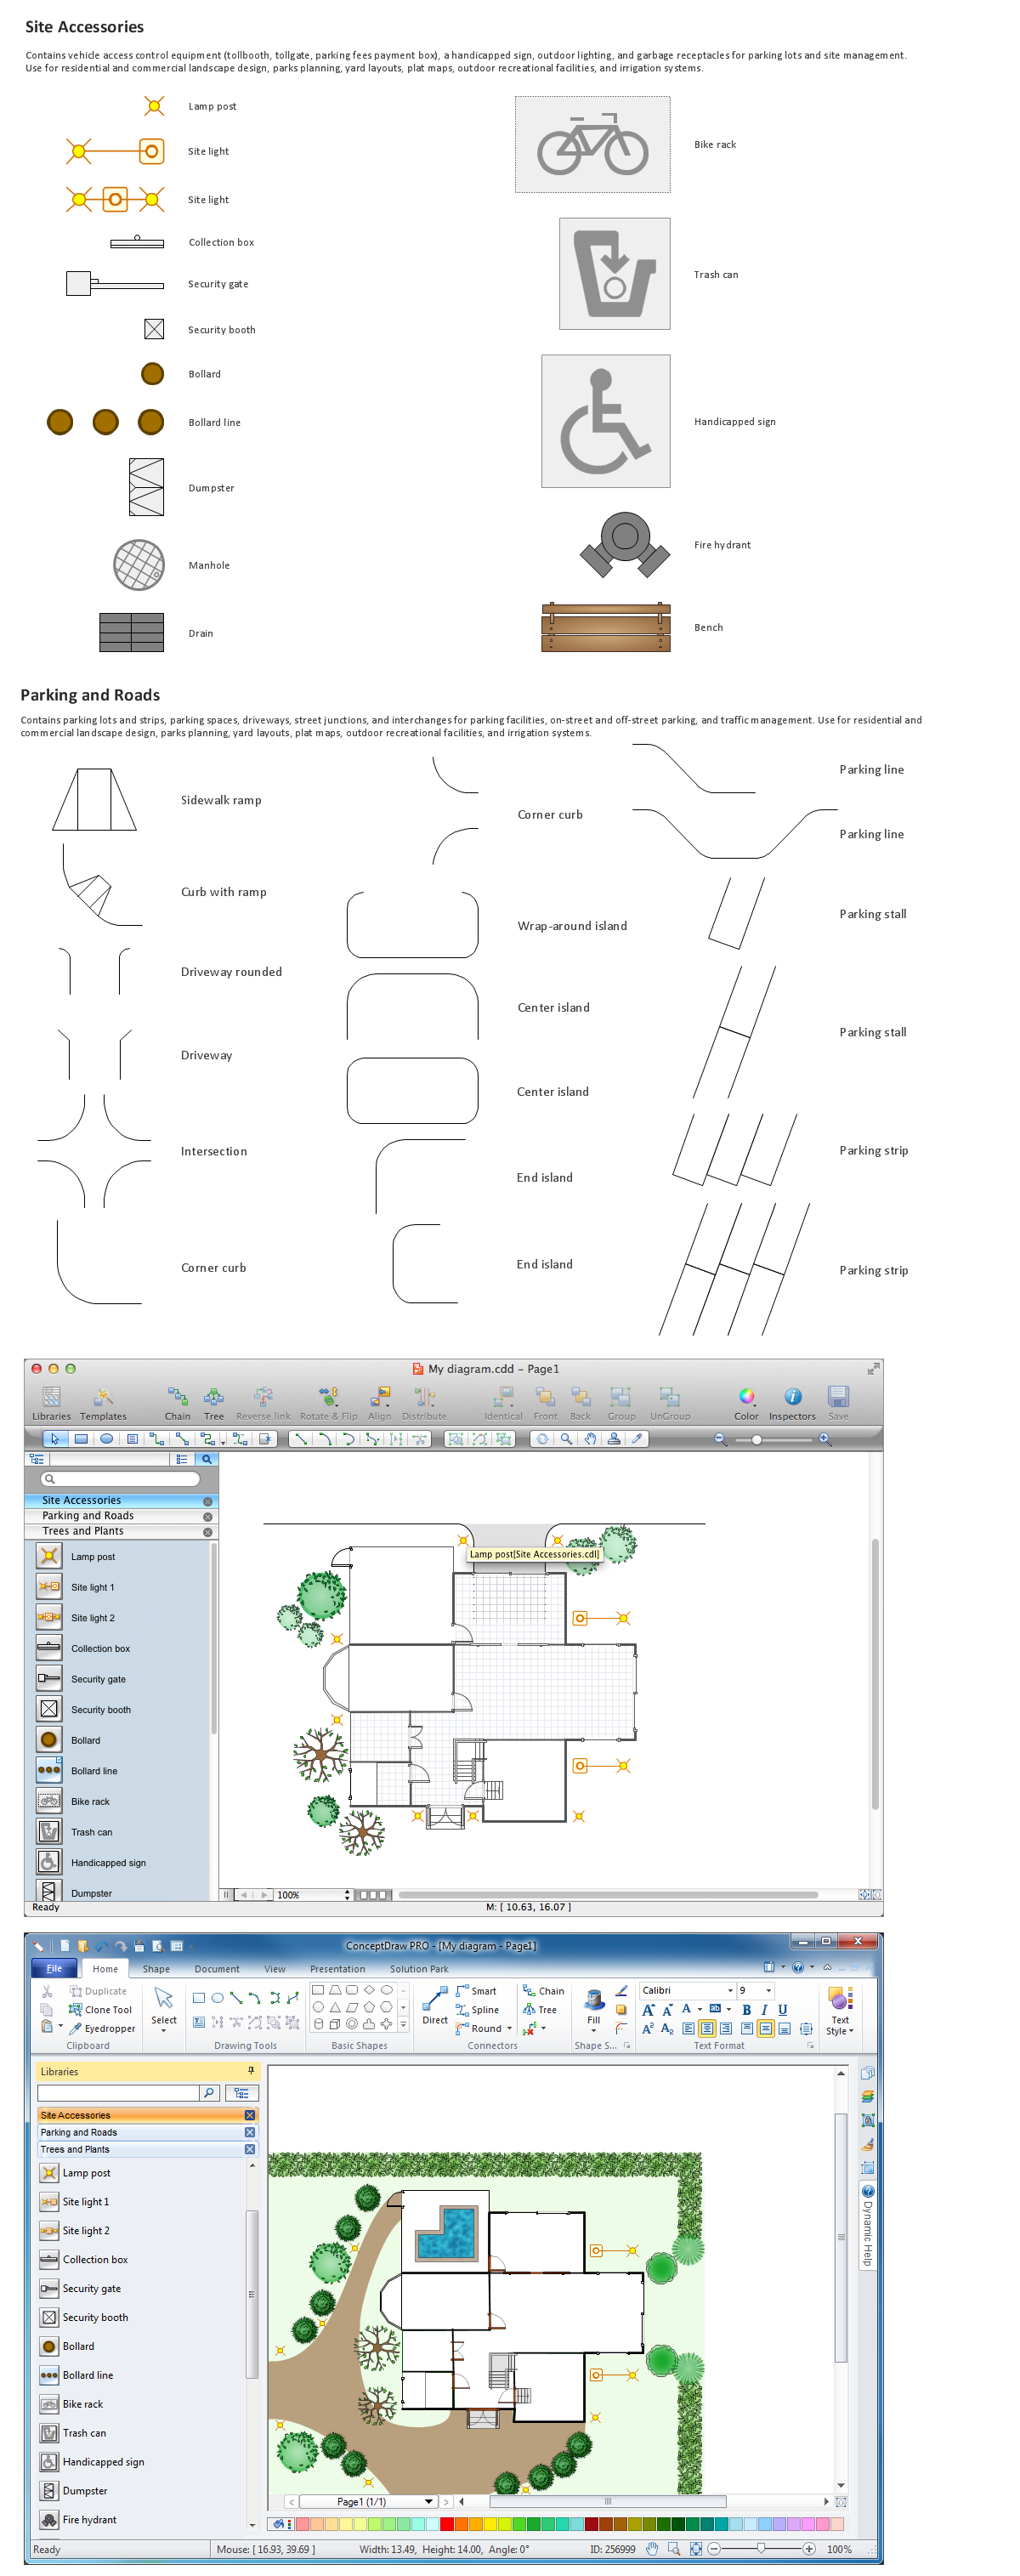
Site plan is a detailed architectural plan or document, landscape architecture project for considered object. It is a part of technical design documentation that illustrates the arrangement of buildings, trails, roads, parking, lighting, water lines, sanitary sewer lines, drainage facilities, landscape and garden elements. Site plans are constructed by architects, landscape designers or licensed design engineers, and used by the builders, contractors and installers when constructing or making improvements to some property. They reflect the main design ideas and give an instantly vision of future result after the plan's implementation. They have special value for the large projects of single or multi-floor buildings, and for accomplishment the whole districts. ConceptDraw PRO extended with Site Plans solution offers the powerful building drawing software tools and vector design elements for development and drawing Site plans and Landscape design drawings, Residential and Commercial landscape designs, Parks and Landscaping territories plans, Yard layouts, etc.
Mac Tools - SWOT Analysis
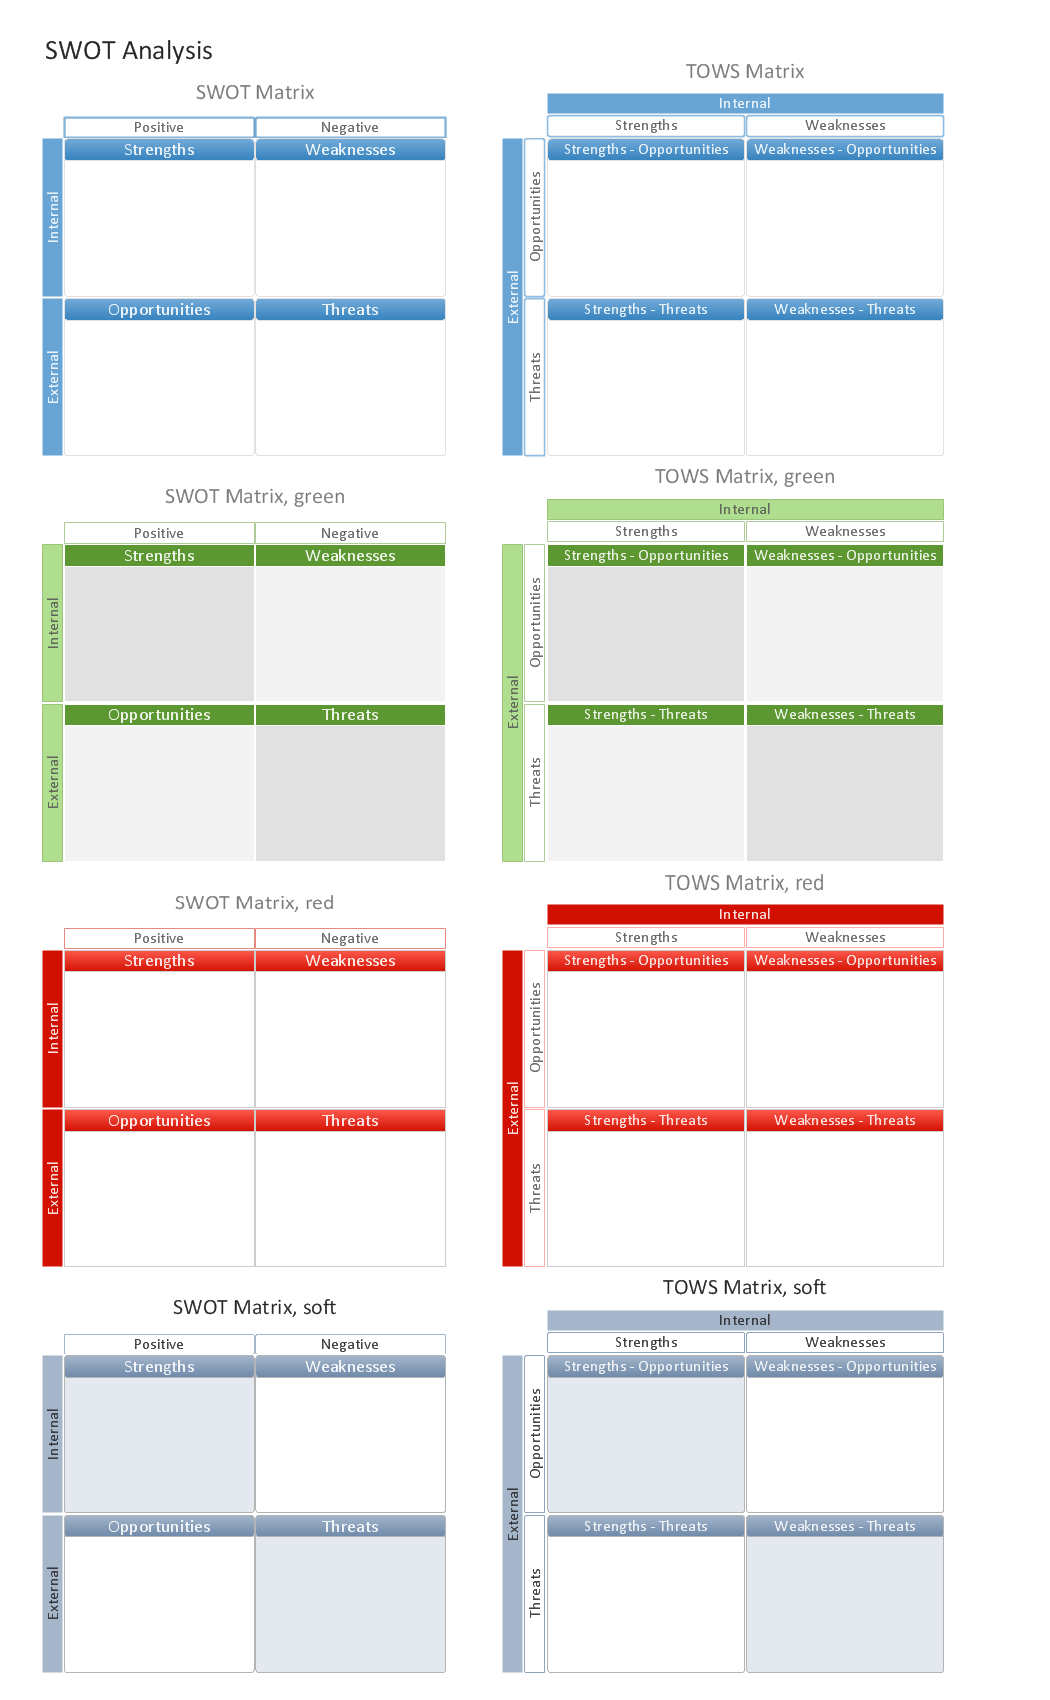
The SWOT analysis is a well-known method of the making a plan to identify and to evaluate the Strengths, Weaknesses, Opportunities, Threats that are involved in a project. The SWOT analysis involves obligatory specifying the objective of a project and identifying the internal and external causes allowing to accomplish the goals of a business or project. When making the analysis the decision makers should consider whether the objective is attainable. If not, the process is repeated and another objective can be selected. Among a lot of professional opportunities of ConceptDraw PRO diagramming and vector drawing software are also the Mac tools for holding the SWOT analysis and drawing the SWOT Analysis Diagrams and SWOT Matrices. The SWOT and TOWS Matrix Diagrams solution offered by the Management area at ConceptDraw Solution Park includes large variety of SWOT matrix samples and templates allowing the ConceptDraw PRO users to create own SWOT and TOWS diagrams fast and easy on both Mac and PC.Building Drawing Software for Design Office Layout Plan
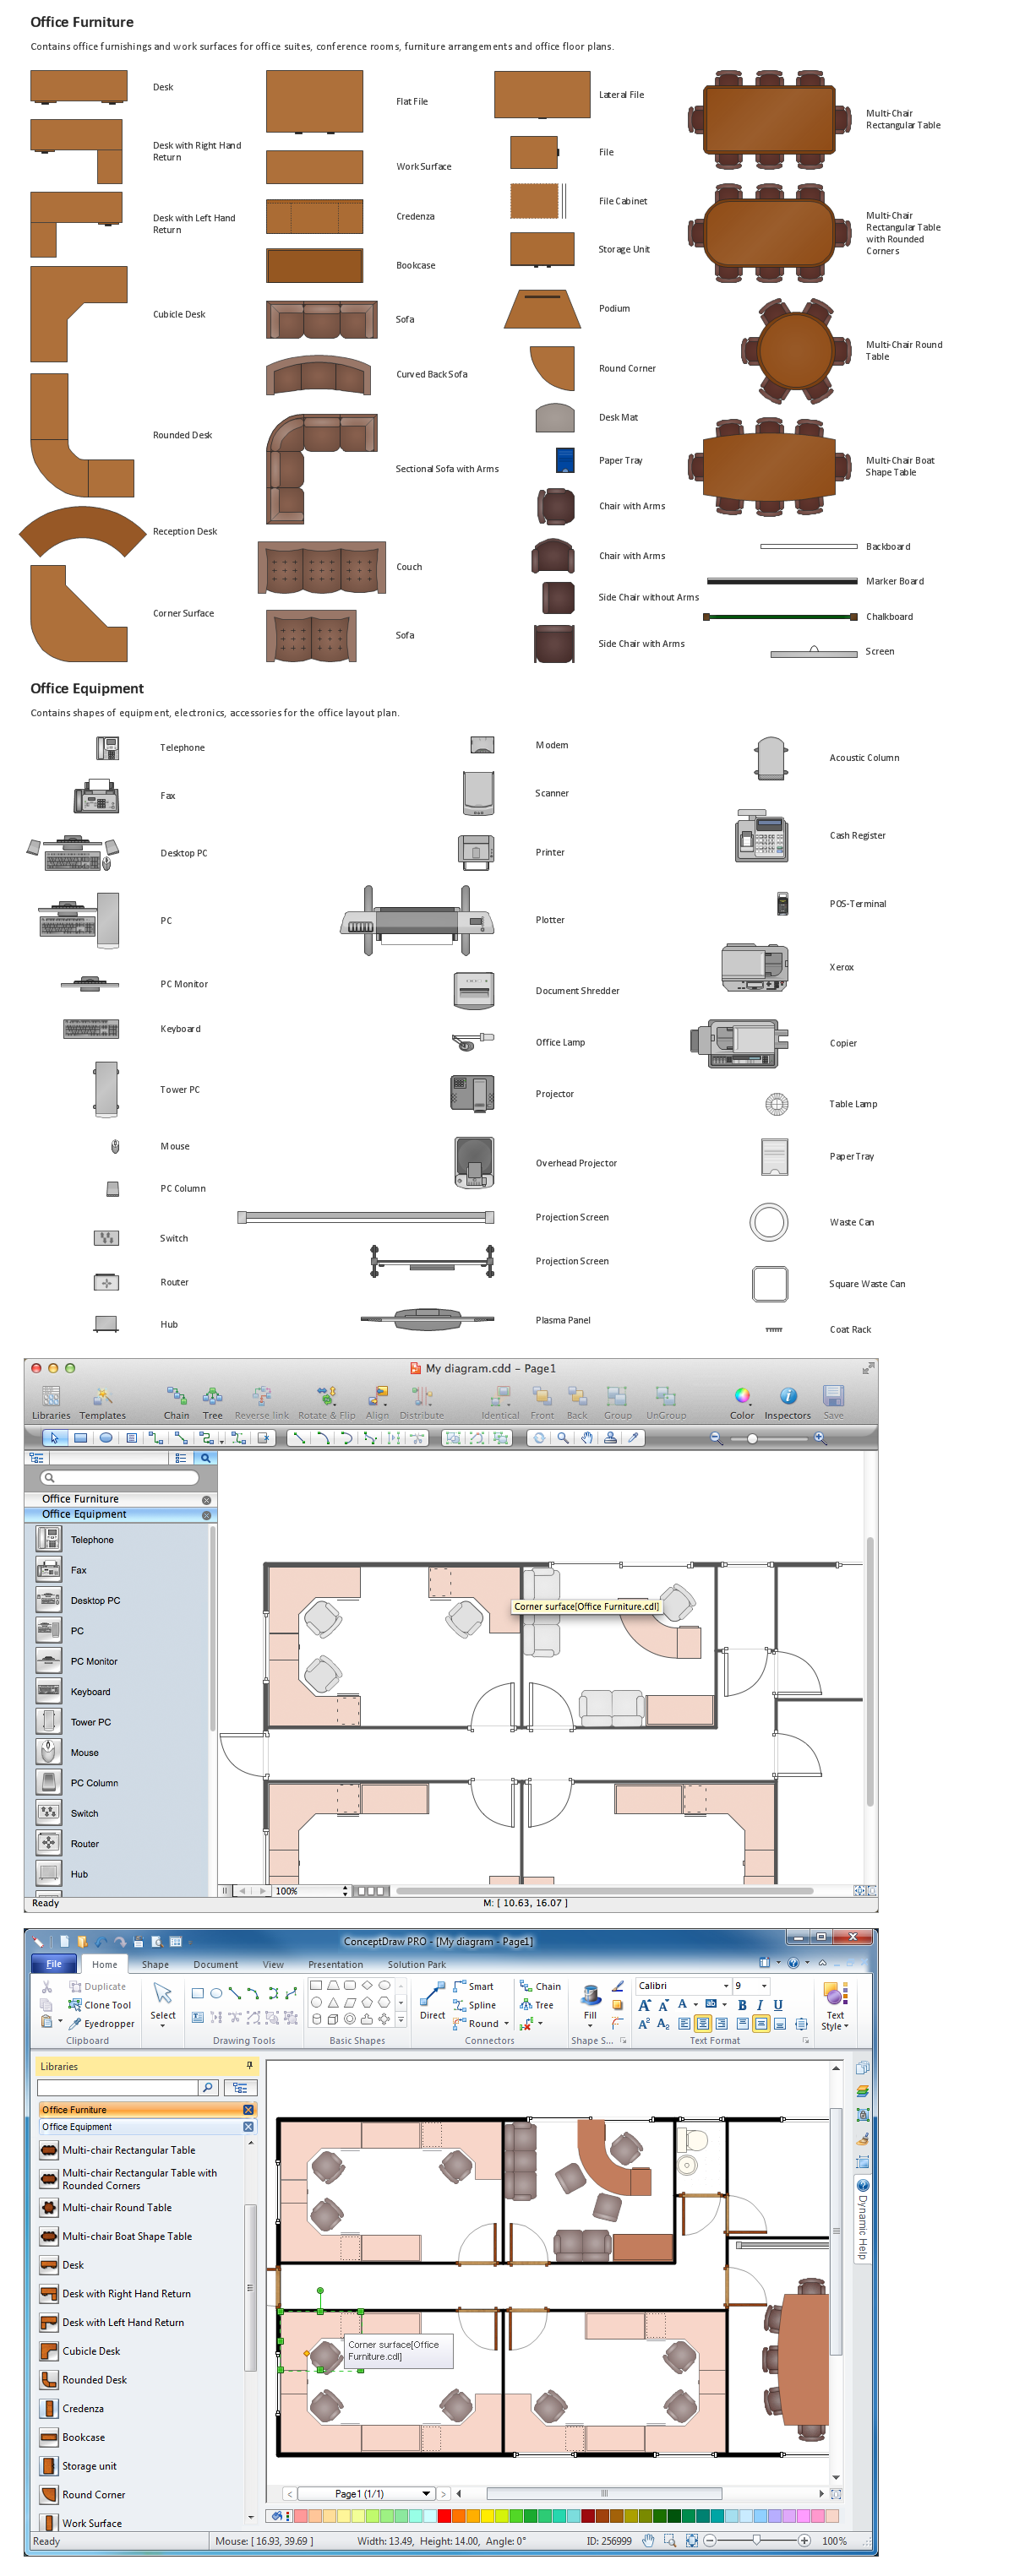
The building plans and blueprints are useful for designing and construction various premises, including definitely offices, small and large office buildings, and whole business centers. Comfort and convenience are the most important for office premises, they let configure on a working mood and increase the work productivity, so the architects and designers need to consider carefully all details. Often their construction on the paper is painstaking and labourious process, which doubly faster and easier to realize with the availability of specialized software, such as ConceptDraw PRO. Design of simple and extensive detailed Office Layout Plans, effective allocation a working space are easily with ConceptDraw PRO powerful vector diagramming and building drawing software tools, and ready-to-use vector design objects. Use they to develop the Office floor plans, Office layout plans, Blueprints for office space planning and furniture placement, Office electrical plans, Office emergency plans, etc. Thought Visio is not available for Mac, there are Visio alternatives which support MS Visio file formats. Try ConceptDraw PRO for both PC and Mac platforms to see its perpetual license privilege .
Building Drawing Software for Designing Plumbing
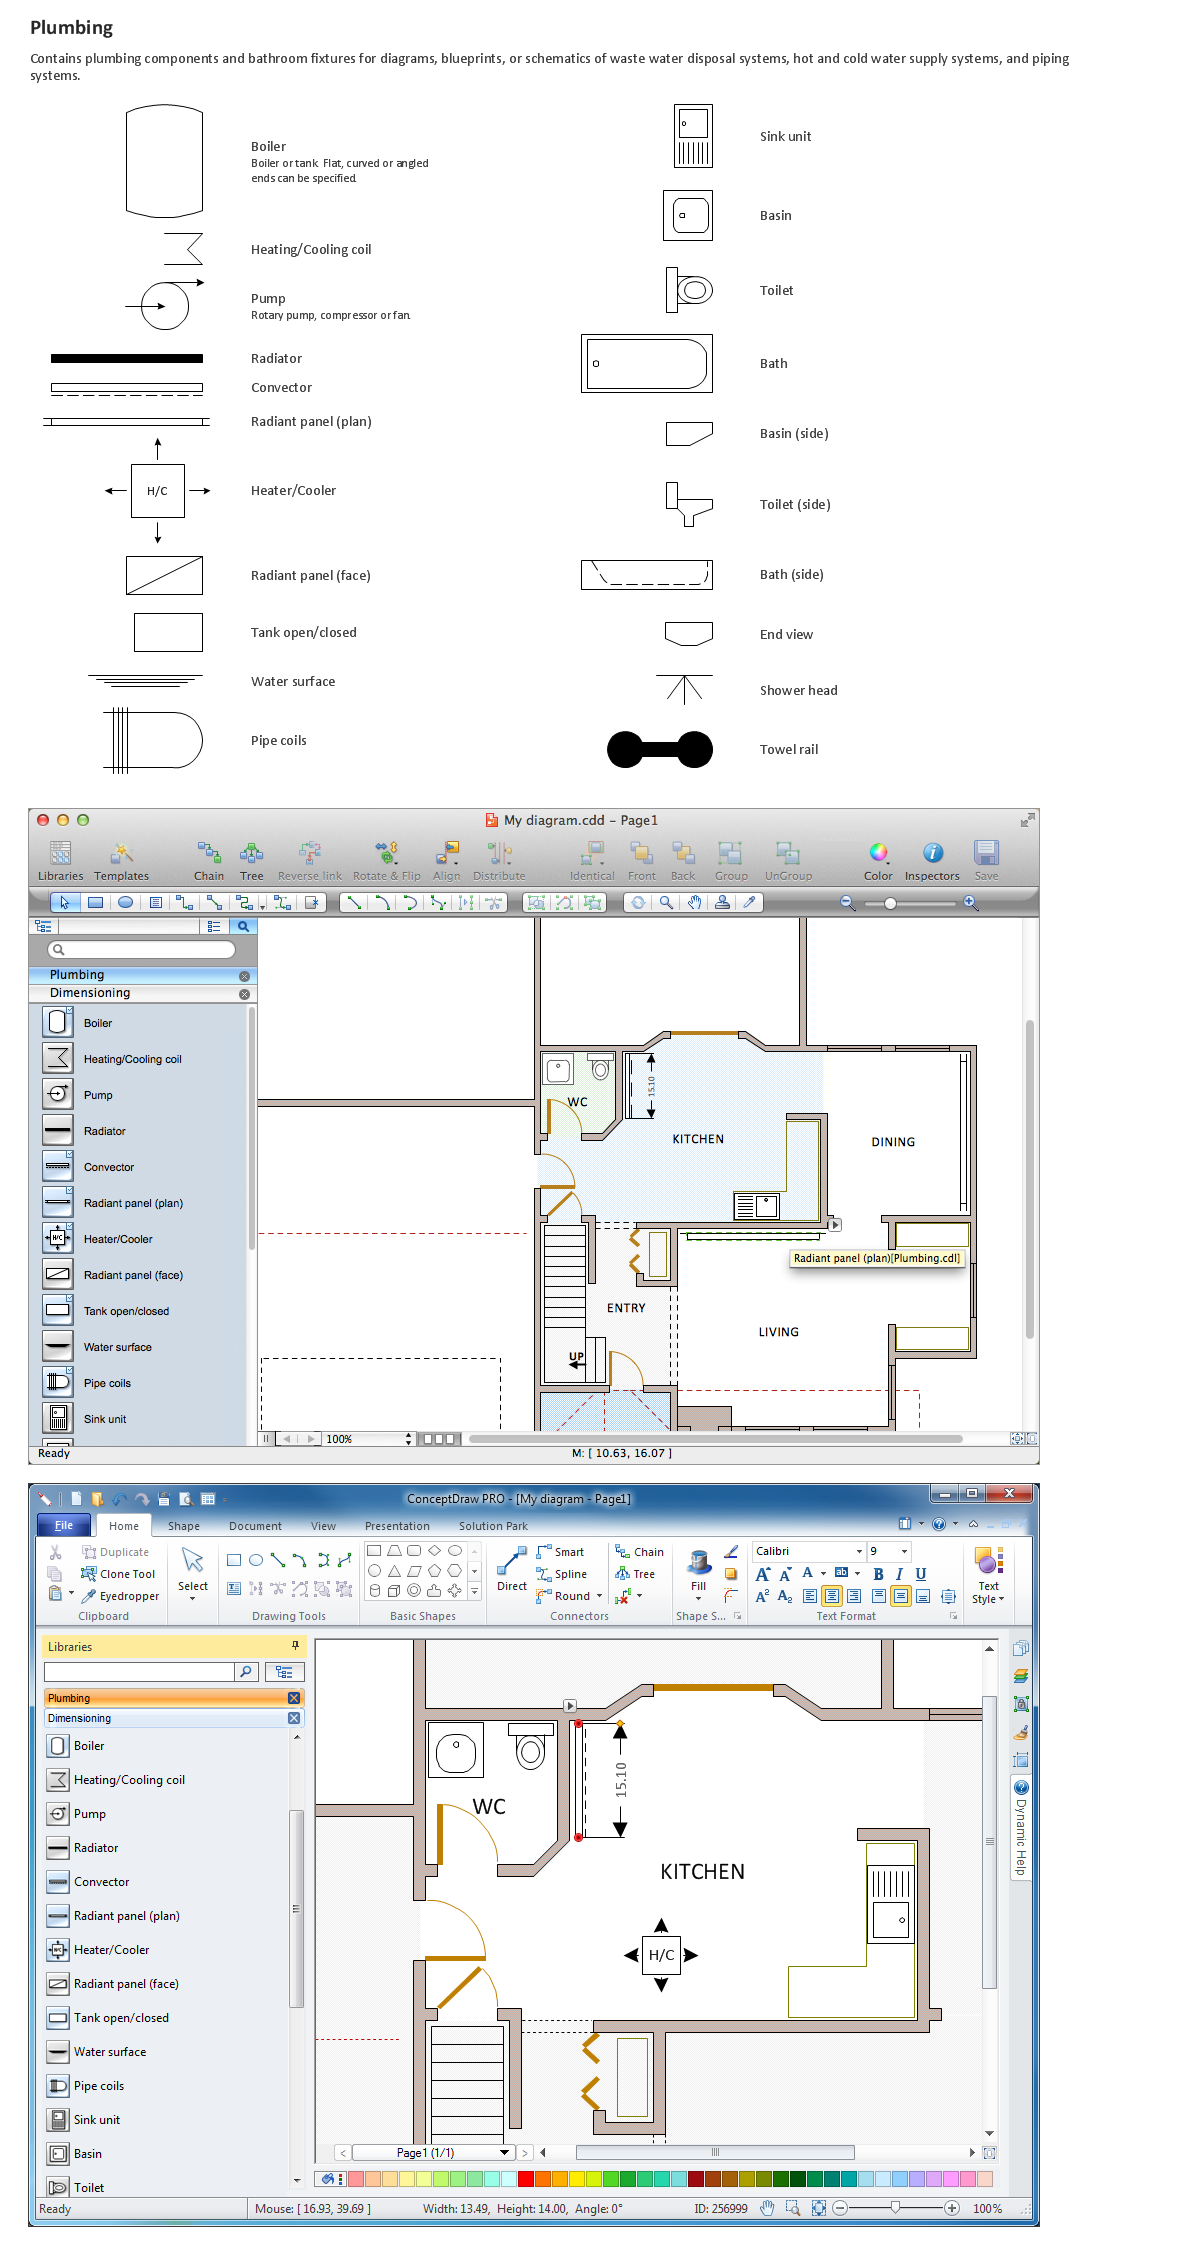
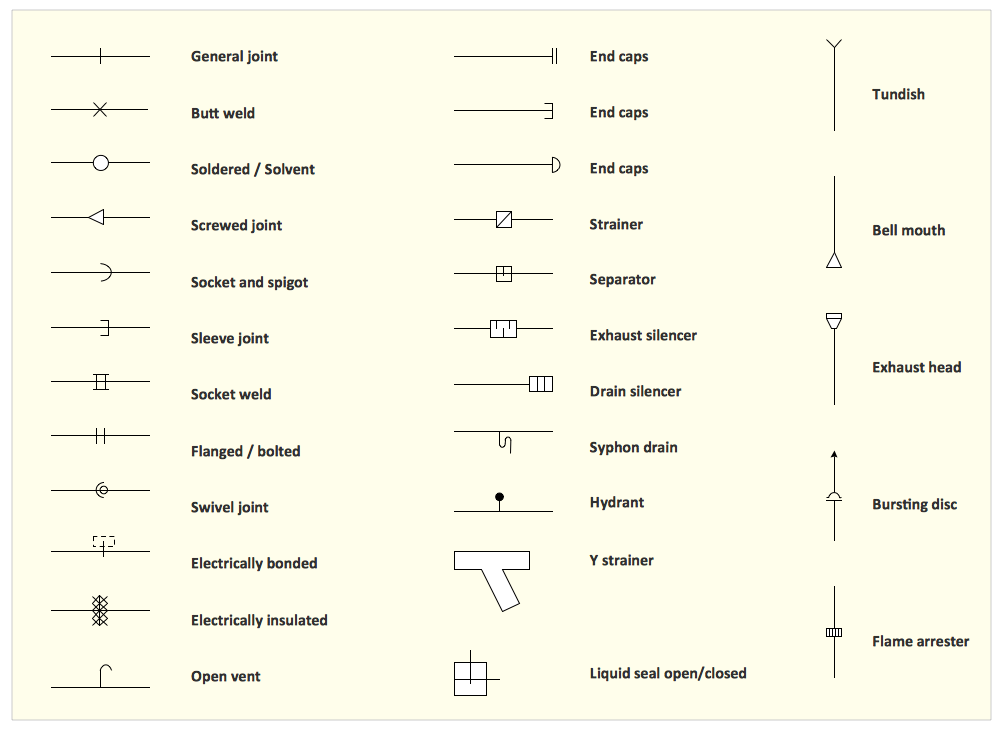
The construction project for any building obligatory must include the plans for systems of water supplying, sewerage, lighting and heating. From one side these are the documents required and indispensable for the construction, but from the other side this is a way of correct and effective selection of equipment, and subsequent its installation. Correctly performed calculations for these systems ensure a reliable, energy-efficient and cost-effective work. At this each project is fully individual decision taking into account all nuances - from the features of building to the personal preferences. ConceptDraw PRO is a powerful building drawing software for designing Plumbing, Piping, Lighting and other building plans thanks to the included Plumbing and Piping Plans solution and other solutions from Building Plans area. Plumbing and Piping Plans solution includes variety of libraries with different design elements of pipes, valves and other sanitary equipment and helps easy develop the annotated schematics and diagrams of plumbing systems, piping, and waste water.
Flow Diagram Software
The diagram is a convenient way of representing complex information and data in a simple, visual and comprehensive form. There are used many types of diagrams, each of them has its own fields of application. Flow diagram is a diagram that illustrates the flow or set of dynamic relationships in a system, visually depicts the structure of the elements in a complex system and their interactions. The term Flow diagram is also synonym for a Flowchart. Flow Diagrams are the perfect way to visually represent the structural data. ConceptDraw PRO extended with Flowcharts solution from the Diagrams area is a professional flow diagram software. The basic set of vector stencils libraries offered by Flowcharts solution, variety of samples and templates developed by specialists, and also advanced RapidDraw technology open before ConceptDraw users wide opportunities in representing the flow processes, in drawing Flow Diagrams and Flowcharts of any type and complexity. Easy tools of exporting to different graphical formats give the possibility of further successful use the diagrams.AWS Simple Icons for Architecture Diagrams
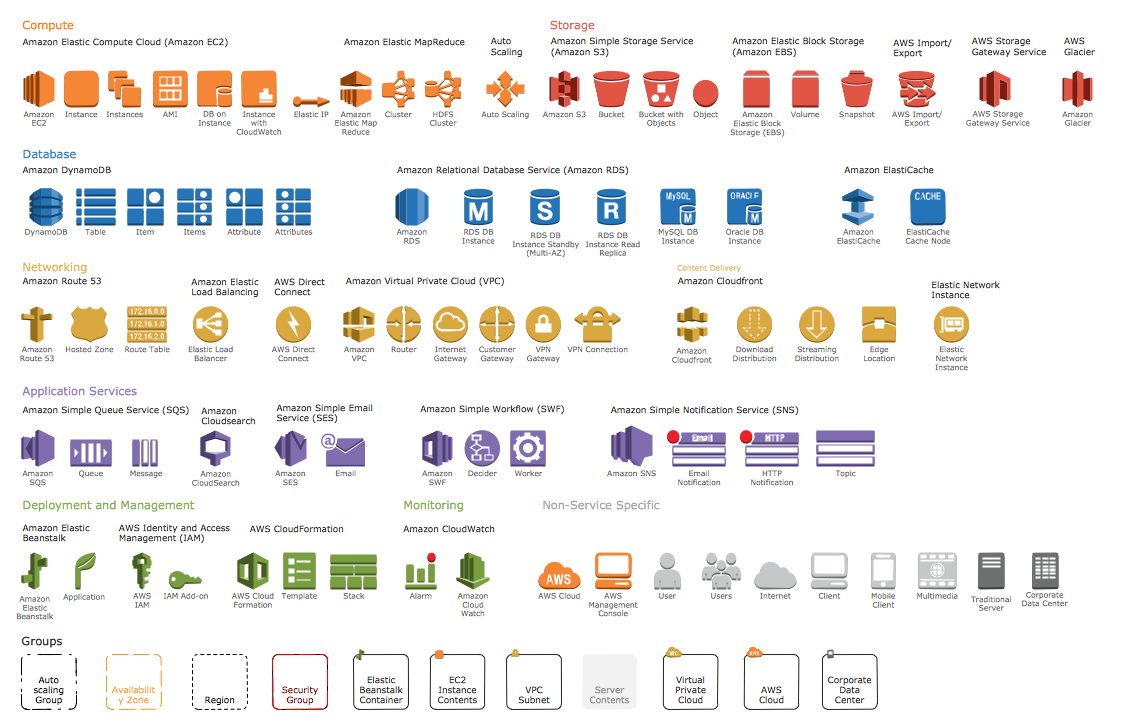
The AWS Architecture Diagrams solution includes icons, sample and templates for several Amazon Web Services products and resources, to be used when creating architecture diagrams. The icons are designed to be simple so that you can easily incorporate them in your diagrams and put them in your whitepapers, presentations, datasheets, posters or any technical material you like.Blueprint Software
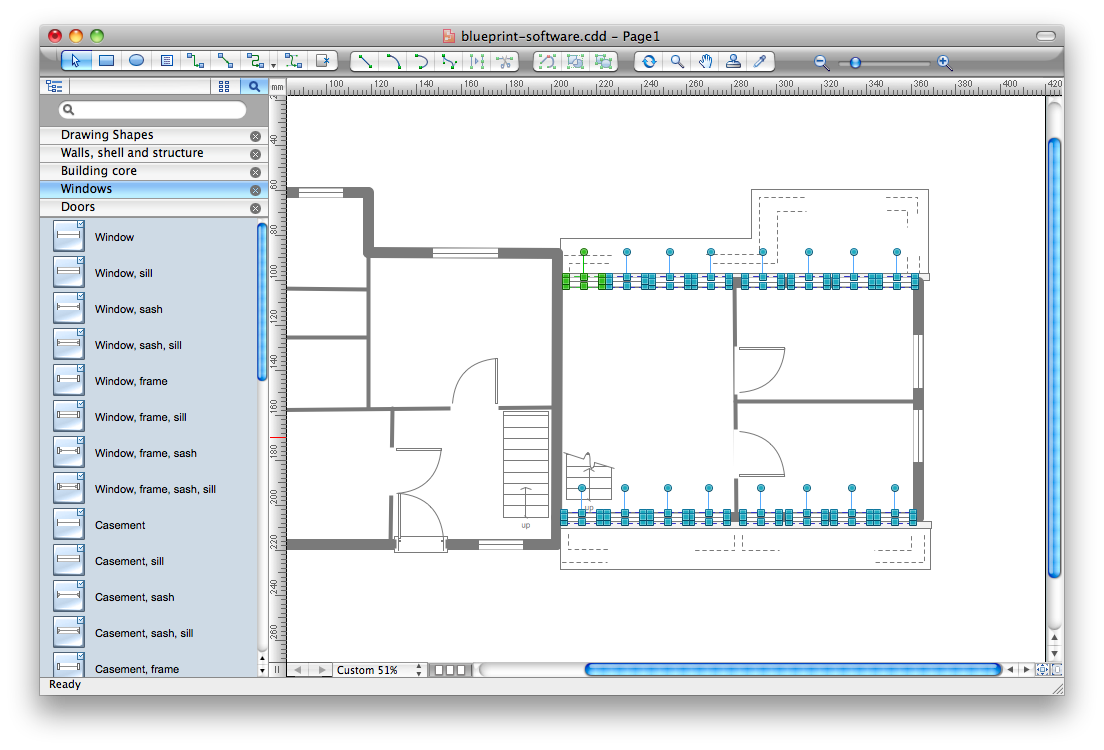
The blueprints are the set of drawings used by architects and builders in the process of construction of the buildings. The blueprints represent the top views on the buildings (homes, offices, etc.). They are drawn in the scale and use the special blueprint symbols and blueprints codes. Earlier the blueprints wer printed on the special paper and was blue. It's very easy, quick and convenient to draw the professional looking blueprints in ConceptDraw PRO diagramming and vector drawing software.Building Drawing Design Element Site Plan
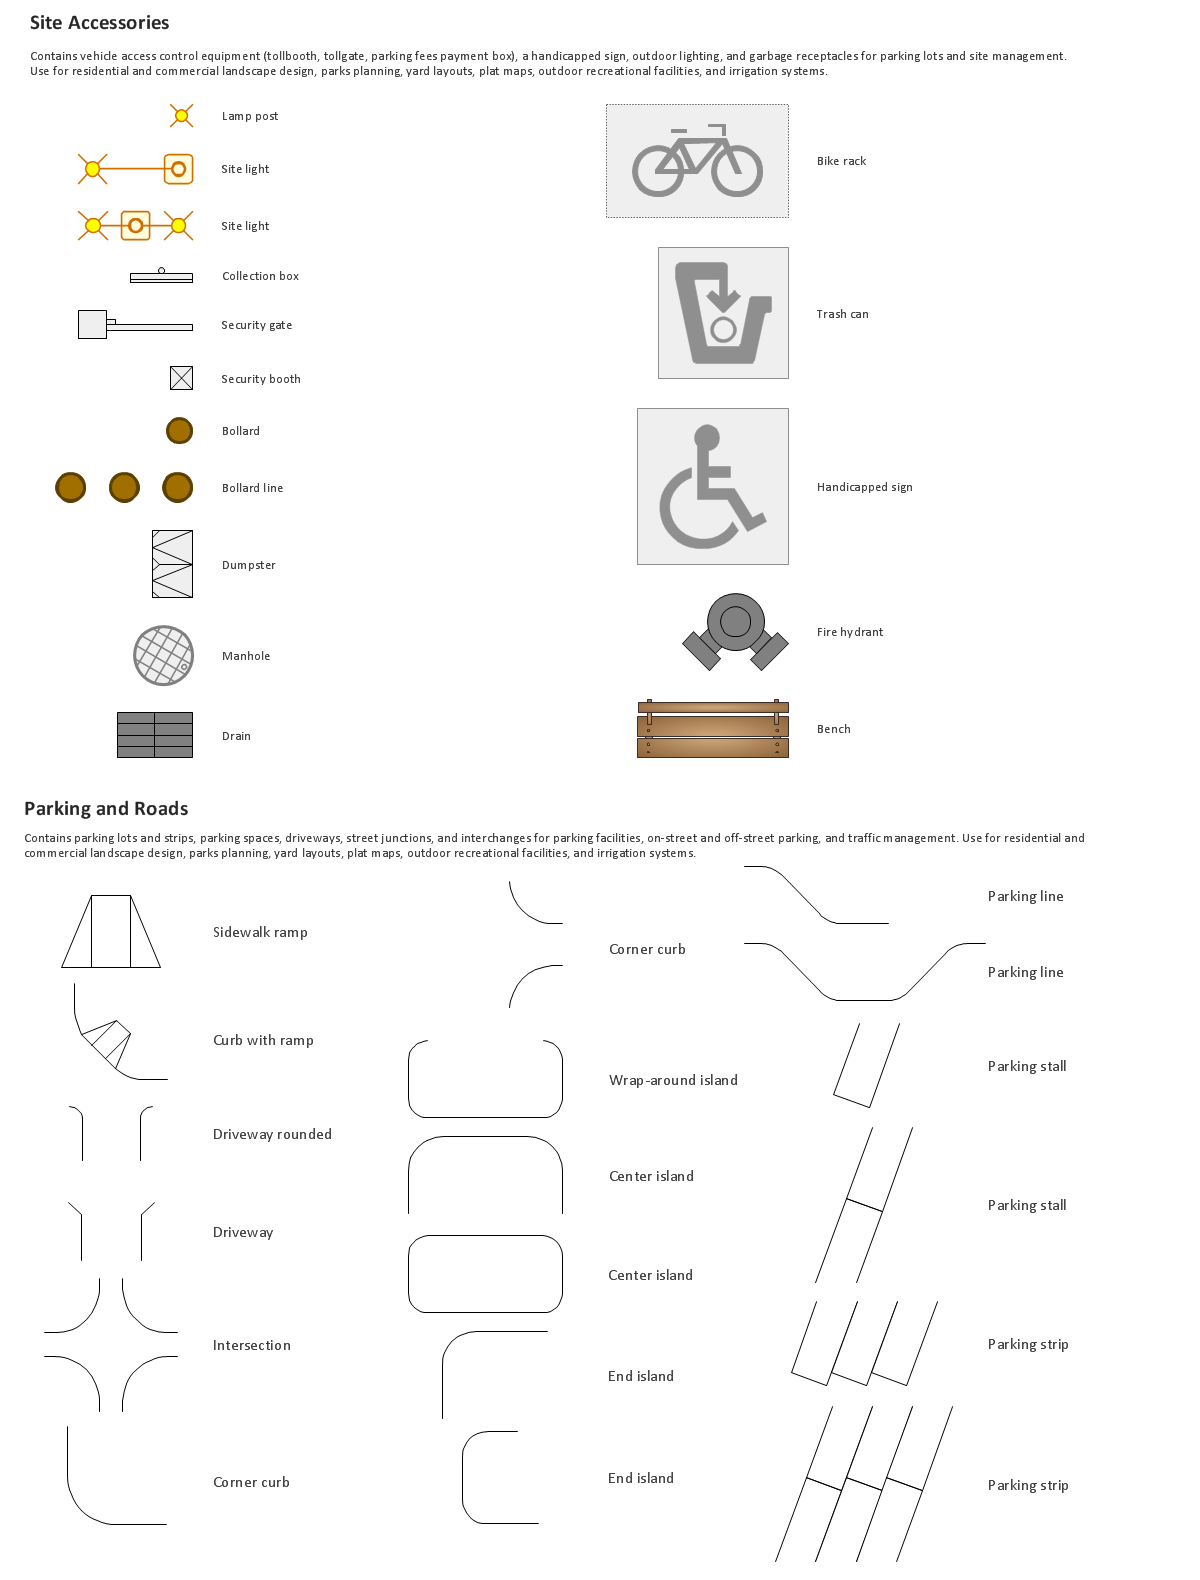
Site Plan is a part of a development project. It is a visual graphic representation of the arrangement of buildings, parking for cars and bikes, drives, landscaping, parks, flowerbeds, benches and other structural elements on the plan. Depending on the degree of detailing you can see on the Site plan more or fewer of building constructions and landscape design elements. ConceptDraw PRO Solution Park includes a specially developed Site Plans solution from the Building Plans area, which offers templates, samples, examples, and a lot of predesigned building drawing design elements for Site plan. The set of design elements contains the exclusive vector shapes of site accessories, parking, roads, trees, plants, etc. So, with confidence we can say that ConceptDraw PRO software with Site Plans solution is the best help for all in development and drawing your own Residential and Commercial landscape designs, Site plans, Park plans, Yard layouts, Outdoor recreational facilities and Irrigation system plans, and many others.
Interior Design Piping Plan - Design Elements
The pipe laying and setting the plumbing system at new apartment or home, or replacing the worn plumbing begins from the choice of materials, sizes of pipes and creation the plan. When developing a piping system, the engineer should take into account many aspects, such as advantages and disadvantages of different pipes materials, the temperature changes (freezing or thermal expansion) that effect on pipes. The most commonly used are steel pipes which have passed the test of time, but they are difficult for assembling and prone to corrosion, plastic (polypropylene) pipes that are characterized by low weight and price, ease of installation and durability, and also PEX-AL-PEX pipes. Numerous libraries with ready-to-use design elements of pipes, valves and other plumbing and piping equipment included to Plumbing and Piping Plans solution for ConceptDraw PRO help easy design Piping and Plumbing interior design plans, blueprints, schematic diagrams, technical drawings of waste water disposal systems, hot and cold water supply systems.- Free Landscape Design Software Mac Os X
- Free Landscape Design Software For Mac
- macOS User Interface | Software Development | Bubble diagrams in ...
- Best Vector Drawing Application for Mac OS X | Merry Christmas and ...
- Landscape Design Mac Free Trial
- Bubble Diagram Drawing Software
- Landscape Software Mac With Free Trial
- Free Backyard Design Software
- Mac Landscape Design
- Free Park Design Software
