The vector stencils library "Time and clock pictograms" contains 20 time pictograms: clocks, calendars, day, week, bell, alarm clock, hourglass, wristwatch, and time intervals symbols.
Use it to create temporal infographic, illustrations and diagrams.
The example "Time and clock pictograms - Vector stencils library" was created using the ConceptDraw PRO diagramming and vector drawing software extended with the Pictorial infographics solution from the area "What is infographics" in ConceptDraw Solution Park.
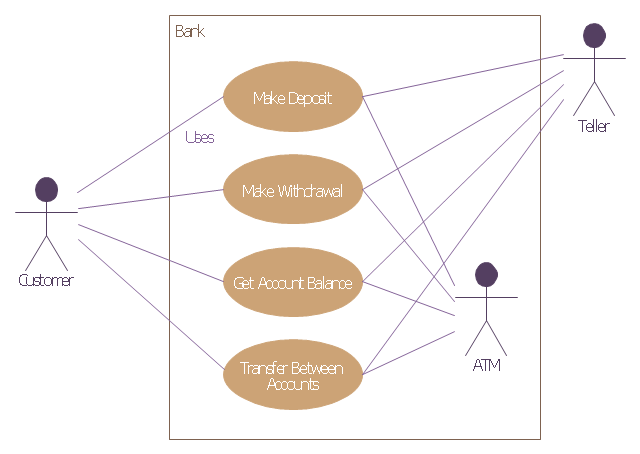
This example of bank ATM UML activity diagram was created on the base of UML use case diagram of automated teller machine from the course "Thinking in Java, 2nd edition, Revision 9" by Bruce Eckel published on the website of the Computer Science and Electrical Engineering Department of the University of Maryland, Baltimore (UMBC).
"If you are designing an auto-teller, for example, the use case for a particular aspect of the functionality of the system is able to describe what the auto-teller does in every possible situation. Each of these “situations” is referred to as a scenario, and a use case can be considered a collection of scenarios. You can think of a scenario as a question that starts with: “What does the system do if...?” For example, “What does the auto-teller do if a customer has just deposited a check within the last 24 hours, and there’s not enough in the account without the check having cleared to provide a desired withdrawal?”
Use case diagrams are intentionally simple to prevent you from getting bogged down in system implementation details prematurely...
Each stick person represents an “actor,” which is typically a human or some other kind of free agent. (These can even be other computer systems, as is the case with “ATM.”) The box represents the boundary of your system. The ellipses represent the use cases, which are descriptions of valuable work that can be performed with the system. The lines between the actors and the use cases represent the interactions.
It doesn’t matter how the system is actually implemented, as long as it looks like this to the user."
[csee.umbc.edu/ courses/ 331/ resources/ tij/ text/ TIJ213.gif]
This automated teller machine (ATM) UML use case diagram example was created using the ConceptDraw PRO diagramming and vector drawing software extended with the ATM UML Diagrams solution from the Software Development area of ConceptDraw Solution Park.
The vector stencils library "ABC" contains 87 symbols of English letters, numerals and punctuation marks.
"An alphabet is a standard set of letters (basic written symbols or graphemes) which is used to write one or more languages based on the general principle that the letters represent phonemes (basic significant sounds) of the spoken language. This is in contrast to other types of writing systems, such as syllabaries (in which each character represents a syllable) and logographies (in which each character represents a word, morpheme, or semantic unit). ... There are dozens of alphabets in use today, the most popular being the Latin alphabet (which was derived from the Greek). Many languages use modified forms of the Latin alphabet, with additional letters formed using diacritical marks. ... Alphabets are usually associated with a standard ordering of their letters. This makes them useful for purposes of collation, specifically by allowing words to be sorted in alphabetical order. It also means that their letters can be used as an alternative method of "numbering" ordered items, in such contexts as numbered lists." [Alphabet. Wikipedia]
The vector typography example "ABC - Vector stencils library" was created using the ConceptDraw PRO diagramming and vector drawing software extended with the Artwork solution from the Illustration area of ConceptDraw Solution Park.
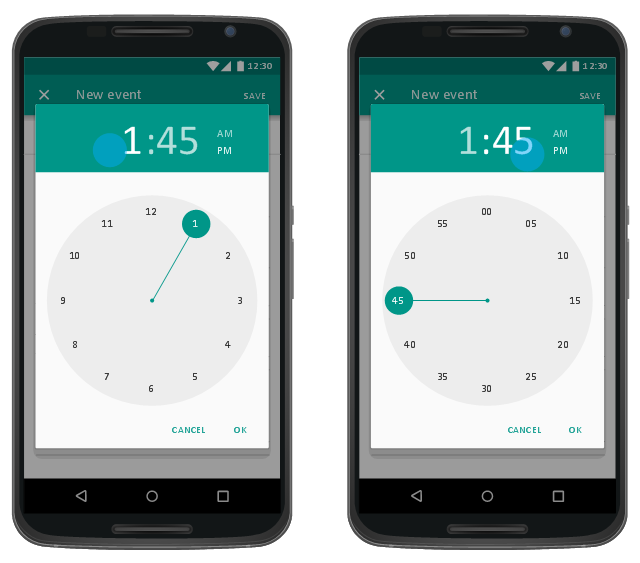
This Android 7 user interface example shows Android Material Design time picker dialog.
"Pickers provide a simple way to select a single value from a pre-determined set. ...
Time pickers use a dialog to select a single time (in the hours:minutes format) on mobile. They adjust to a user’s preferred time setting. ...
On mobile, pickers are best suited for display in a confirmation dialog. ...
A time picker adjusts to a user’s preferred time setting, i.e. the 12-hour or 24-hour format.
A dialog picker is used to select a single time (hours:minutes) on mobile.
The selected time is indicated by the filled circle at the end of the clock hand." [material.io/ guidelines/ components/ pickers.html]
The Android 7 UI design example "Time picker dialog" was created using the ConceptDraw PRO diagramming and vector drawing software extended with the "Android user interface" solution from the "Software Development" area of ConceptDraw Solution Park.
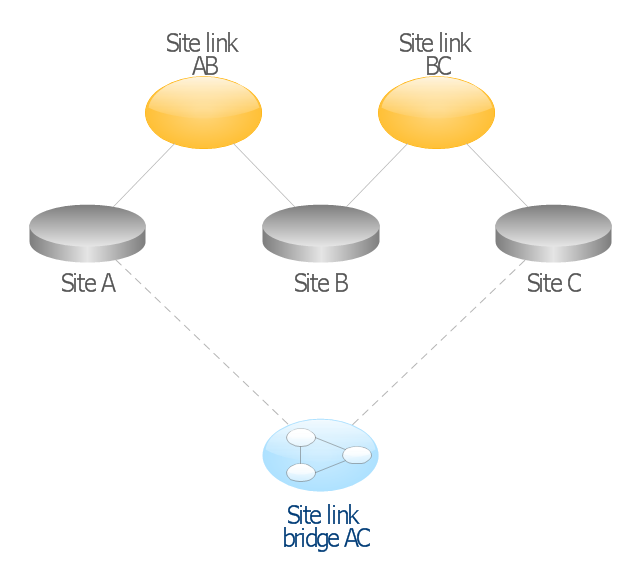
This AD diagram example was redesigned from the picture "Site links" from the book "Active Directory for Dummies".
"Site links represent the Active Directory replication paths between sites.
These paths are manually defined so that the designer has control over which network links the replication traffic occurs on. These site links also control how clients are directed to domain controllers when there’s no DC in the client’s local site. Each site link has the following attributes:
(1) Connected sites: A site link is defined by the sites to which it connects. A site link can connect two or more sites together.
(2) Network transport: Site links support replication communication over IP-based RPCs or with the Simple Mail Transport Protocol (SMTP). You normally want to use RPC whenever possible, but you can use SMTP when the sites you’re linking don’t support RPC.
(3) Cost: Each site link has a cost associated with it. Costs are used to assign preferences to links that determine which link should be followed when multiple link paths are available between sites. The cost represents what it “costs” to use this site link relative to the other site links and affects replication traffic as well as how users are assigned a domain controller. Links with lower cost values have preference over links with higher cost values. Cost values range from 1–32,767; the default being 100.
(4) Frequency: The frequency value defines how often a replication occurs
when using this site link (the replication latency). You can configure the time between replications from a minimum of 15 minutes to a maximum of 10,080 minutes (one week). The default frequency is 180 minutes.
(5) Schedule: The schedule dictates when this link is active and available for replication between the sites. The schedule can also control which days of the week the link is available. Normally, the schedule is set so that the link is available 24 hours a day, but you can set up different schedules on a per-day-of-the-week basis.
By creating a site link, you enable two or more sites to be connected and to share the same site link attributes (transport, cost, frequency, and schedule). By default, site links create transitive connectivity between sites.
If you create a site link between sites A and B and another site link between
sites B and C, an automatic connection (known as a site link bridge) is created between sites A and C..." [Steve Clines and Marcia Loughry, Active Directory® For Dummies®, 2nd Edition. 2008]
The Active Directory diagram example "Site links" was created using the ConceptDraw PRO diagramming and vector drawing software extended with the Active Directory Diagrams solution from the Computer and Networks area of ConceptDraw Solution Park.
Design Pictorial Infographics. Design Infographics
In the course of recent decades data visualization went through significant development and has become an indispensable tool of journalism, business intelligence and science. The way visual information may be conveyed is not limited simply to static or dynamic representation, it can also be interactive. Infographics can be conditionally divided into several general levels. Primarily, this is level of visualization of information, its interpretation and association on any ground. Second level can be defined as a visualization of knowledge, depiction of thoughts and ideas in the form of images or diagrams. Finally, the level of data visualization, which processes data arrays in charts, enabling the information to be more clearly perceived. You can also identify the main approaches to the creation of infographics: exploratory and narrative. Exploratory method insists on minimalist design in favor of data precision without unnecessary details and is common for scientific researches and anaNetwork Icon
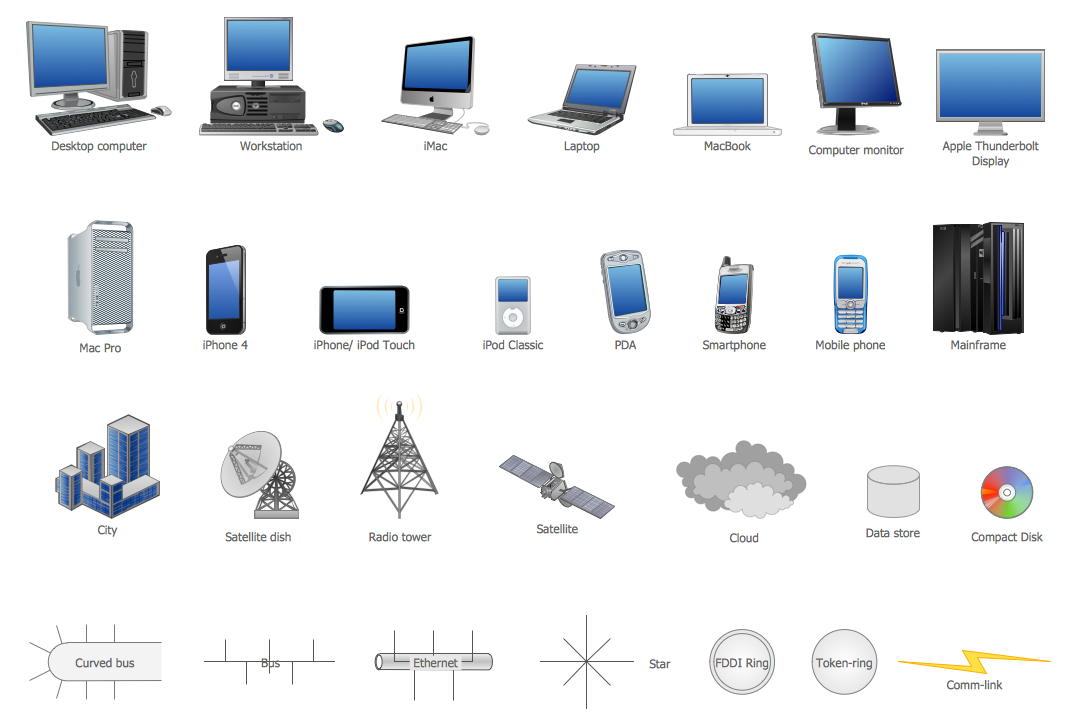
ConceptDraw PRO diagramming and vector drawing software extended with Computer Network Diagrams Solution from the Computer and Networks Area offers a set of useful tools, collection of templates, samples, and libraries of various computer symbols, computer devices icons, computer network icon for fast and easy drawing network computer diagrams and illustrations.
 Aerospace and Transport
This solution extends ConceptDraw PRO software with templates, samples and library of vector clipart for drawing the Aerospace and Transport Illustrations. It contains clipart of aerospace objects and transportation vehicles, office buildings and anci
Chart Software for Better Presentations
Easy charting software comes with beautiful chart templates and examples. This makes it easy to create professional charts without prior experience. Graphs and Charts Area provide a wide collection of professional looking predesigned templates, samples and ready-to-use vector stencils that will help you to draw the charts and diagrams of various types: Pie Charts, Donut Charts, Line Charts, Column Charts, Bar Charts, Pyramids, Scatter Charts, Venn Diagrams, Spider Charts, Area Charts, Divided Bar Graphs.Business Processes description with ConceptDraw PRO
Business Processes description with ConceptDraw. Business-processes it allows to describe functional blocks, for example production and marketing. ConceptDraw lets creation of business processes description using IDEF0 and IDEF2 methods.
 ATM UML Diagrams
The ATM UML Diagrams solution lets you create ATM solutions and UML examples. Use ConceptDraw PRO as a UML diagram creator to visualize a banking system.
Infographic Maker
Infographic is a visual way of representing various information, data, knowledge in statistics, geography, journalism, education, and much more areas. ConceptDraw PRO supplied with Pictorial Infographics Solution from the “What are Infographics” Area, provides a set of powerful pictorial infographics tools. Thanks to them it is the best Infographic Maker.Process Mapping
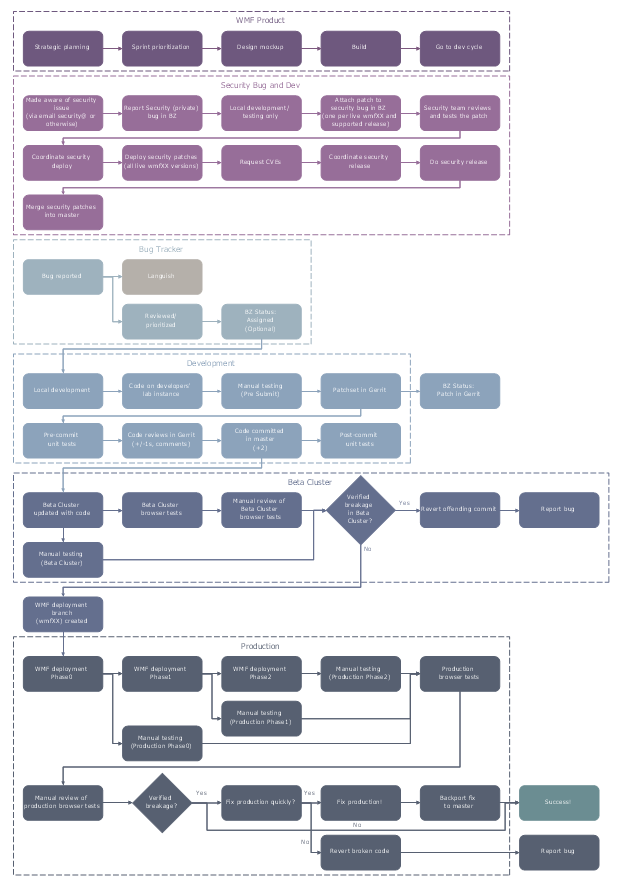
ConceptDraw PRO diagramming and vector drawing software offers the unique Business Process Mapping Solution from the Business Processes Area of ConceptDraw Solution Park. Powerful drawing tools of this solution make it effective Business Process Mapping software and help easy design professional looking business process diagrams and flowcharts.Scrum workflow
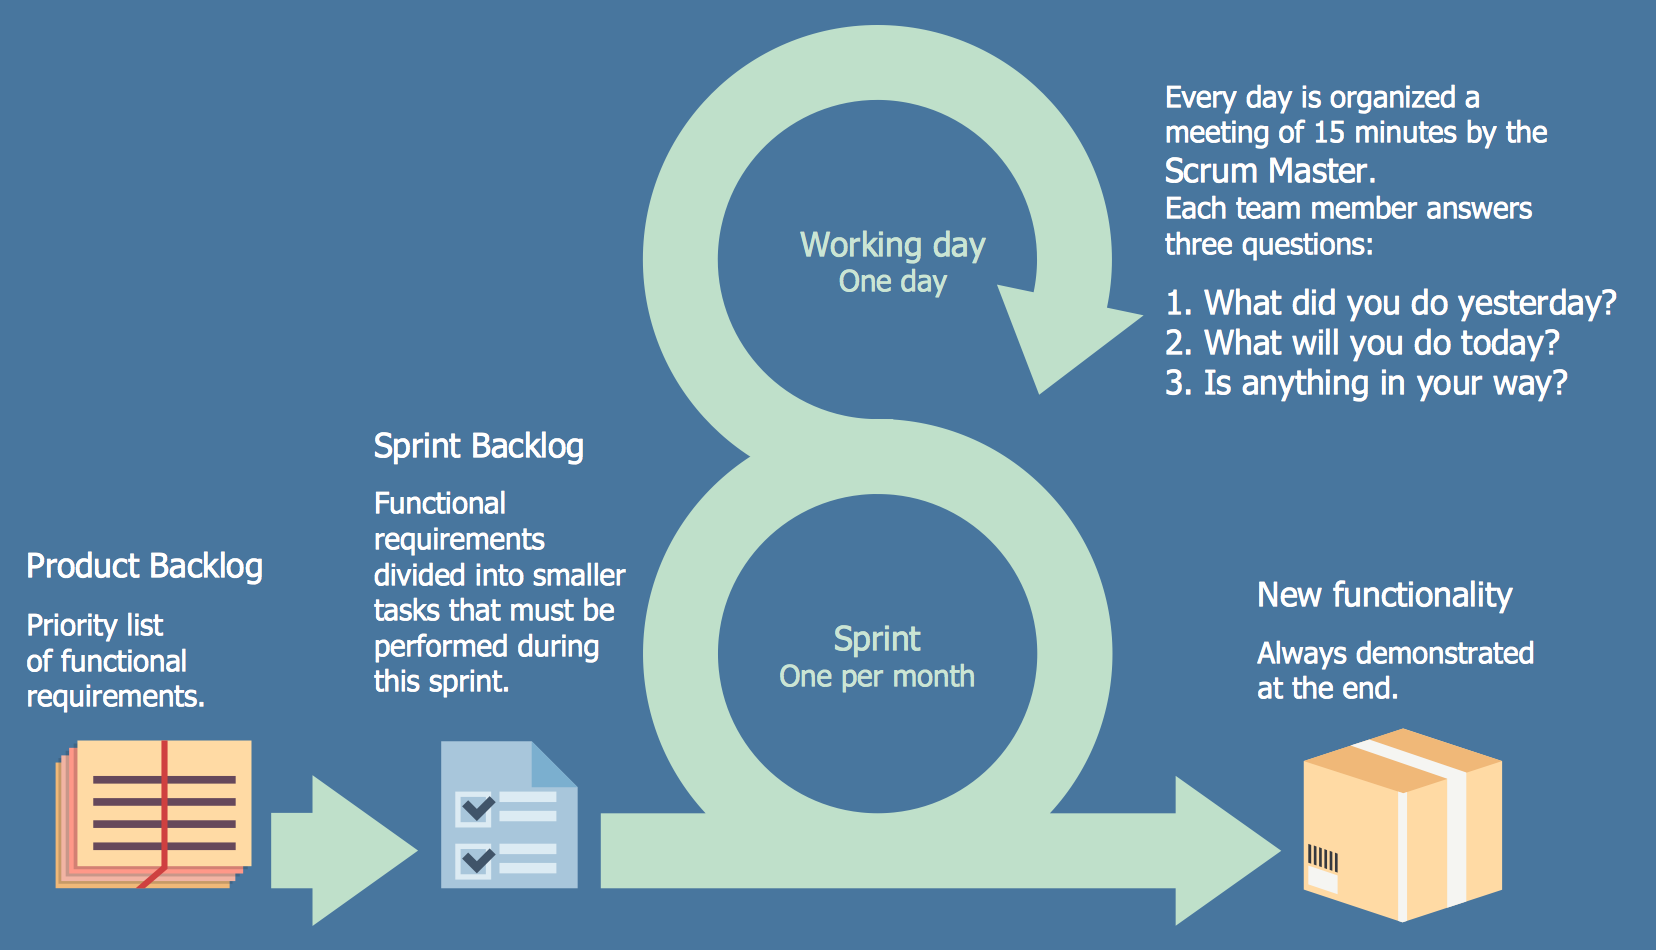
ConceptDraw PRO diagramming and vector drawing software extended with unique SCRUM Workflow solution from the Project Management area of ConceptDraw Solution Park allows fast and easy design professional-looking Scrum Workflow Diagrams and Scrum workflow scheme for projects required when working on projects and managing them, when developing software with cutting-edge Agile methodologies.- Time and clock pictograms - Vector stencils library | Time and clock ...
- Png In 24 Hours
- Buildings and green spaces - Vector stencils library | 24 Hours ...
- Time 24 Hrs Icon
- 24 Hours Icon Illustration Png
- 24 Hours Png
- Time and clock pictograms - Vector stencils library
- 24 Vector Black
- Northern constellations (45-90 degrees) - Vector stencils library ...
- Vector stencils library - Use case diagram | Jacobson Use Cases ...
- Time and clock pictograms - Vector stencils library | Design ...
- Time - Design Elements | Time and clock pictograms - Vector ...
- Time and clock pictograms - Vector stencils library | Time - Vector ...
- Time and clock pictograms - Vector stencils library | Time - Vector ...
- Time - Design Elements | Time and clock pictograms - Vector ...
- Time and clock pictograms - Vector stencils library | Football (Soccer ...
- Basketball Court Dimensions | Time and clock pictograms - Vector ...
- Geo Map - USA - Maryland | North America - Vector stencils library ...
- Bank ATM use case diagram | Model Based Systems Engineering ...
- Pyramid Diagram | Time - Vector stencils library | Time and clock ...


