HelpDesk
How to Draw Physics Diagrams

 Event-driven Process Chain Diagrams
Event-Driven Process Chain Diagrams solution extends ConceptDraw DIAGRAM functionality with event driven process chain templates, samples of EPC engineering and modeling the business processes, and a vector shape library for drawing the EPC diagrams and EPC flowcharts of any complexity. It is one of EPC IT solutions that assist the marketing experts, business specialists, engineers, educators and researchers in resources planning and improving the business processes using the EPC flowchart or EPC diagram. Use the EPC solutions tools to construct the chain of events and functions, to illustrate the structure of a business process control flow, to describe people and tasks for execution the business processes, to identify the inefficient businesses processes and measures required to make them efficient.
 Language Learning
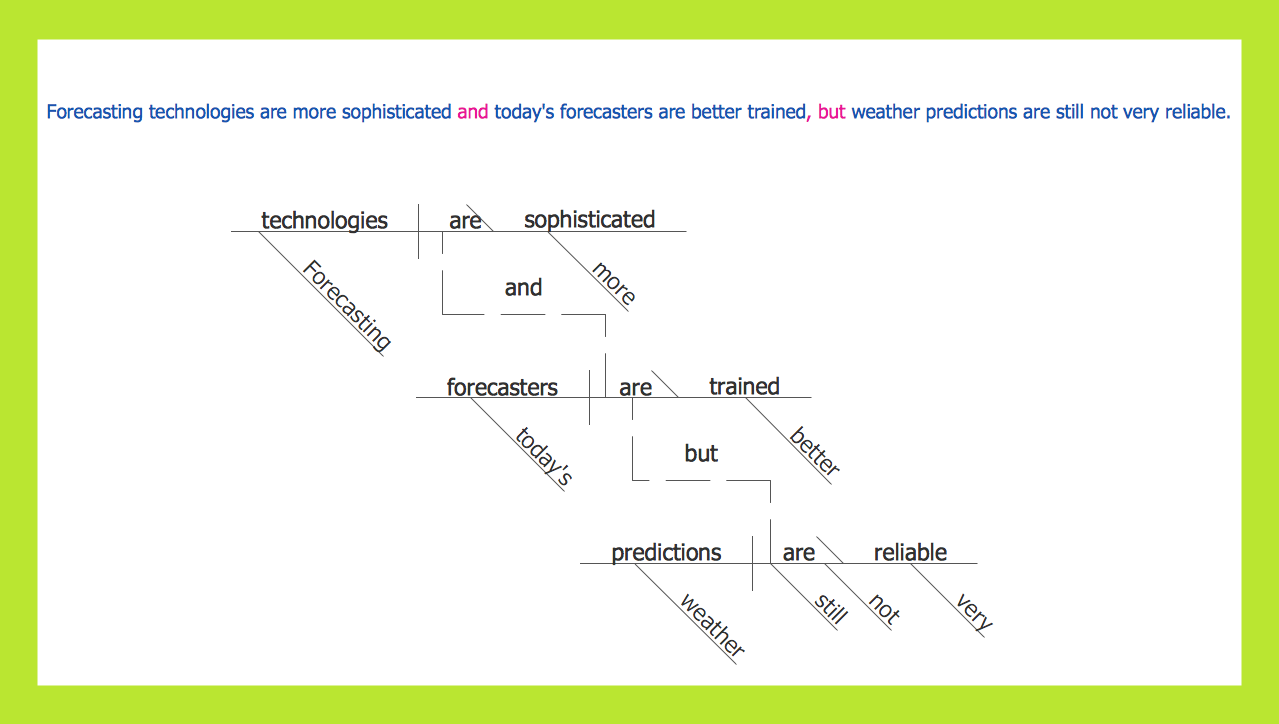
Language Learning solution extends ConceptDraw DIAGRAM software with templates, samples and library of vector stencils for drawing the sentence diagrams.
Sentence Diagram
Value Stream Mapping Icons
Process Flow Chart Symbols

Workflow Diagram Symbols

 AWS Architecture Diagrams
AWS Architecture Diagrams with powerful drawing tools and numerous predesigned Amazon icons and AWS simple icons is the best for creation the AWS Architecture Diagrams, describing the use of Amazon Web Services or Amazon Cloud Services, their application for development and implementation the systems running on the AWS infrastructure. The multifarious samples give you the good understanding of AWS platform, its structure, services, resources and features, wide opportunities, advantages and benefits from their use; solution’s templates are essential and helpful when designing, description and implementing the AWS infrastructure-based systems. Use them in technical documentation, advertising and marketing materials, in specifications, presentation slides, whitepapers, datasheets, posters, etc.
Basic Diagramming


Sales Process

 Network Security Diagrams
The Network Security Diagrams solution presents a large collection of predesigned cybersecurity vector stencils, cliparts, shapes, icons and connectors to help you succeed in designing professional and accurate Network Security Diagrams, Network Security Infographics to share knowledge about effective ways of networks protection with help of software and network security devices of different cyber security degrees, Network Plans for secure wireless network, Computer Security Diagrams to visually tell about amazing possibilities of IT security solutions. The samples and examples reflect the power of ConceptDraw DIAGRAM software in drawing Network Security Diagrams, give the representation about variety of existing types of attacks and threats, help to realize their seriousness and the methods to deal with them.
 SYSML
SYSML
The SysML solution helps to present diagrams using Systems Modeling Language; a perfect tool for system engineering.
 Plumbing and Piping Plans
Plumbing and Piping Plans solution extends ConceptDraw DIAGRAM.2.2 software with samples, templates and libraries of pipes, plumbing, and valves design elements for developing of water and plumbing systems, and for drawing Plumbing plan, Piping plan, PVC Pipe plan, PVC Pipe furniture plan, Plumbing layout plan, Plumbing floor plan, Half pipe plans, Pipe bender plans.
Scientific Symbols Chart

Mathematics Solution from the Science and Education area of ConceptDraw Solution Park includes a few shape libraries of plane, solid geometric figures, trigonometrical functions and greek letters to help you create different professional looking mathematic illustrations for science and education.
 Presentation Exchange
This solution extends ConceptDraw MINDMAP software with the ability to import presentations from Microsoft PowerPoint, as well as enhancing its existing presentation capabilities.
- How to Draw Physics Diagrams in ConceptDraw PRO | Education ...
- Physics Diagrams | How to Draw Physics Diagrams in ConceptDraw ...
- Physics Diagrams | Piping and Instrumentation Diagram Software ...
- Physics Diagrams | How to Draw Physics Diagrams in ConceptDraw ...
- Physics Diagrams | Physics Symbols | How to Draw Physics ...
- Physics Diagrams | Physics Symbols | How to Draw Physics ...
- Physics Diagrams | Physics | Physics Symbols | Physics Diagrams
- How to Draw Physics Diagrams in ConceptDraw PRO | Line Chart ...
- Physics Diagrams | Physics Symbols | Physics | Mechanics ...
- Physics Diagrams | Physics | Physics Symbols | Physics Diagram
- How to Draw Physics Diagrams in ConceptDraw PRO
- Physics Diagrams | Physics Symbols | How to Draw Physics ...
- Physics | Physics Diagrams | How to Draw Physics Diagrams in ...
- Physics Diagrams | Functional Block Diagram | How to Draw Physics ...
- Physics Diagrams | Software Diagram Examples and Templates ...
- Free-body diagram | Physics Diagrams | Physics | Concept Of Free ...
- Free-body diagram | Physics Diagrams | Physics | Body Diagram
- How to Draw Physics Diagrams in ConceptDraw PRO | Physics ...
- Physics Diagrams | Functional Flow Block Diagram | How to Draw ...
- Free Body Diagram Physics Examples