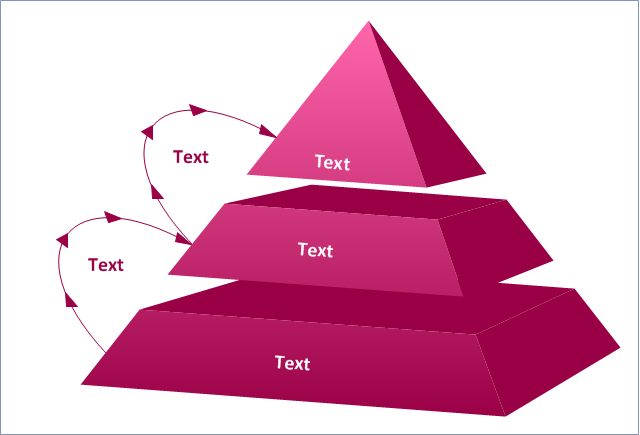
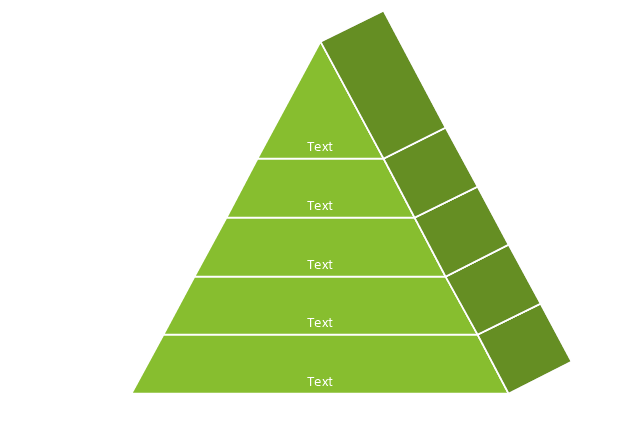
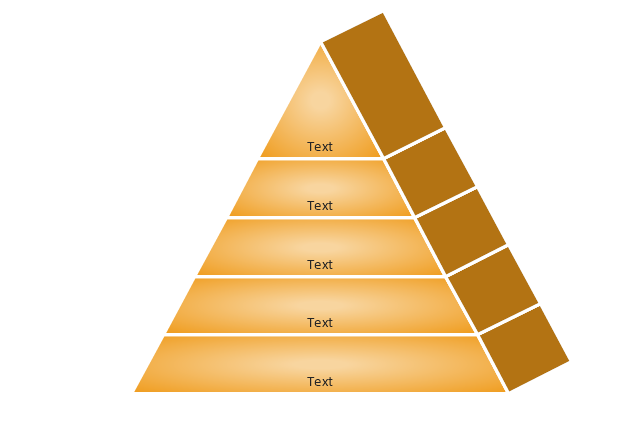
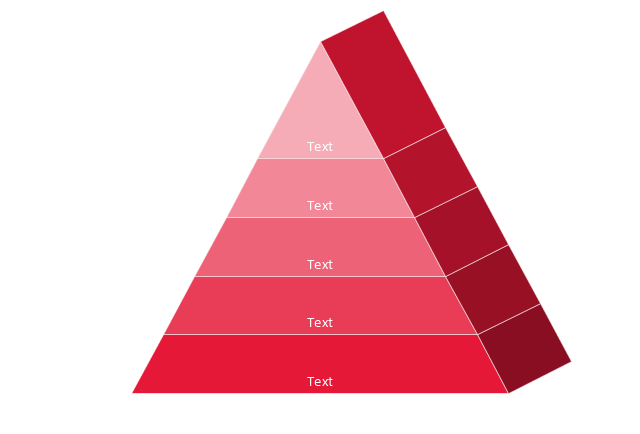
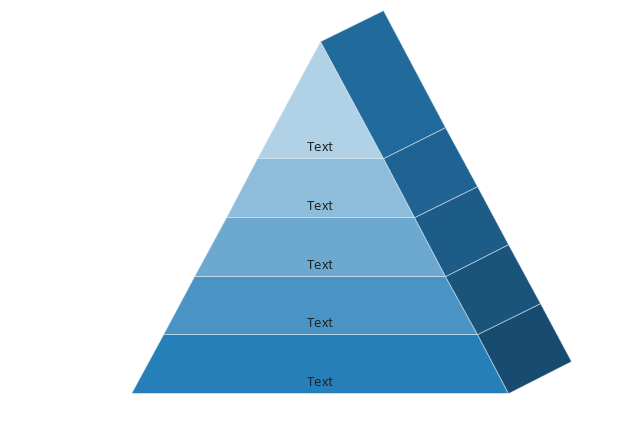
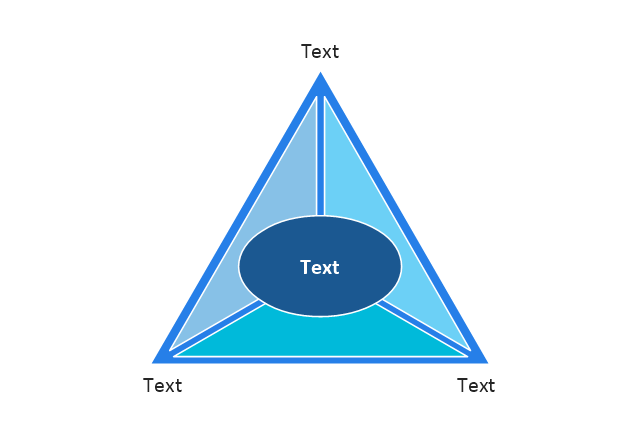
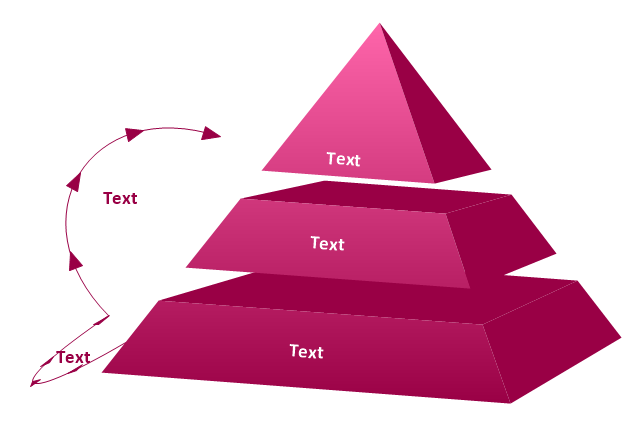
The template "3-Level 3D pyramid diagram" for the ConceptDraw PRO diagramming and vector drawing software is included in the Pyramid Diagrams solution from the Marketing area of ConceptDraw Solution Park.
www.conceptdraw.com/ solution-park/ marketing-pyramid-diagrams
www.conceptdraw.com/ solution-park/ marketing-pyramid-diagrams
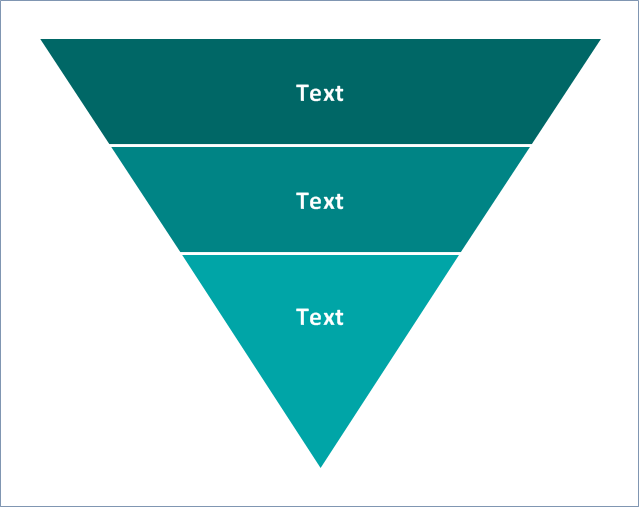
Use this 3-level funnel diagram template to quickly create your own marketing funnel diagrams using the ConceptDraw PRO diagramming and vector drawing software. The 3-level funnel diagram template is included in the Pyramid Diagrams solution from the Marketing area of ConceptDraw Solution Park.
www.conceptdraw.com/ solution-park/ marketing-pyramid-diagrams
www.conceptdraw.com/ solution-park/ marketing-pyramid-diagrams
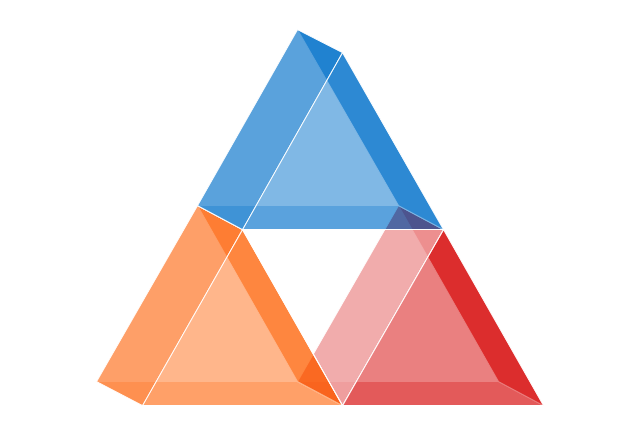
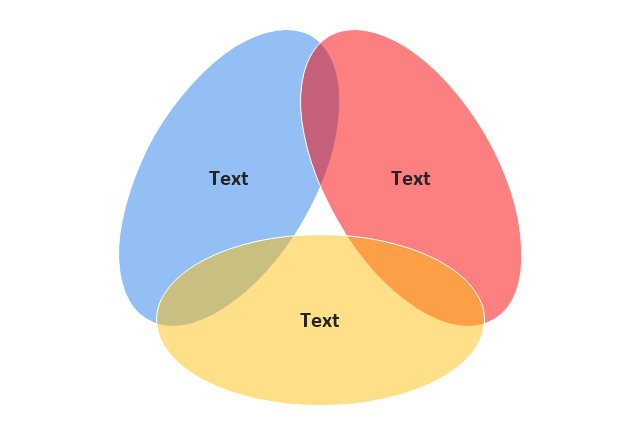
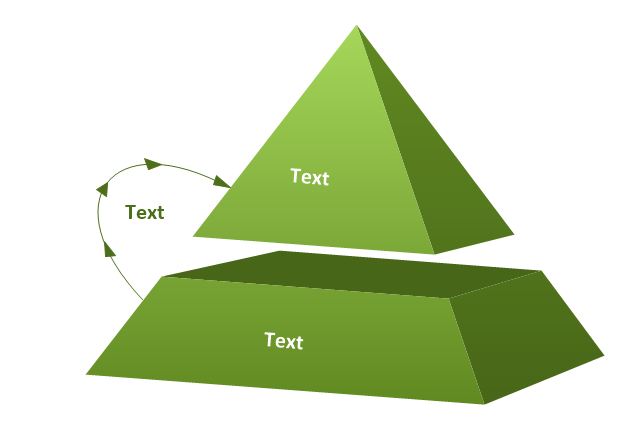
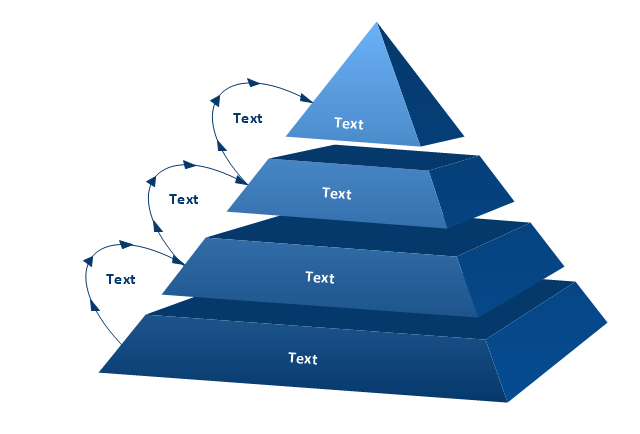
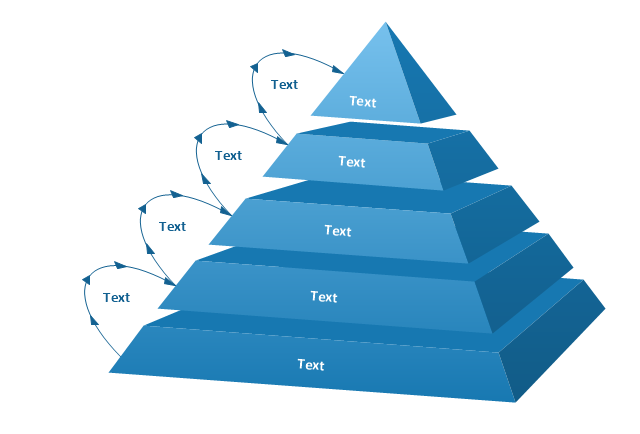
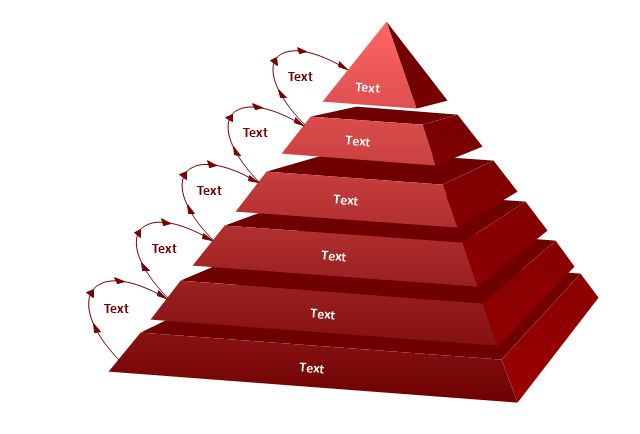
The vector stencils library "Pyramid diagrams" contains 28 templates of pyramid diagrams, triangle charts and triangular schemes.
Use these templates to create your pyramid diagrams in the ConceptDraw PRO diagramming and vector drawing software extended with the Pyramid Diagrams solution from the Marketing area of ConceptDraw Solution Park.
Use these templates to create your pyramid diagrams in the ConceptDraw PRO diagramming and vector drawing software extended with the Pyramid Diagrams solution from the Marketing area of ConceptDraw Solution Park.
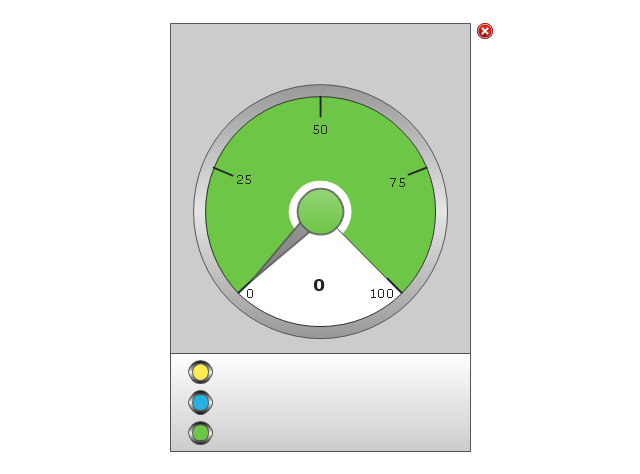
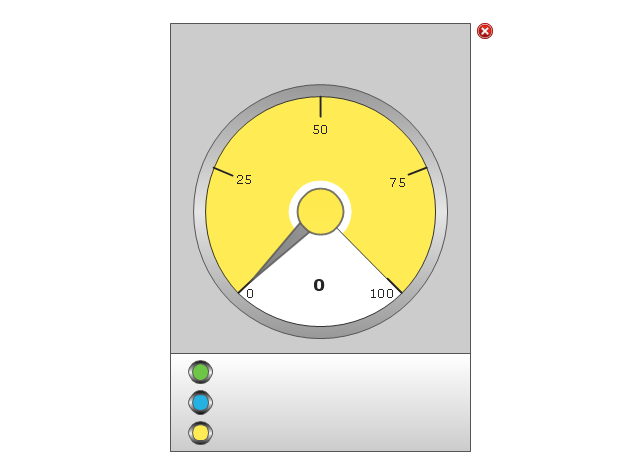
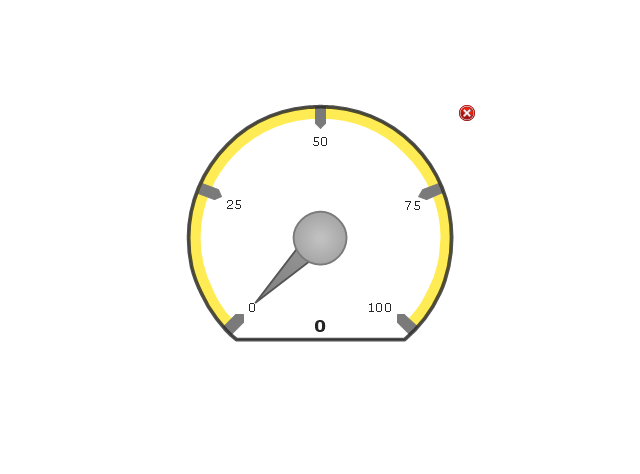
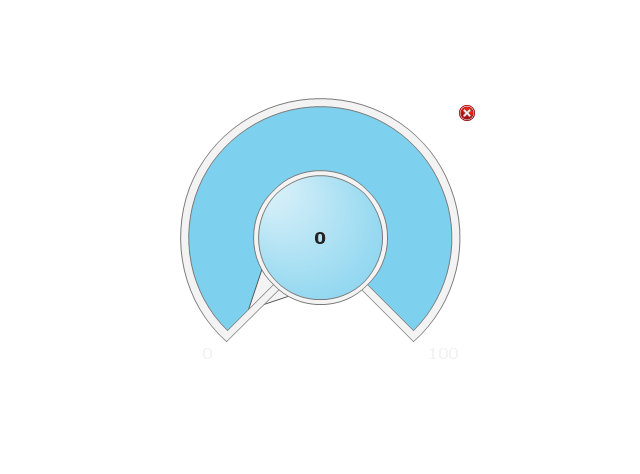
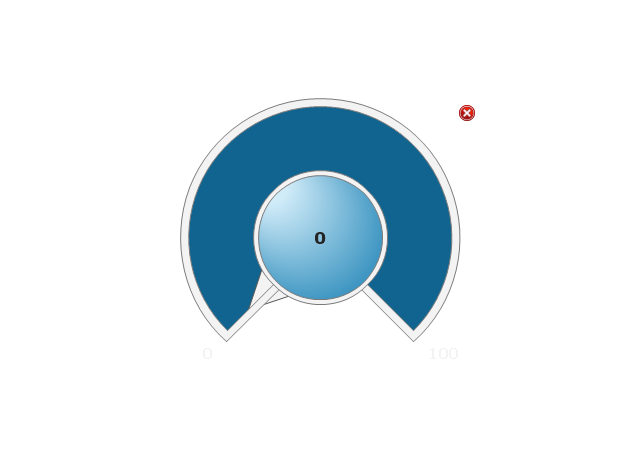
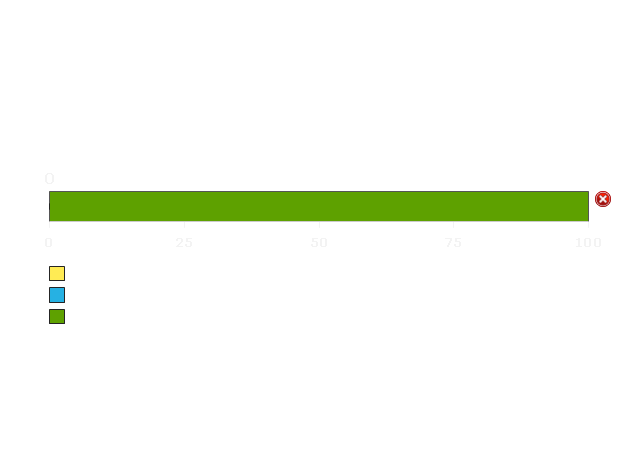
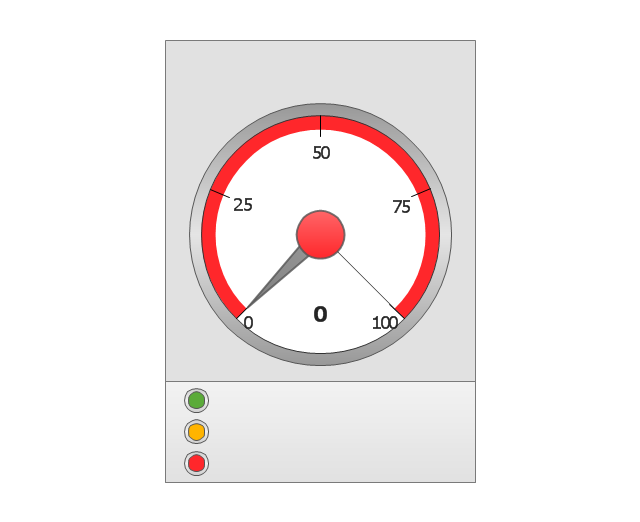
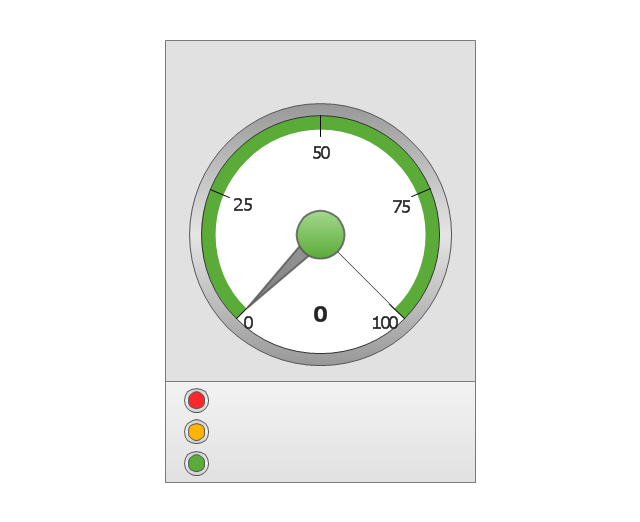
The vector stencils library "Meter indicators 2" (for dark background) contains 29 Live Objects: speedometer gauge, dial, bullet, slider and level meter visual indicators.
The Live Objects designed to display actual measures of performance metrics from external data source files. Some of them also display comparative measures, and colored zones of qualitative ranges with legend.
Use this library to create visual dashboards in the ConceptDraw PRO diagramming and vector drawing software extended with the Meter Dashboard solution from the area "What is a Dashboard" of ConceptDraw Solution Park.
HelpDesk
How to Operate a Multiple Main Idea on Your Mind Map
If you are using multiple Main Ideas your maps, it is necessary to know that there is a difference in behavior between the original primary Main Idea and the other Ideas you add.IDEF3 Standard
Use Case Diagrams technology. IDEF3 Standard is intended for description and further analysis of technological processes of an enterprise. Using IDEF3 standard it is possible to examine and model scenarios of technological processes.The vector stencils library "Pyramid diagrams" contains 28 templates of pyramid diagrams, triangle charts and triangular schemes.
Use these templates to create your pyramid diagrams in the ConceptDraw PRO diagramming and vector drawing software extended with the Pyramid Diagrams solution from the Marketing area of ConceptDraw Solution Park.
Use these templates to create your pyramid diagrams in the ConceptDraw PRO diagramming and vector drawing software extended with the Pyramid Diagrams solution from the Marketing area of ConceptDraw Solution Park.
HelpDesk
How to Draw a Pyramid Diagram in ConceptDraw PRO
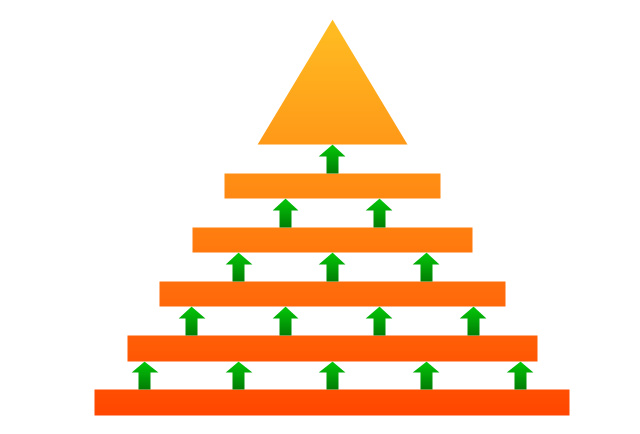
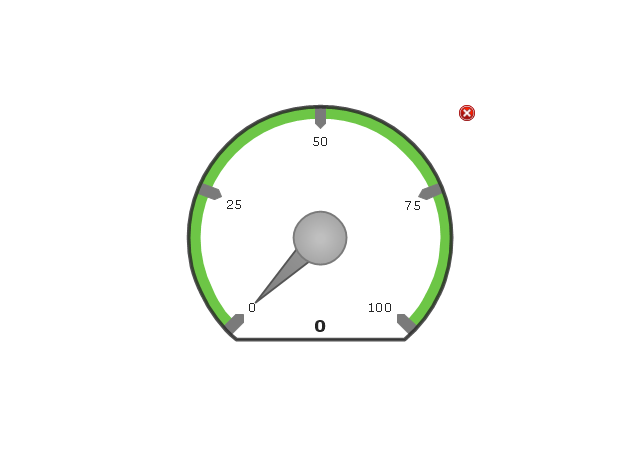
Pyramid diagram (triangle diagram) is used to represent data, which have hierarchy and basics. Due to the triangular form of diagram, each pyramid section has a different width. The width of the segment shows the level of its hierarchy. Typically, the top of the pyramid is the data that are more important than the base data. Pyramid scheme can be used to show proportional and hierarchical relationships between some logically related items, such as departments within an organization, or successive elements of any process. This type of diagram is often used in marketing to display hierarchical related data, but it can be used in a variety of situations. ConceptDraw PRO allows you to make a pyramid diagram, quickly and easily using special libraries.The vector stencils library "Meter indicators" contains 29 Live Objects: speedometer gauge, dial, bullet, slider and level meter visual indicators.
The Live Objects designed to display actual measures of performance metrics from external data source files. Some of them also display comparative measures, and colored zones of qualitative ranges with legend.
Use this library to create visual dashboards in the ConceptDraw PRO diagramming and vector drawing software extended with the Meter Dashboard solution from the area "What is a Dashboard" of ConceptDraw Solution Park.
- Level 3 Process Map
- Level 3 Dfd
- Dfd For Library Management System Upto Level 3
- Dfd Level 3 For Library Mgt System In SW Engg
- 3 Level Dfd
- 4 Level pyramid model diagram - Information systems types ...
- 4 Level pyramid model diagram - Information systems types | 5 Level ...
- 1st Level Dfd For Online Shopping
- 3 - Level 3D pyramid diagram - Template
- Dfd For Library From 3 Levels
- Pyramid Diagram and Pyramid Chart | 3 - Level 3D pyramid diagram ...
- 3 Level Dfd For Library Management System
- 4 Level pyramid model diagram - Information systems types
- 4-Set Venn diagram - Template | Pyramid Diagram | Defensive ...
- Level 3 Dfd For Supermarket App
- Pyramid Diagram | Management Information System Support To H R ...
- Pyramid Diagram | 25 Typical Orgcharts | Process Flowchart | 3 ...
- Pyramid diagrams - Vector stencils library | 2- Level 3D pyramid ...
- 1st Level Dfd Of Online Shopping
