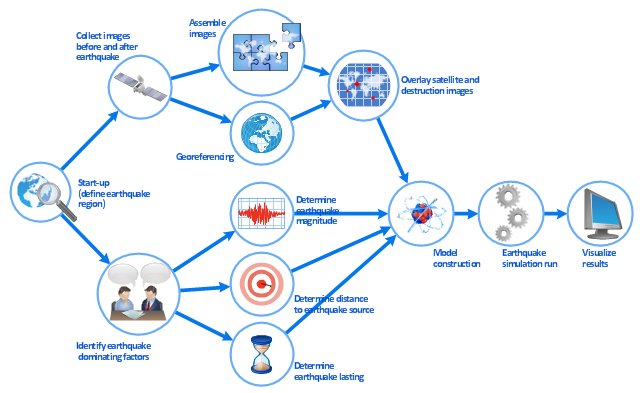
This work flow chart sample was redesigned from the picture "Simulation for earthquake disaster assessment" from the article "Simulation Workflows".
[iaas.uni-stuttgart.de/ forschung/ projects/ simtech/ sim-workflows.php]
" This simulation was developed to have an in depth understanding of the destructions and the decisions to be made in various phases of crisis management (Source: Mahdi Hashemi and Ali A. Alesheikh (2010). "Developing an agent based simulation model for earthquakes in the context of SDI." GSDI 12 World Conference. 19 – 22 October 2010. Singapour). The simulation process contains following major steps:
(1) All spatial information including satellite images (before and after the earthquake) and topographic/ cadastral maps of the area are mosaicked and georeferenced. The parts of the city that contain various levels of destructions are selected. Three types of features namely buildings, roads and recreational areas are classified and extracted from the satellite images.
(2) The governing factors of destructions are identified; a mathematical model that integrates the factors is constructed.
(3) The simulation is constructed for various parameter values (different earthquake strength, time elapses, etc.)" [iaas.uni-stuttgart.de/ forschung/ projects/ simtech/ sim-workflows.php]
The example "Workflow diagram - Earthquake disaster assessment" was drawn using the ConceptDraw PRO diagramming and vector drawing software extended with the Workflow Diagrams solution from the Business Processes area of ConceptDraw Solution Park.
DFD Library — Design elements
Data Flow Diagrams (DFD) solution from the Software Development area of ConceptDraw Solution Park provides plenty of predesigned templates, samples and DFD vector design elements proposed by three DFD libraries. These DFD library objects are designed to help you effectively model the data flows and functional requirements for the business processes or systems, to design the Process-oriented models or Data-oriented models, Data flowcharts and Data process diagrams, Structured analysis diagrams and Information flow diagrams. There are two different notations used to draw the Data Flow Diagrams (Yourdon & Coad and Gane & Sarson). These notations define the different visual representations for the processes, data stores, data flows, and external entities. ConceptDraw DIAGRAM software provides you with possibility of designing professional-looking Data Flow Diagrams, DFD Models, Data Flow Process Diagrams using any of these notations. Simply drag the predesigned DFD flowchart symbols from the appropriate library and connect by arrows depicting the data flow from one step to another.Block Diagram Software
The popularity of Block Diagrams grows day by day. The existence of powerful software for their design is an excellent news! ConceptDraw DIAGRAM Block Diagram Software offers the Block Diagrams Solution from the "Diagrams" Area.Taxi Service Data Flow Diagram DFD Example
This sample shows the Data Flow Diagram of the Taxi Service and interactions between the Clients, Operators and Divers, as well as Orders and Reports databases.Internet solutions with ConceptDraw DIAGRAM
ConceptDraw is a good means of visualization of information of any kind as it features powerful graphic capabilities. The conception of using ConceptDraw and open formats by the programs that work with Internet can be used for displaying any data and any structure in Internet.- Earthquake disaster assessment - Workflow diagram | Context Level ...
- Earthquake disaster assessment - Workflow diagram | Work Flow ...
- Earthquake disaster assessment - Workflow diagram | Workflow ...
- Earthquake disaster assessment - Workflow diagram | Business ...
- Pyramid Diagram | Types of Flowcharts | Pyramid Diagram | Three ...
- Earthquake disaster assessment - Workflow diagram | Model ...
- Earthquake disaster assessment - Workflow diagram | Workflow ...
- Draw The Three Level Model Type Of Decision Taken At Different
- Workflow diagram - Weather forecast | Earthquake disaster ...
- Earthquake disaster assessment - Workflow diagram | Emergency ...
- Process Flowchart | Earthquake disaster assessment - Workflow ...
- Earthquake disaster assessment - Workflow diagram | Marketing ...
- Context Diagram For Booking Site
- Earthquake disaster assessment - Workflow diagram | Types of ...
- Types of Flowchart - Overview | Basic Flowchart Symbols and ...
- Earthquake disaster assessment - Workflow diagram | Cloud clipart ...
- Earthquake disaster assessment - Workflow diagram | Army Flow ...
- Types of Flowchart - Overview | Earthquake disaster assessment ...
- Earthquake disaster assessment - Workflow diagram | IDEF0 ...
- Earthquake disaster assessment - Workflow diagram | Block ...


