HelpDesk
How to Diagram Sentences in ConceptDraw PRO
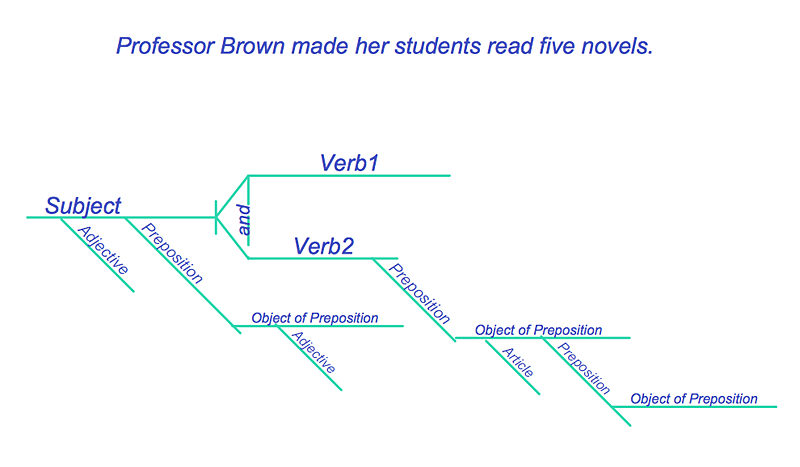
Diagramming sentences is a playful, fun way to learning English Grammer. Sentences can be very complex, and can contain many different parts of speech which implicate many different grammatical rules. Diagramming sentences will help you to make sure every parts of your sentence are grammatically correct, and provides you with more comprehensive understanding of the English Language. A Sentence Diagram displays the parts of a sentence as a diagram in order to show the relationship of words and groups of words within the sentence. Sentence Diagram shows the relationship between the proposal of its parts. This is a good way to teach grammar! Sentence Diagram helps to make the writing more coherent as well as more interesting to read. ConceptDraw PRO allows you to create clear sentence diagrams using the special templates and vector stencils library.
 Plumbing and Piping Plans
Plumbing and Piping Plans solution extends ConceptDraw PRO v10.2.2 software with samples, templates and libraries of pipes, plumbing, and valves design elements for developing of water and plumbing systems, and for drawing Plumbing plan, Piping plan, PVC Pipe plan, PVC Pipe furniture plan, Plumbing layout plan, Plumbing floor plan, Half pipe plans, Pipe bender plans.
HelpDesk
How to Draw a Circular Arrows Diagram Using ConceptDraw PRO
The cyclic recurrence is a fundamental property of multiple systems. The cycle is a process which consists from elements (phases, stages, stages) following each other. Many processes in astronomy, biology, chemistry, physics, mathematics, etc. have a cycle properties. It is also widely used in information technologies and marketing analysis. Graphical representation of cyclic processes can have many forms. It can be a circle, parabola, hyperbola, ellipse and others. A Circular Arrows Diagram is used as one of the statistical charts in the business, mass media and marketing. ConceptDraw PRO provides its users tools for making easy drawing Circular Arrows Diagrams.HelpDesk
How to Draw a Line Chart Quickly
A common line chart is a graphical representation of the functional relationship between two series of data. A line chart that is created by connecting a series of data points together with a straight line is the most basic type of a line chart. A line chart can be used for depicting data that changes continuously over time. It is extensively utilized in statistics, marketing and financial business. ConceptDraw Line Graph solution provides the possibility to make 2D line charts quickly and effortlessly.- Design And Draw A Line Plan Of Bank
- Line Plan Diagram Of Primary School
- Single Line Plan Of Bank On Graph
- Library Line Plan Diagram
- Single Line Plan Of A Bank
- Line Plan Canteen Building
- Line Diagram Plan For Bank
- Single Line Plan For Bank
- Line Plan Diagram Of Bank Building
- Drawing Of Building By Line Diagram
- Line Plan Of Canteen Image
- Line Graphs | Plumbing and Piping Plans | Process Flowchart | Bank ...
- Line Diagram Plan For School
- Plumbing and Piping Plans | Process Flowchart | Line Graphs | Line ...
- Entity-Relationship Diagram (ERD) | Food trailer water supply | Line ...
- Single Line Diagram Electriccal Network Android
- Data Flow Diagram | Site Plans | Business and Finance | Line Plan ...
- Simple Line Plan For Bank
- What Line Diagram Plan
- Floor Plan Of A Restaurant With Single Line Diagram


