Data Flow Diagram (DFD)
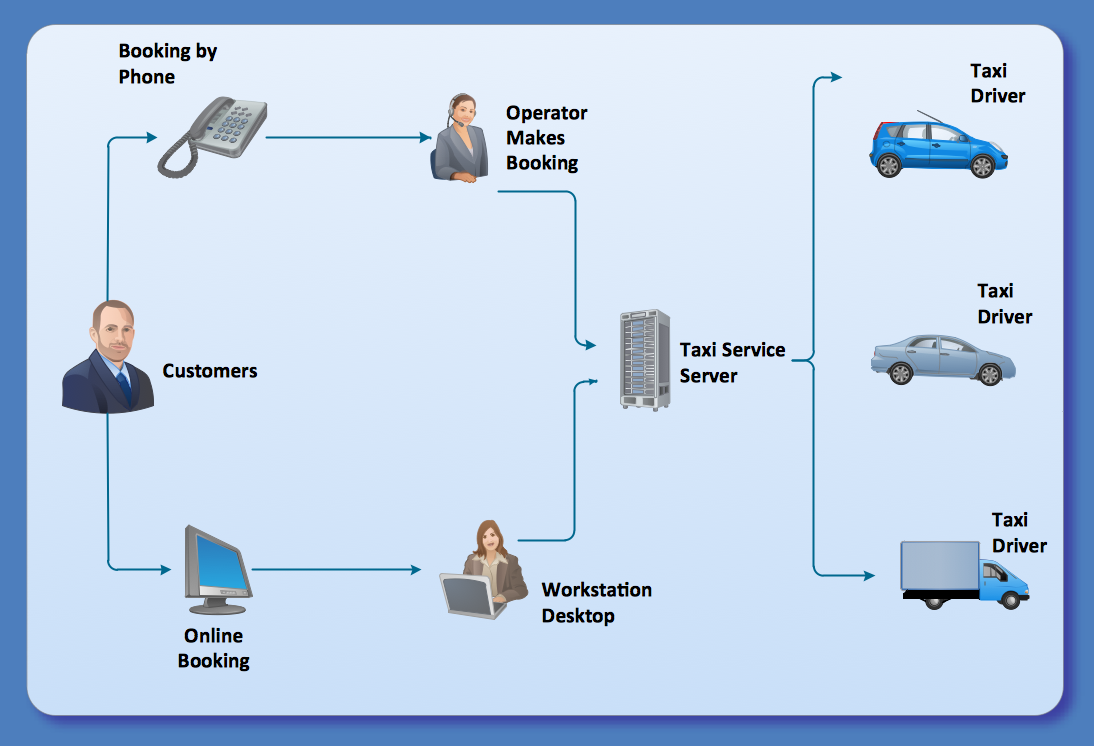
A Data Flow Diagram (DFD) illustrates the flow of data through an information system, visualizes how the information is handled in terms of inputs and outputs, how the data enter to system and leave it. It is effective to use a Data Flow Diagram for creation the system's overview, to show the system's scope and boundaries. There are two different types of notations for DFDs: Yourdon-Coad and Gane-Sarson, which differ in visual representations for processes, data flow, data stores, external entities, etc. Thus, for example the processes are depicted as circles in Yourdon-Coad notation and as rounded squares in Gane-Sarson notation. Gane-Sarson notation is usually used for visualization information systems and Yourdon-Coad - for system analysis and design. The Data Flow Diagrams solution included to Software Development area of ConceptDraw Solution Park offers a lot of DFD templates, samples and examples, libraries of vector stencils for construction without efforts the DFDs according to both Gane-Sarson and Yourdon-Coad notations.Types of Flowchart - Overview
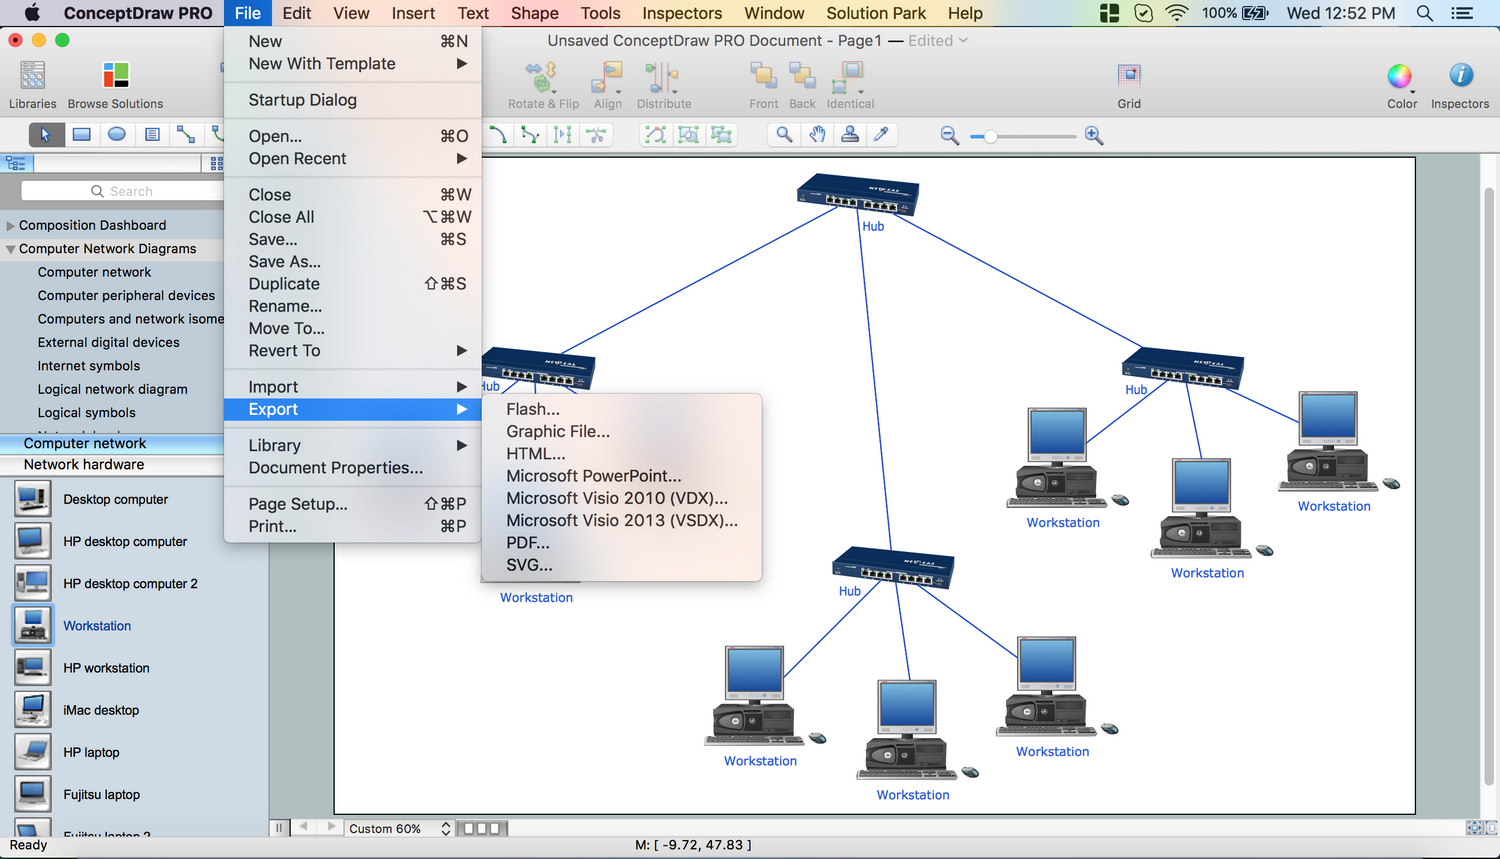
When designing a process or an instruction in clear and understandable way, you should consider creating a flowchart. You can avoid spending a lot of time understanding complex concepts as they get clear with different diagrams. The flowcharts are very popular diagram type, they are useful at different fields from the description business processes to the presentation of cooking recipes. Basic Flowchart, Business Process Modeling Diagram, Process Flowchart, Cross Functional Flowchart, Procedure Flowchart, Data Flow Diagram, IDEF Flowchart, SDL Diagram, Workflow Diagram, Document Flowchart, Program Flowchart, Value Stream Map, System Flowchart, Highlight Flowchart, Sales Flowchart are the main types flowchart. The ConceptDraw PRO is one of the professional applications which has great advantages and using which you can create different types of Flowcharts easy and fast. Try to draw an illustrative and comprehensible diagram in ConceptDraw PRO describing the processes instead of writing complex long text and make sure how it is convenient. Visio is expensive, and if you use it in a team environment, these costs are compounded. ConceptDraw PRO is an affordable alternative to Visio and luckily, it comes with a team plan. ConceptDraw PRO can import and export Visio files, so Mac users can collaborate with PC users stuck on Microsoft's software.
UML Diagram Types List
Two types of diagrams are used in UML: Structure Diagrams and Behavior Diagrams. Behavior Diagrams represent the processes proceeding in a modeled environment. Structure Diagrams represent the elements that compose the system.Workflow Diagram Software
ConceptDraw PRO is workflow diagram software enhanced by numerous extentions from ConceptDraw Solution Park. It inludes many professional workflow diagrams, examples and ready to use workflow diagram and workflow symbols. Workflow symbol collections include symbols for Processes, Planning, Scheduling, Flow Control, In-Transit Process Visibility. The best workflow diagram software you may find is ConceptDraw PRO. ConceptDraw PRO is world-known diagramming software that works for both Windows and Mac OS X platforms. The software contains complete set of features allows to draw diagrams faster. ConceptDraw PRO extended with the Workflow Diagram solution provides additional libraries, templates and samples for drawing professional workflow diagrams.IDEF3 Standard
Use Case Diagrams technology. IDEF3 Standard is intended for description and further analysis of technological processes of an enterprise. Using IDEF3 standard it is possible to examine and model scenarios of technological processes.The Best Business Process Modeling Software
ConceptDraw PRO is a best business processes modeling software for graphical documenting processes of the company. ConceptDraw has 142 vector stencils in the 8 libraries that helps you to start using Diagramming Software for designing own Business Process Diagrams.
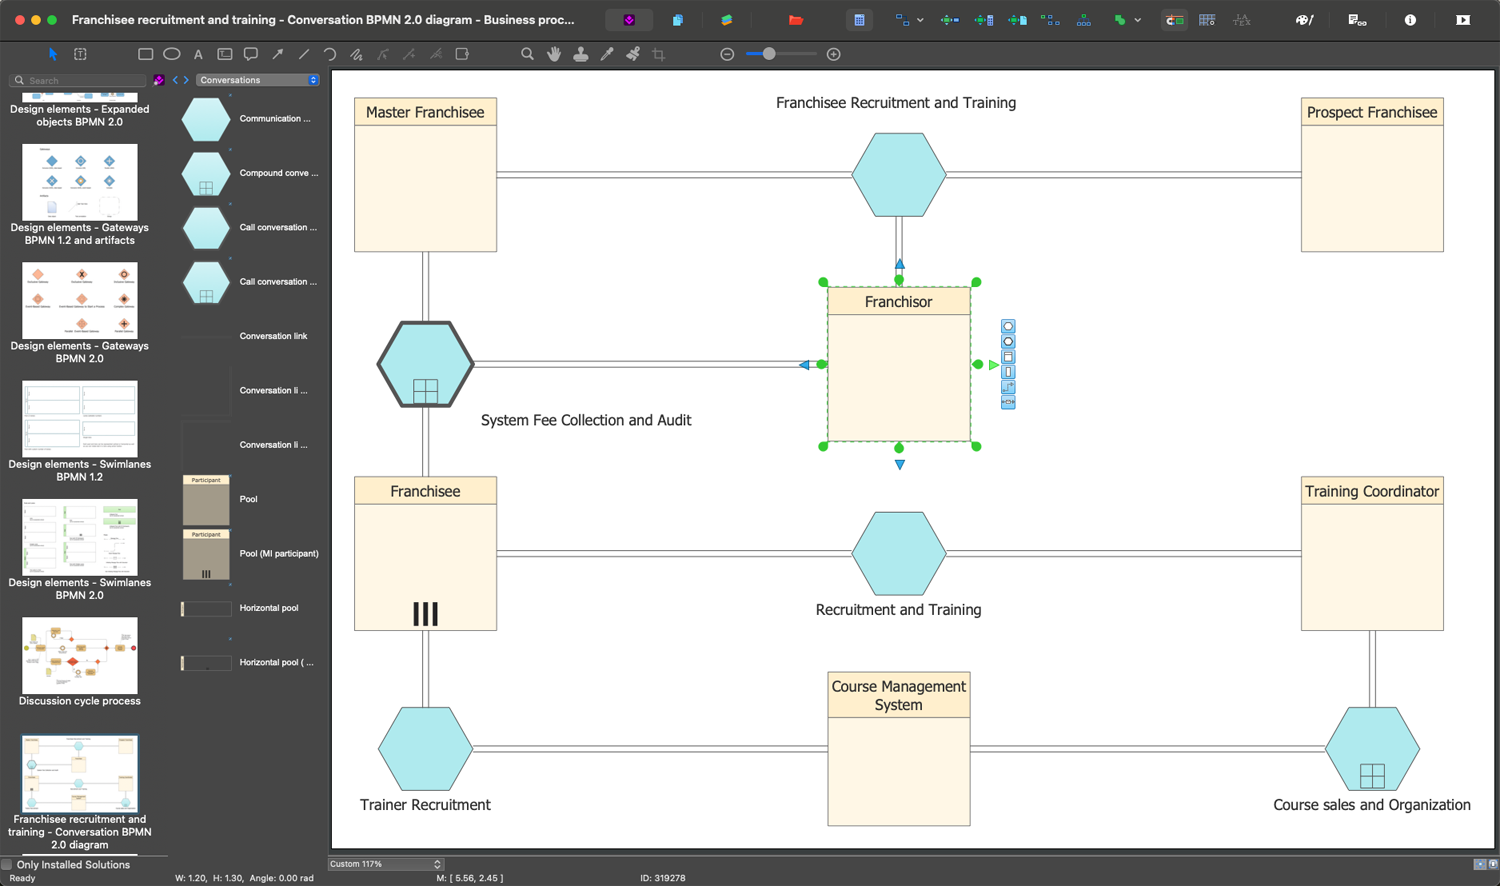
BPMN 2.0
ConceptDraw PRO diagramming and vector drawing software offers the Business Process Diagram Solution from the Business Processes Area of ConceptDraw Solution Park with powerful tools to help you easy represent the business processes and create the business process diagrams based on BPMN 2.0 standard.ConceptDraw Arrows10 Technology
You can see that when you rotate a group, connectors change their angle, keeping their position inside of the grouped objects. If you decide to ungroup the objects, the connectors will adjust to keep lines parallel to the edges of the sheet. The magic of ConceptDraw Arrows10’s rotating group containing connectors, makes complex diagramming simple and easy. The way to connect objects has never been easier.Total Quality Management Definition
The Total Quality Management Diagram solution helps you and your organization visualize business and industrial processes. Create Total Quality Management diagrams for business process with ConceptDraw software.Model Based Systems Engineering
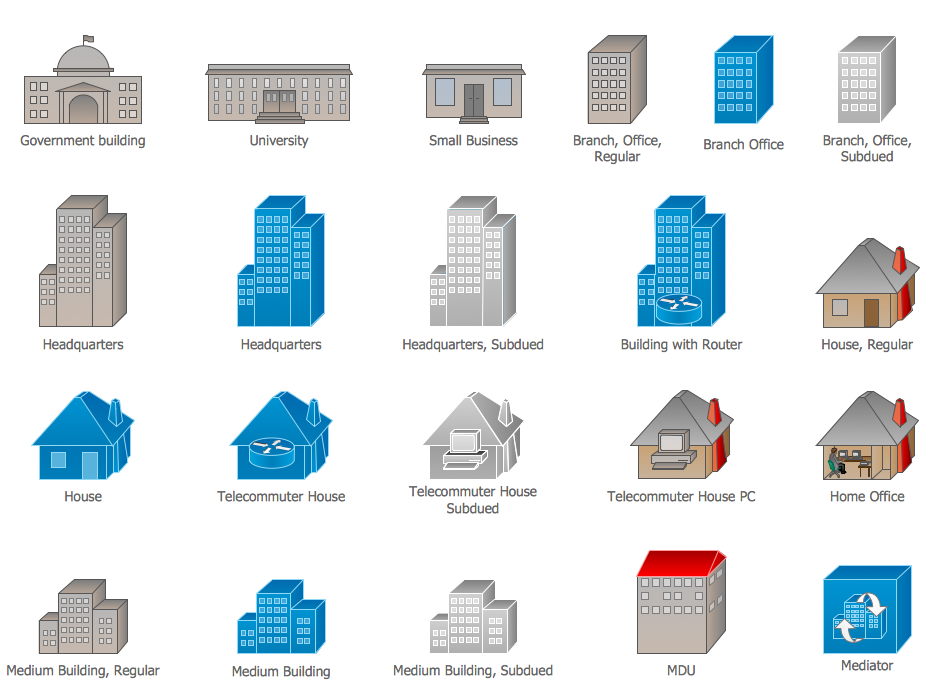
ConceptDraw PRO is a professional diagramming and vector drawing software. Now, enhanced with SysML Solution from the Software Development Area of ConceptDraw Solution Park, ConceptDraw PRO became an ideal software for model based systems engineering (MBSE).Cisco Buildings. Cisco icons, shapes, stencils and symbols
Cisco icons are globally recognized and generally accepted as standard for network icon topologies. The ConceptDraw vector stencils library "Cisco buildings" contains 21 symbols for drawing the computer network diagrams using the ConceptDraw PRO diagramming and vector drawing software.Electrical Symbols, Electrical Schematic Symbols
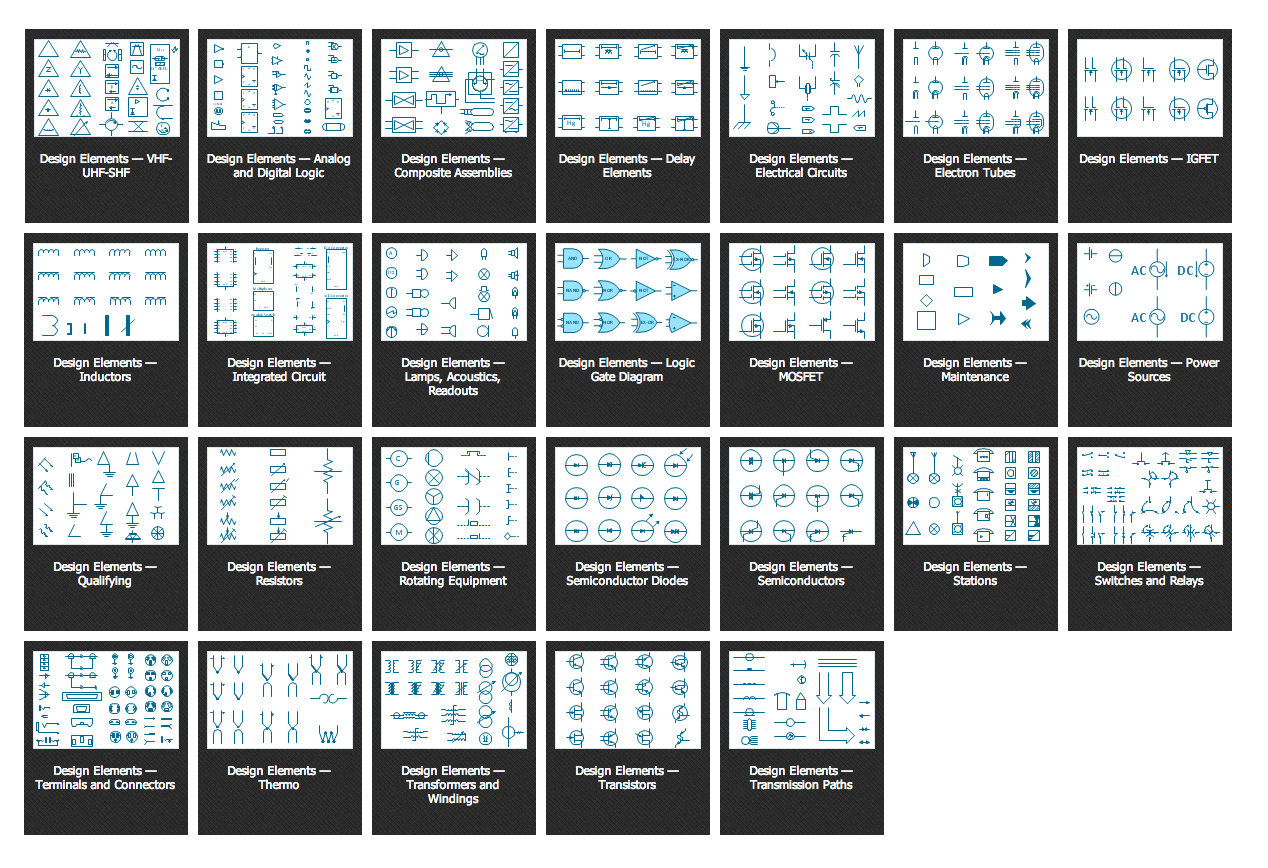
Electrical Schematics and Electrical Circuit Diagrams are included to the number of obligatory diagrams and documents while developing the package of construction documentation for the building project. It is comfortable to use the special drawing software for designing diagrams of this type. ConceptDraw PRO diagramming and vector drawing software extended with Electrical Engineering solution from Industrial Engineering Area of ConceptDraw Solution Park provides the powerful drawing tools, a lot of specific samples and templates, and numerous libraries with incredibly large quantity of predesigned electrical schematic symbols, including analog and digital logic electrical symbols, electrical circuits symbols, inductors, power sources, lamps, resistors, transistors, delay elements, switches and relays, terminals and connectors, and many other useful electrical symbols, which will be helpful for easy designing professional looking Electrical Schematics, Electrical Engineering Diagrams, Circuit and Wiring Diagrams, Power Systems Diagrams, Digital and Analog Logic Schematics.UML Composite Structure Diagram. Design Elements
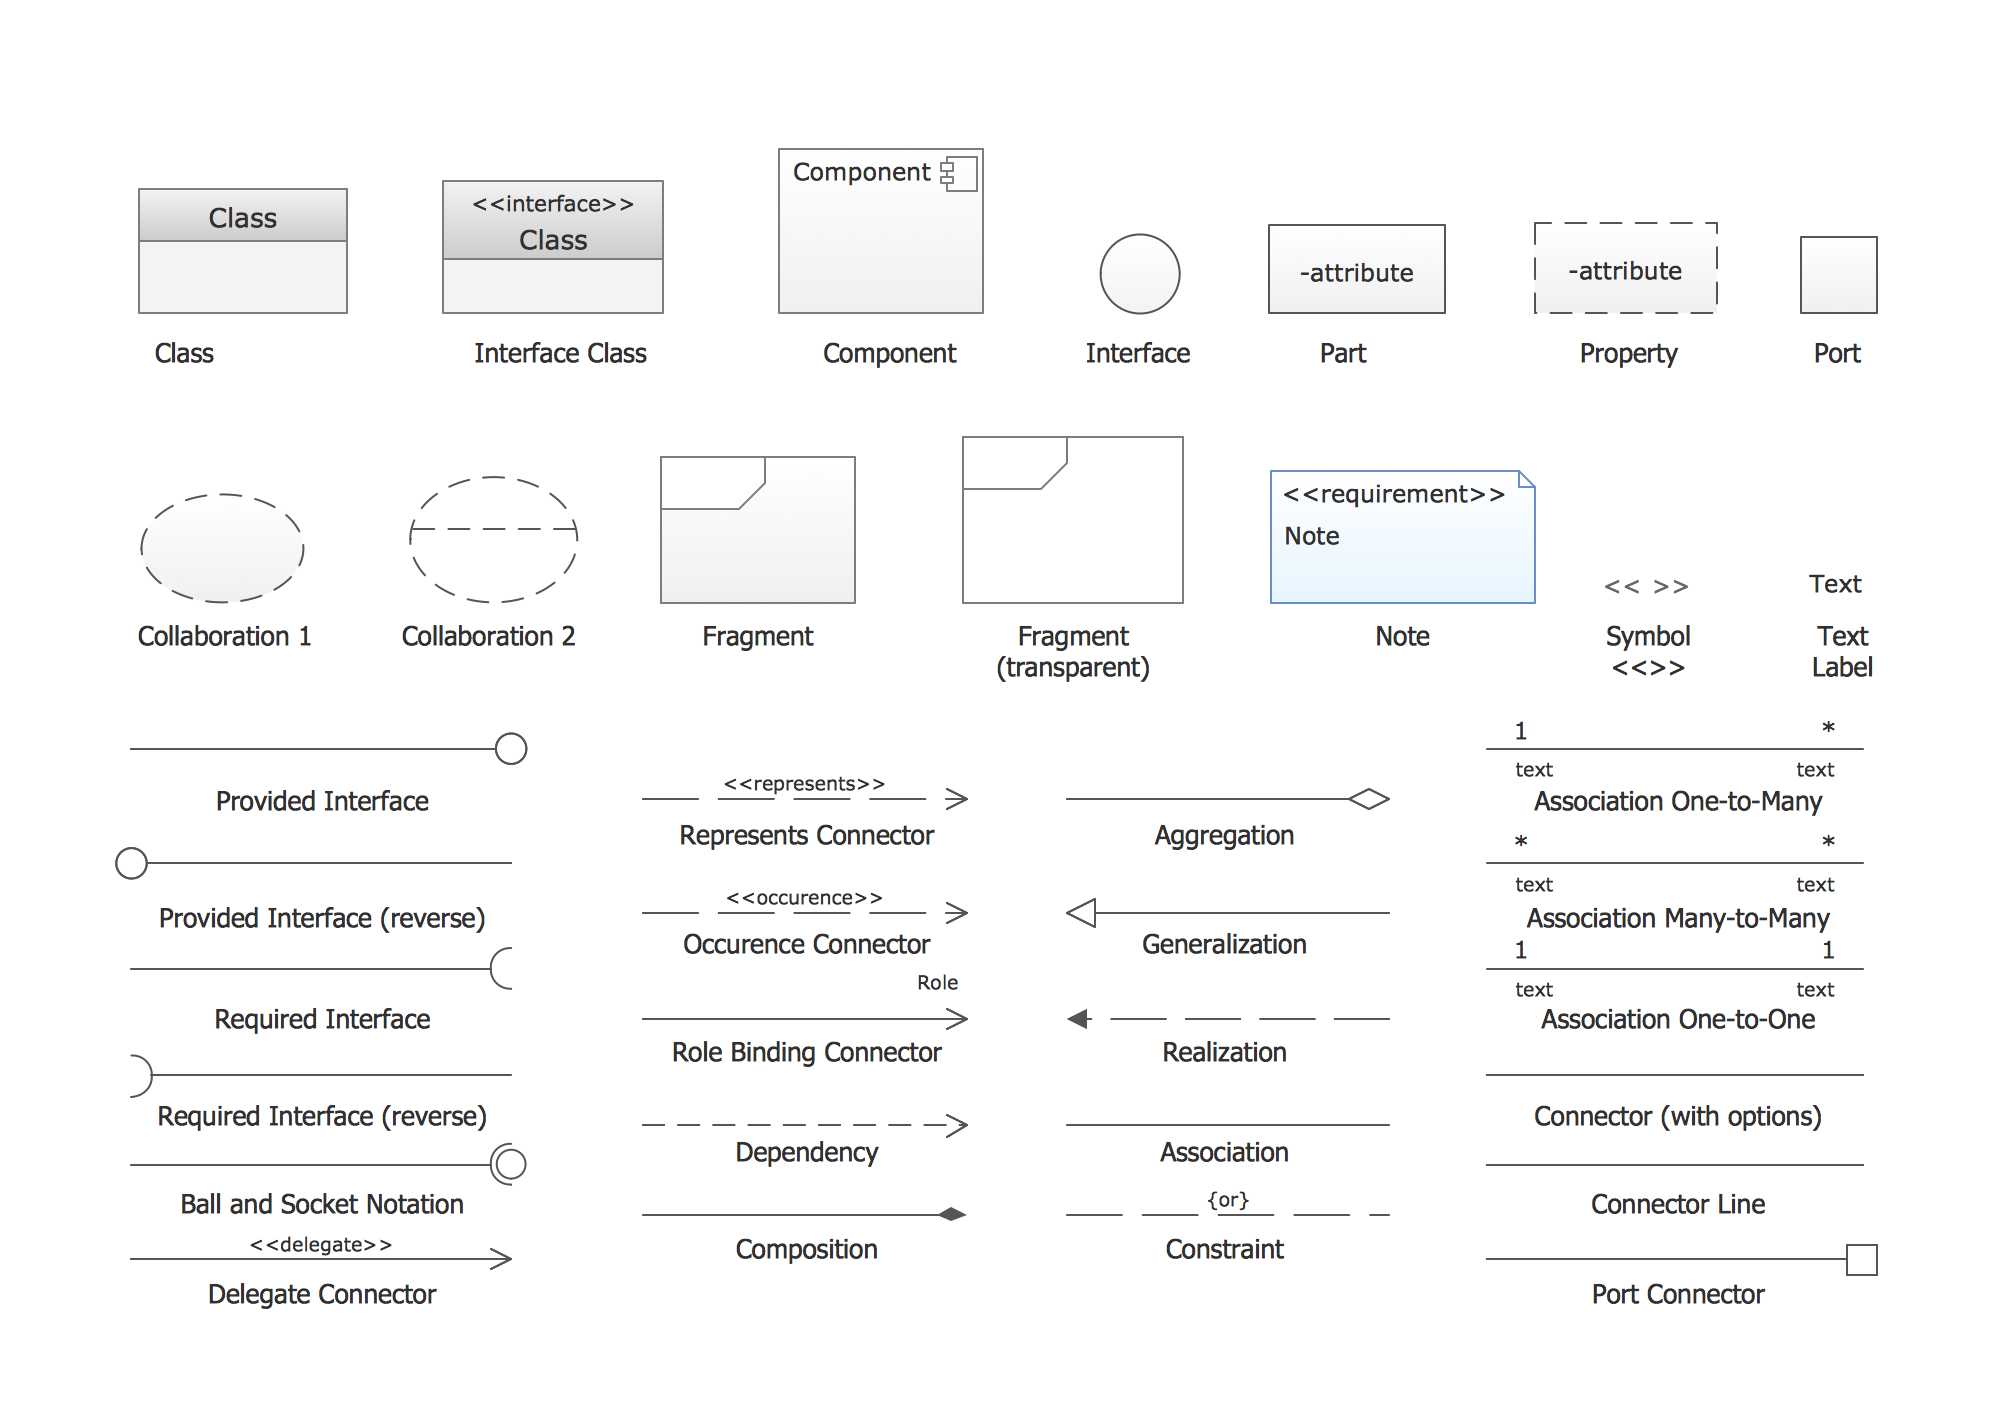
UML Composite Structure Diagram shows the internal structure of a class and the possible interactions at this structure. ConceptDraw has 393 vector stencils in the 13 libraries that helps you to start using software for designing your own UML Diagrams. You can use the appropriate stencils of UML notation from UML Composite Structure library.Workflow Application
ConceptDraw PRO application is perfect for creating workflow diagrams. This application contains specific features and technologies designed to draw diagrams faster, such as RapidDraw and Arrows10. ConceptDraw PRO software extended with the Workflow Diagrams solution gives you a flexible tool to draw any kind of workflow.Network Topology Mapper
Network Topology in communication networks, a topology is a usually schematic description of the arrangement of a network, including its nodes and connecting lines. There are two ways of defining network geometry: the physical topology and the logical topology. Network Topology Mapper offers extensive drawing tools professional-looking network diagrams quickly and easily allowing you to clearly represent and communicate network architecture, topology, and design to engineers, stakeholders and end-users.- Data flow Model Diagram
- Data Modeling Diagram | Structured Systems Analysis and Design ...
- Taxi Service Data Flow Diagram DFD Example | Last resort hotel ...
- Data Flow Diagram | Taxi Service Data Flow Diagram DFD Example ...
- Circuits and Logic Diagram Software | Process Flowchart | UML ...
- Gane Sarson Diagram | Process Flowchart | Taxi Service Data Flow ...
- Diagram Showing Flow Of Information Between Client And Database
- UML Class Diagram Notation | Business Process Modeling Notation ...
- Data Flow Diagram | Data structure diagram with ConceptDraw PRO ...
- Booch OOD Diagram | Object-Oriented Development (OOD) Method ...
- Example of DFD for Online Store (Data Flow Diagram ) DFD ...
- Functional Block Diagram | Process Flowchart | Program Structure ...
- UML Block Diagram | About UML | Software and Database Design ...
- UML Use Case Diagram Example - Taxi Service
- Data Flow Model Diagram
- State Diagram Example In Digital Logic Design
- Behavioral Uml Diagrams
- Booch OOD Diagram | Object-Oriented Development (OOD) Method ...
- Program Structure Diagram | Structured Systems Analysis and ...
- UML Use Case Diagram Example - Taxi Service | UML Diagram ...


