HelpDesk
How to Track Your Project Plan vs. the Actual Project Condition
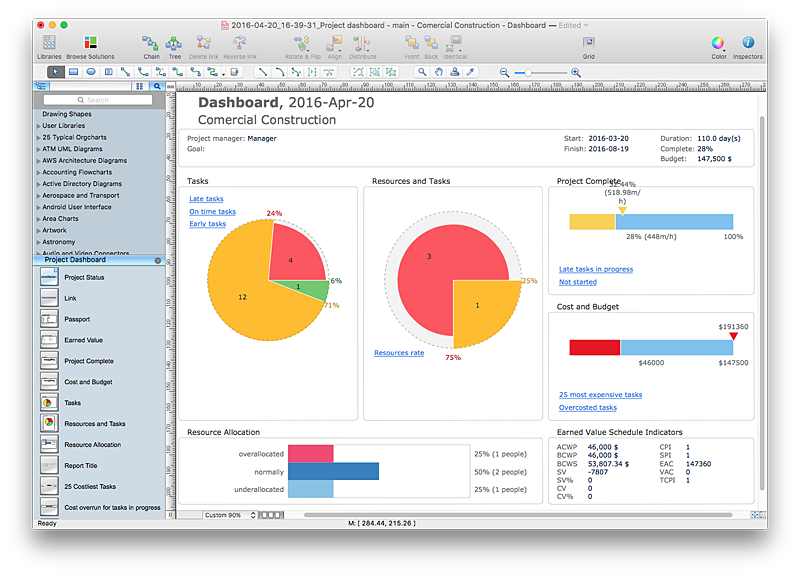
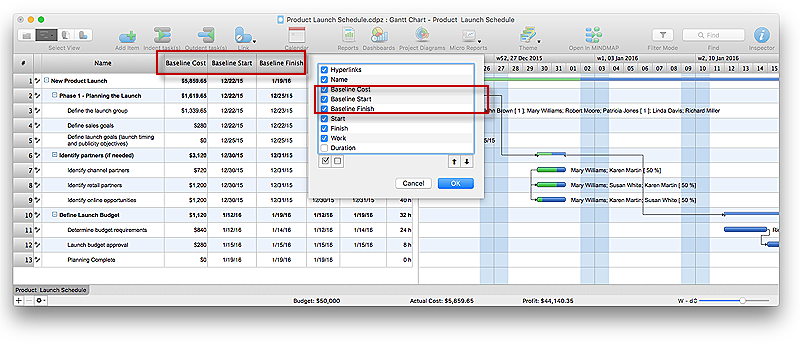
Conceptdraw PROJECT allows to follow how the project is going. You can easily compare the actual project data with the planned ones. The best tool for effective tracking of the project execution is to compoare real data with project baseline. It consists from the baseline start, baseline finish and baseline cost. Along with Baseline tracking ConceptDraw PROJECT offers several types of visual reports that can help to assess visually the difference between planned and actual project data.HelpDesk
How to Plan and Allocate Resources in Your Project with ConceptDraw PROJECT for Windows
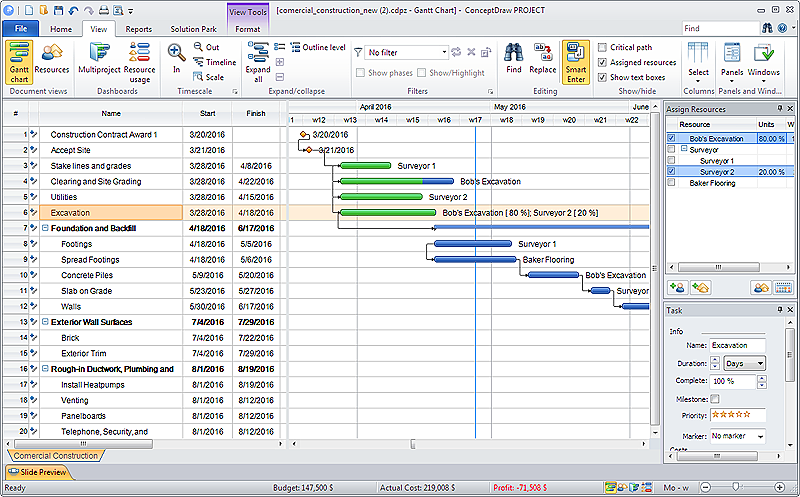
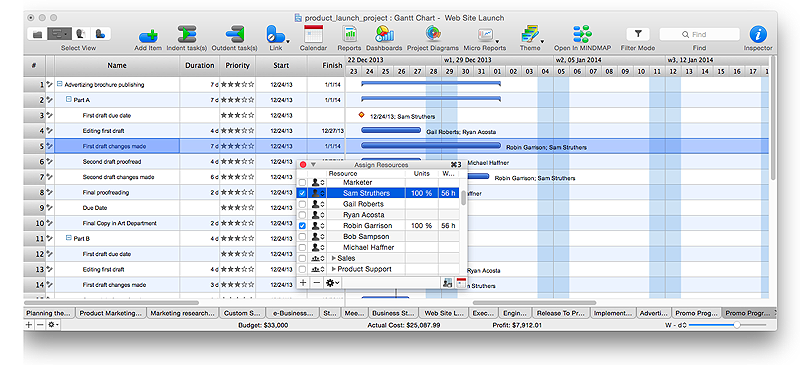
Effective resource management is a key factor in the successful project implementation. The common types of resources for which the project manager has an impact, include material resources (materials, energy), staff (work) and equipment. CoceptDraw PROJECT provides easy ways to project Resources Management: Create a list of project resources and assign the right human resource, as well as the necessary material, or equipment to be used.HelpDesk
How to Customize the Columns in Your Project File
Some ConceptDraw PROJECT users need to start new projects from their custom default page. In this post we tell you how to make it.HelpDesk
How to Set a Project Baseline Using ConceptDraw PROJECT
Project baseline in ConceptDraw PROJECT is excellent forguiding the execution of the current project and can be useful for further projects.HelpDesk
How to Create Project Diagrams on Mac
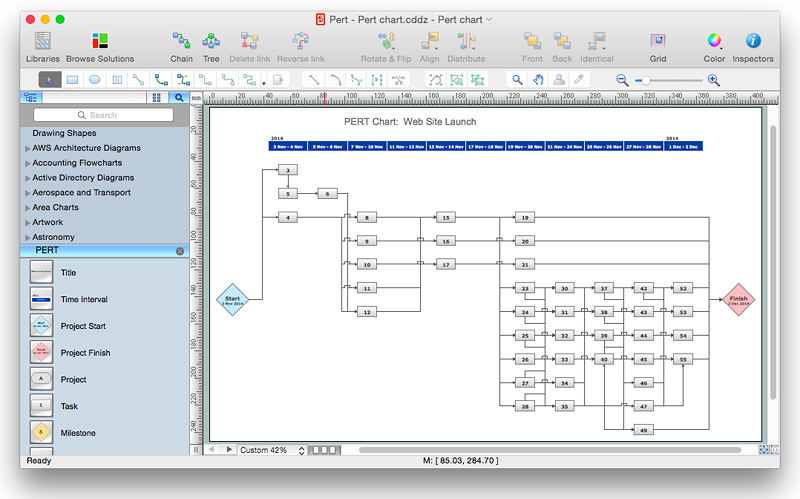
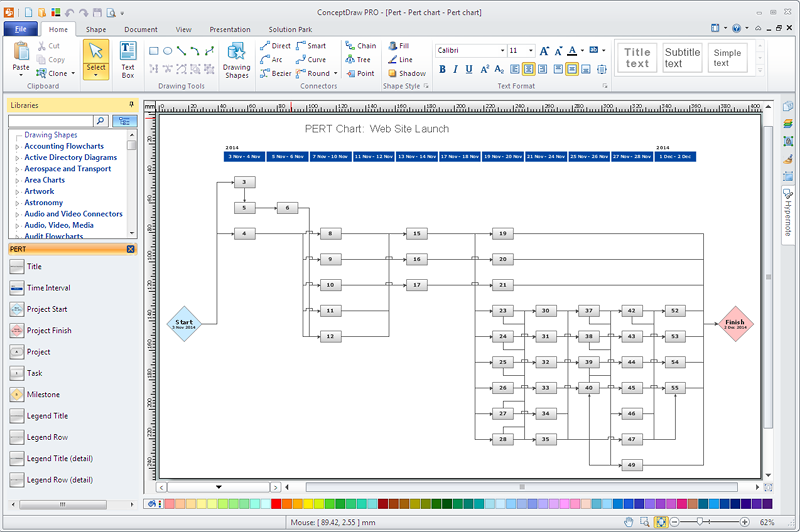
Diagrams are very useful for project implementation because they help teams visualize important details such as interrelations between tasks, critical paths, timelines, milestones, calendars, and also resource usage.HelpDesk
How to Shift Dates in ConceptDraw PROJECT
A way to shift all dates in a project a specified period, so you can use old project schedules as a template for new schedulesHelpDesk
How to Create a Gantt Chart for Your Project
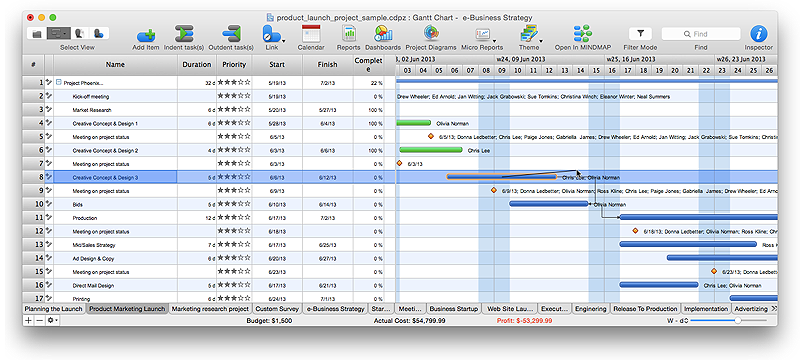
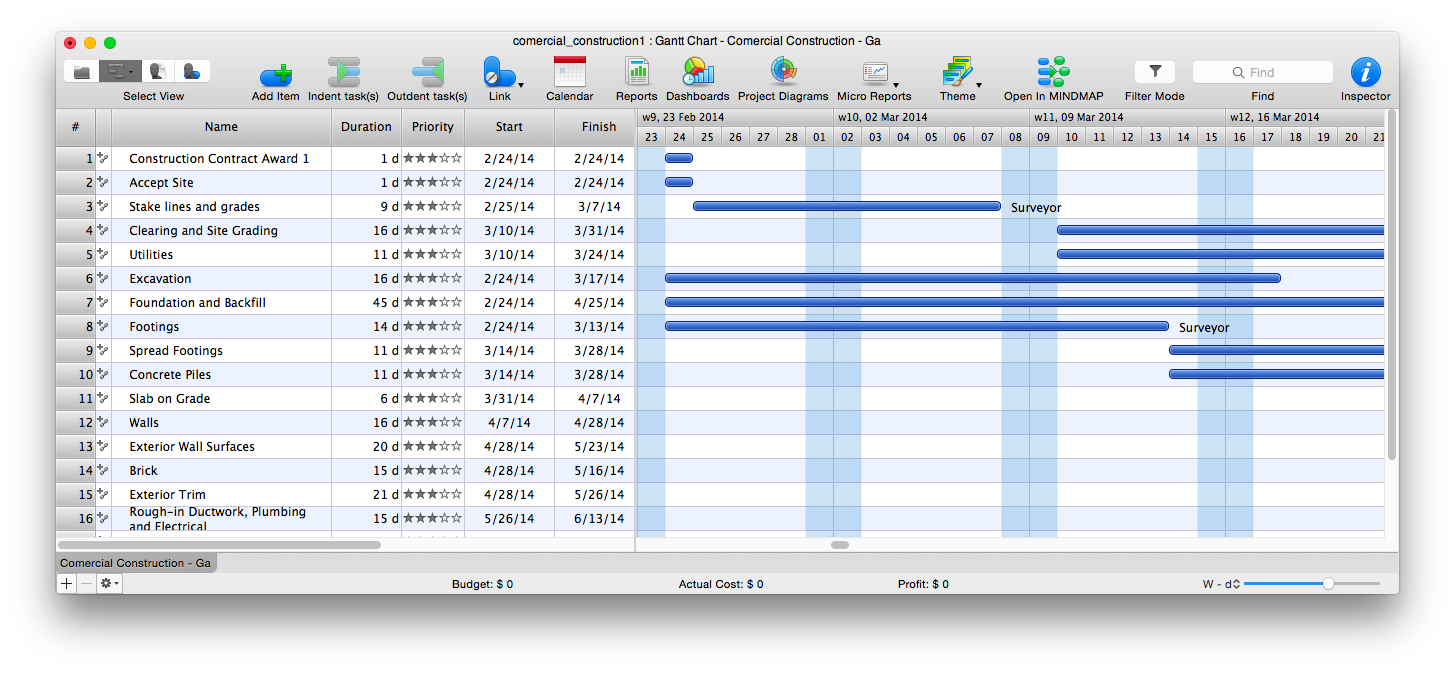
Instruction on how to create Gantt chart using ConceptDraw PROJECT software.Gant Chart is a graphical representation of tasks as segments on a time scale. It helps plan or overlapping.
HelpDesk
How to Plan and Allocate Resources in Your Project on Mac
CoceptDraw PROJECT provides easy ways to project Resources Management: Create a list of project resources and assign the right people to tasks, as well as the necessary materials to be used.HelpDesk
How to Customize a Task’s Duration
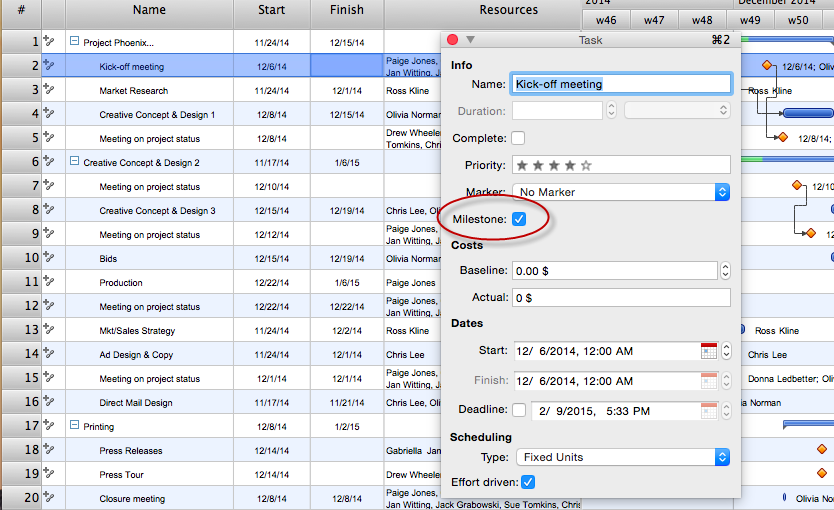
When you create an automatically scheduled task, ConceptDraw PROJECT assigns it duration of one day by default. You need modify that duration to reflect the real amount of time that the task requires.HelpDesk
What Information to be Displayed in the ConceptDraw PROJECT Gantt Chart View
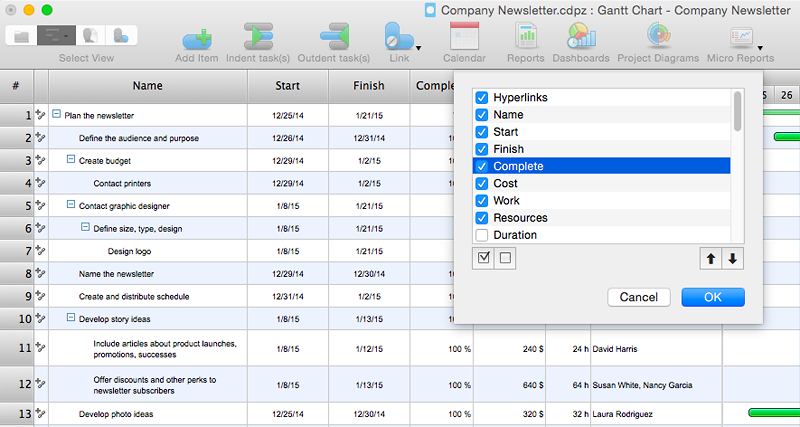
What information can can contain the project task list? Gantt Chart view is a graphical representation of a project outline that allows one to allocate tasks.You can customize a project’s tasks list view to include the columns you need to meet your information requirements. The columns of the ConceptDraw PROJECT Gantt view contain the information you want to capture about each task in your project. The following article details what information can be contained in the columns of a project outline:<
HelpDesk
How to Change the Working Time in a Project
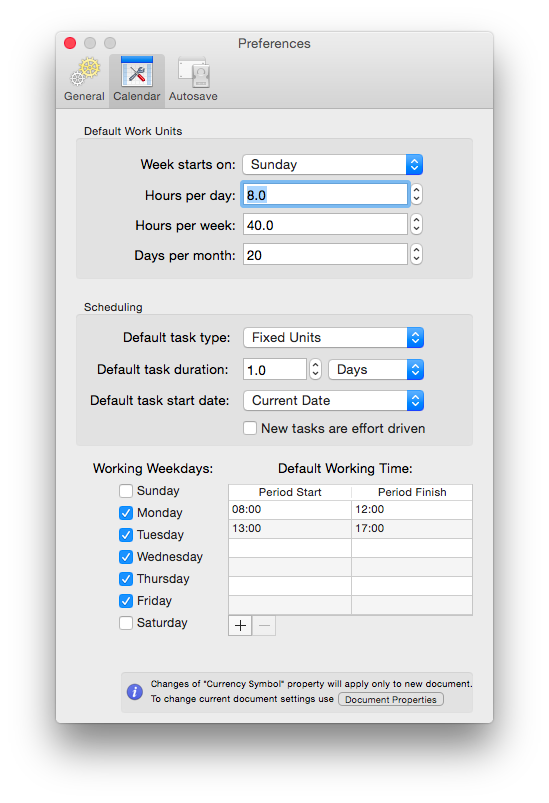
Project calendar determines working and non-working time of the project. It is used as a base to the project schedule development. There two types of project calendars: Project Calendar - which sets the working time for the whole project; and the Resource Calendar- which sets the working time of the particular project resource. The following article describes how to change the default calendar in ConceptDraw PROJECT.HelpDesk
How to Import Project Data From MS Excel Worksheet
You can import information into the project from MS Excel workbook using the entered fields - fields in which you can enter or edit information as opposed to calculated fields.HelpDesk
How to Export Project Data to MS Excel Worksheet
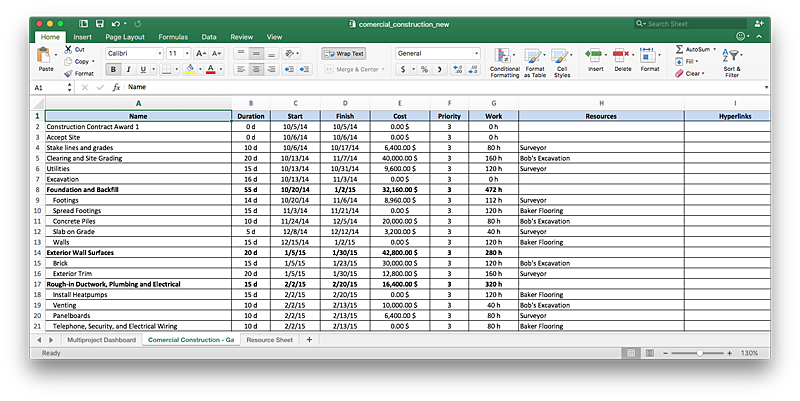
You can share your ConceptDraw PROJECT files with colleagues who use MS Excel®using the export capabilities of ConceptDraw PROJECT.HelpDesk
How to Create Project Diagrams on PC
Visual diagrams gives the ability to view at a detailed level project attributes such as project scope, logical connections in the project, critical paths, key events on the timeline, milestones, tasks, calendars for work, and resource utilization.- Construction Project Chart Examples | Project Management Area ...
- How to Track Your Project Plan vs . the Actual Project Condition ...
- Cross-Functional Flowchart (Swim Lanes) | Auto Pie Chart Maker ...
- Gantt Chart Software | Construction Project Chart Examples | Gantt ...
- Project Management Planned Vs Actual
- PM Dashboards | How to Track Your Project Plan vs . the Actual ...
- Project planning process - Flowchart | How to Customize the Default ...
- Seven Management and Planning Tools | Property Management ...
- PM Planning | Soccer | Sales Dashboard | Using Bar Graphs As ...
- Planning Start Finish
- How to Track Multiple Licenses in Your Organization | Gantt Chart ...
- Business Board Org Chart | PM Agile | Scrum board | Visual ...
- Download Schedule Planner Project Management
- How to Track Your Project Plan vs . the Actual Project Condition ...
- Gantt Chart Templates | How To Create Restaurant Floor Plan in ...
- Business Board Org Chart | PM Agile | Scrum board | Examples Of ...
- Gantt Chart Software | Project — Working With Costs | Product ...
- How to Report Task's Execution with Gantt Chart | How to Create ...
- Project Timeline Management
