Competitor Analysis
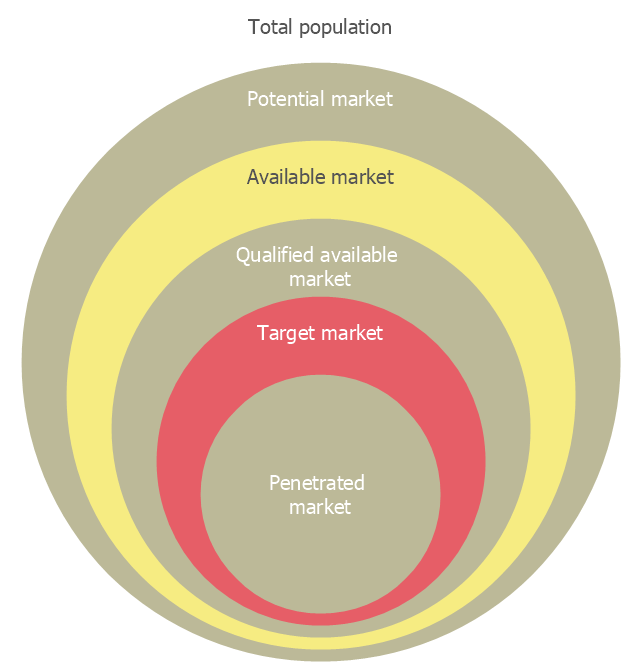
Competitor analysis is a first and obligatory step in elaboration the proper corporate marketing strategy and creating sustainable competitive advantage. Use powerful opportunities of numerous solutions from ConceptDraw Solution Park for designing illustrative diagrams, charts, matrices which are necessary for effective competitor analysis."A target market is a group of customers that the business has decided to aim its marketing efforts and ultimately its merchandise towards. A well-defined target market is the first element to a marketing strategy. The marketing mix variables of product, place (distribution), promotion and price are the four elements of a marketing mix strategy that determine the success of a product in the marketplace." [Target market. Wikipedia]
"An onion diagram is a kind of chart that shows the dependencies among parts of an organization or process. The chart displays items in concentric circles, where the items in each ring depend on the items in the smaller rings. ...
The Onion Diagram is able to show layers of a complete system in a few circles. Each of the circles is able to represent a component that is dependent upon the component on the inside of it shown by the circle inside of it. The main concept of the diagram is shown by the center circle of the diagram. This chart is used due to the fact that it has a clear visual representation that is easy to read, and it has a strong visual impact." [Onion diagram. Wikipedia]
This onion diagram (target diagram) example "Target market" was created using the ConceptDraw PRO diagramming and vector drawing software extended with the Target and Circular Diagrams solution from the Marketing area of ConceptDraw Solution Park.
www.conceptdraw.com/ solution-park/ marketing-target-and-circular-diagrams
Target Diagram
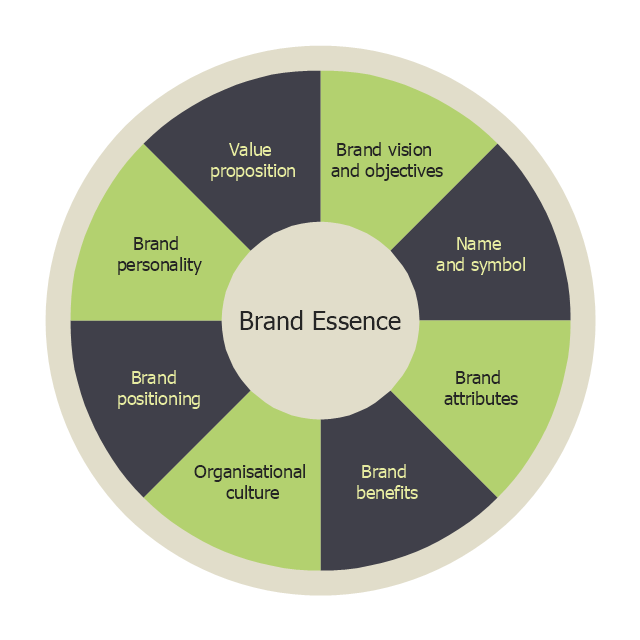
Target Diagram is a convenient and visual way of presentation information which is popular and widely used in marketing, business and economics. ConceptDraw PRO diagramming and vector drawing software extended with Target and Circular Diagrams solution from the Marketing area of ConceptDraw Solution Park is ideal for fast and easy drawing a Target Diagram."Brand essence is a phrase that communicates the fundamental nature of a trade name associated with one or more products made by the same company. A business marketing team will often spend considerable time developing effective ways of expressing the brand essence of their company's various brands by highlighting the unique benefits provided that pertain to the values of its target subculture." [businessdictionary.com/ definition/ brand-essence.html]
Brand essence model diagram visually display key points of brand essence in easy to understand form.
The example of wheel diagram (ring diagram, bevel style circle diagram) "Brand essence model" was created using the ConceptDraw PRO diagramming and vector drawing software extended with the Target and Circular Diagrams solution from the Marketing area of ConceptDraw Solution Park.
www.conceptdraw.com/ solution-park/ marketing-target-and-circular-diagrams
 Target and Circular Diagrams
This solution extends ConceptDraw PRO software with samples, templates and library of design elements for drawing the Target and Circular Diagrams.
Circular Diagram
Circular Diagram is a type of diagram widely used in marketing and economics for visualization information in a clear and visual form. ConceptDraw PRO diagramming and vector drawing software offers the useful tools of the Target and Circular Diagrams solution from the Marketing area of ConceptDraw Solution Park for effective drawing a Circular Diagram of any complexity and design.Basic Flowchart Symbols and Meaning
Flowcharts are the best for visually representation the business processes and the flow of a custom-order process through various departments within an organization. ConceptDraw PRO diagramming and vector drawing software extended with Flowcharts solution offers the full set of predesigned basic flowchart symbols which are gathered at two libraries: Flowchart and Flowcharts Rapid Draw. Among them are: process, terminator, decision, data, document, display, manual loop, and many other specific symbols. The meaning for each symbol offered by ConceptDraw gives the presentation about their proposed use in professional Flowcharts for business and technical processes, software algorithms, well-developed structures of web sites, Workflow diagrams, Process flow diagram and correlation in developing on-line instructional projects or business process system. Use of ready flow chart symbols in diagrams is incredibly useful - you need simply drag desired from the libraries to your document and arrange them in required order. There are a few serious alternatives to Visio for Mac, one of them is ConceptDraw PRO. It is one of the main contender with the most similar features and capabilities.
Flow Map
A Flow Map is a type of thinking maps which help easy organize and understand information. It consists of the set of boxes and arrows, and visually displays a sequence of events. ConceptDraw PRO diagramming and vector drawing software extended with Flowcharts Solution from the "Diagrams" Area of ConceptDraw Solution Park allows you to draw in a few minutes the Flow Map of any degree of complexity.Sales Process Flowchart Symbols
The most easier way of creating the visually engaging and informative Sales Process Flowchart is to create the new ConceptDraw document and to use the predesigned vector symbols offered in 6 libraries of the Sales Flowchart Solution. There are more than six types of sales process flow diagrams, ConceptDraw PRO software is flowchart maker which include six collections of extended flowchart symbols for effective diagramming. There are main collections of color coded flowchart symbols: Sales Department, Sales Steps, Sales Workflow, Sales Symbols and special set of Sales Arrows and Sales Flowchart.Circular Arrow
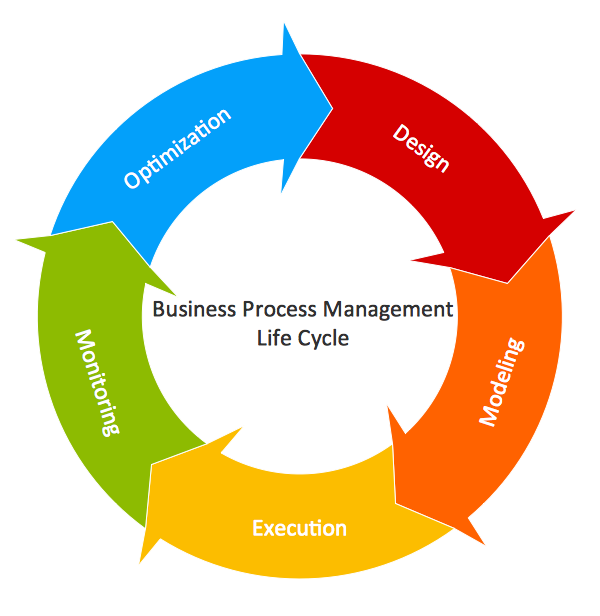
ConceptDraw PRO diagramming and vector drawing software extended with Circular Arrows Diagrams solution from the "Diagrams" Area is a powerful software that will help you design professional looking Circular Arrow Diagrams.Flowchart Examples and Templates
ConceptDraw PRO vector diagramming software and ConceptDraw Solution Park provide a wide variety of diagrams, organizational charts, business charts and flowchart examples, templates and samples. You are free to choose any example or template you are interested in from the ConceptDraw STORE, then use it to simplify your work at the designing professional-looking flowcharts and diagrams. As for flowcharts, turn your attention for the Flowcharts solution from the "Diagrams" area of ConceptDraw Solution Park, Process Flowcharts and Cross-Functional Flowcharts solutions from the Business Processes area, Accounting Flowcharts and Audit Flowcharts solutions from the Finance and Accounting area, which are completely devoted to flowcharts creation and provide an enormous collection of helpful flowchart templates and samples. Each of them is specially developed, well thought-out, dedicated to a certain thematic and carries a specific purpose. You need only to determine with your needs and to decide which one corresponds them the best and suits for you.ConceptDraw PRO: Able to Leap Tall Buildings in a Single Bound
ConceptDraw PRO is the world’s premier cross-platform business-diagramming tool. Many, who are looking for an alternative to Visio, are pleasantly surprised with how well they can integrate ConceptDraw PRO into their existing processes. With tens of thousands of template objects, and an easy method for importing vital custom objects from existing Visio documents, ConceptDraw PRO is a powerful tool for making extremely detailed diagrams, quickly and easily.How to Use the ″Online Store PR Campaign″ Sample
Interactive tool helps you find the appropriate response to social media mentions quickly.Using Fishbone Diagrams for Problem Solving
Problems are obstacles and challenges that one should overcome to reach the goal. They are an inseparable part of any business, and the success of an enterprise often depends on ability to solve all problems effectively. The process of problem solving often uses rational approach, helping to find a suitable solution. Using Fishbone Diagrams for Problem Solving is a productive and illustrative tool to identify the most important factors causing the trouble. ConceptDraw PRO extended with Fishbone Diagrams solution from the Management area of ConceptDraw Solution Park is a powerful tool for problem solving with Fishbone Ishikawa diagram graphic method.UML Use Case Diagram Example Social Networking Sites Project
UML Diagrams Social Networking Sites Project. This sample was created in ConceptDraw PRO diagramming and vector drawing software using the UML Use Case Diagram library of the Rapid UML Solution from the Software Development area of ConceptDraw Solution Park. This sample shows the Facebook Socio-health system and is used at the projection and creating of the social networking sites.- Marketing mix - Wheel diagram | Target diagrams - Vector stencils ...
- Marketing Mix Flow Chart
- Marketing Diagrams | Marketing Analysis Diagram | Flowchart ...
- Marketing Mix In Marketing Graphs
- Brand essence model - Wheel diagram | Marketing mix - Wheel ...
- Marketing mix - Wheel diagram | Marketing Diagrams | Marketing ...
- Target diagrams - Vector stencils library | Target market | Target and ...
- Flowchart Marketing Process. Flowchart Examples | Flowchart ...
- Marketing | Marketing mix - Wheel diagram | Target market ...
- Marketing mix diagram | Business Productivity - Marketing | Target ...
- Marketing mix - Wheel diagram
- Marketing Diagrams | Flowchart Marketing Process. Flowchart ...
- Daily Schedule Chart | Marketing | Target Diagram | Marketing Mix ...
- Marketing mix - Wheel diagram | Target Diagram | Daily Schedule ...
- Define Market With Diagram
- Marketing mix - Wheel diagram
- Marketing mix - Wheel diagram | Brand essence model - Wheel ...
- Diagram To Define Marketing
- Brand essence model - Wheel diagram | Marketing mix - Wheel ...
- Porter Marketing Mix


