BCG Matrix
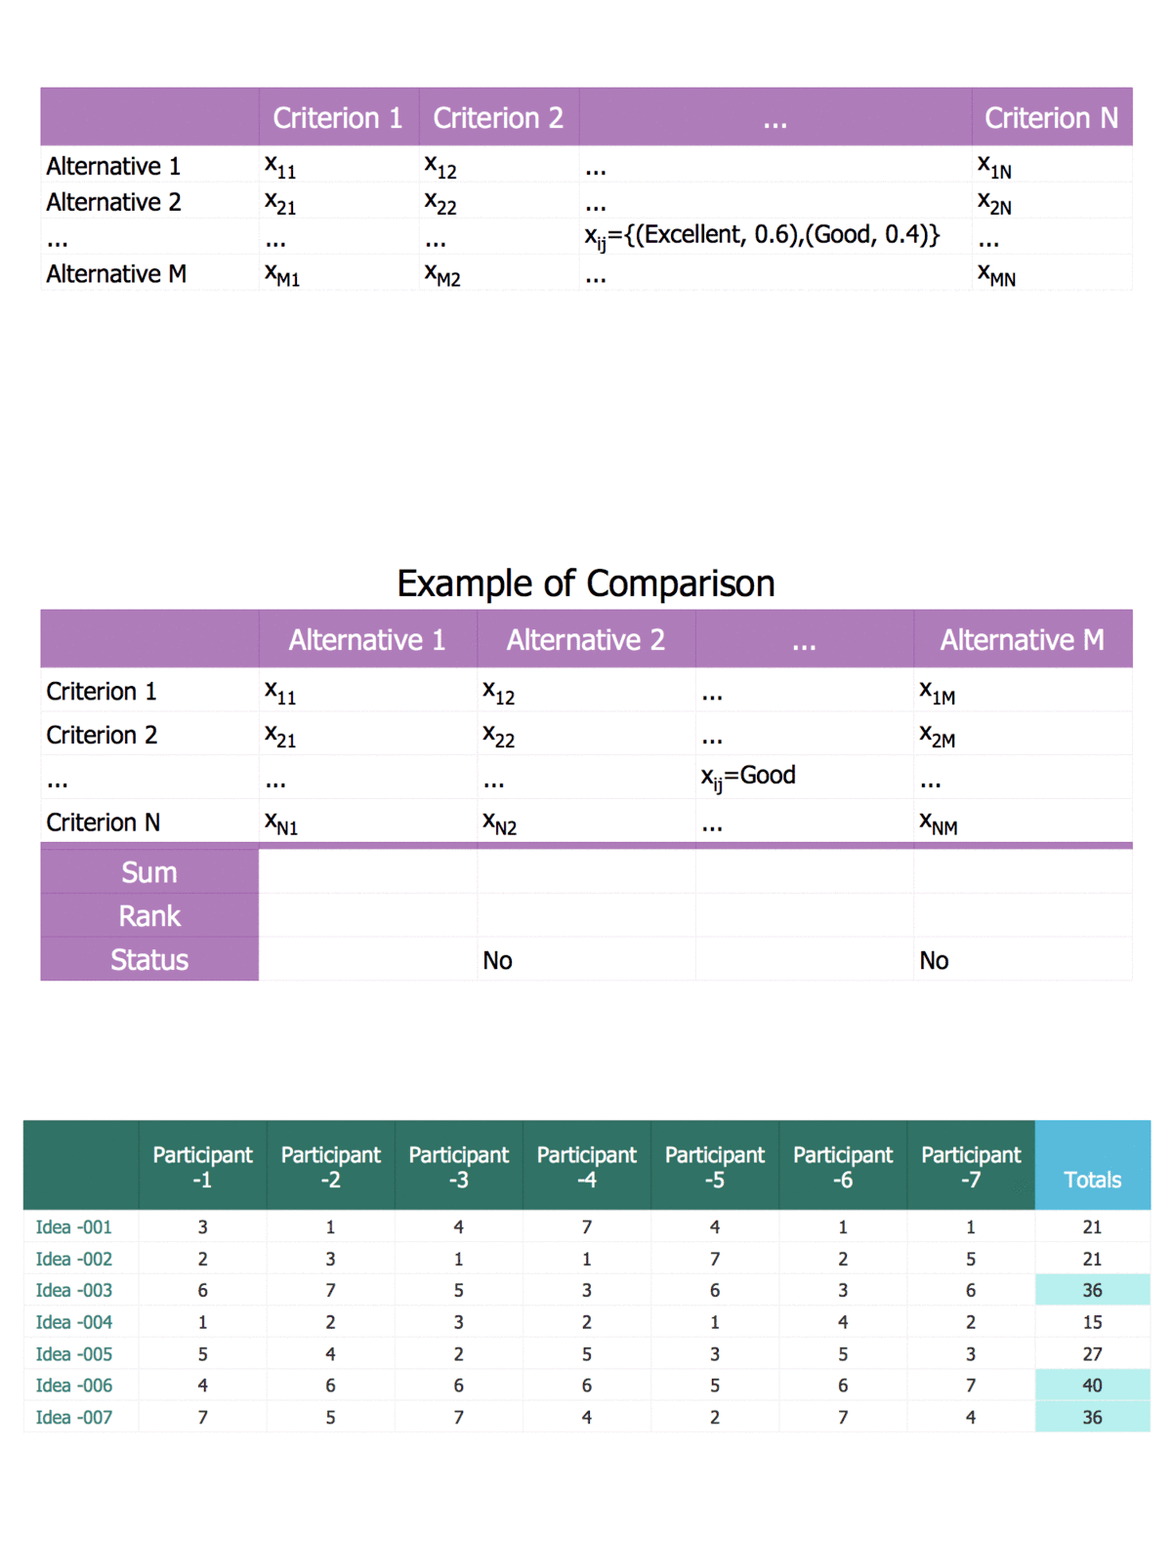
The growth–share matrix (BCG Matrix) was created by Bruce D. Henderson for the Boston Consulting Group in 1970 to help corporations to analyze their business units and to help the company allocate resources. How is it easy design the BCG Matrices in ConceptDraw PRO diagramming and vector drawing software supplied with unique Matrices Solution from the Marketing Area of ConceptDraw Solution Park.Decision Matrix
Having the pre-made vector stencils as well as the previously created examples of many drawings, including the decision matrices from the Decision Making solution may help with making the unique representation for any of the ConceptDraw PRO user. In case you doubt in being able to make the needed decision matrix professionally, then you can always use any of the already existing templates as drafts for your own drawings."A prioritization matrix is a simple tool that provides a way to sort a diverse set of items into an order of importance. It also identifies their relative importance by deriving a numerical value for the priority of each item.
The matrix provides a means for ranking projects (or project requests) based on criteria that are determined to be important. This enables a department to see clearly which projects are the most important to focus on first, and which,
if any, could be put on hold or discontinued." [oqi.wisc.edu/ resourcelibrary/ uploads/ resources/ Project_ Prioritization_ Guide_ v_ 1.pdf]
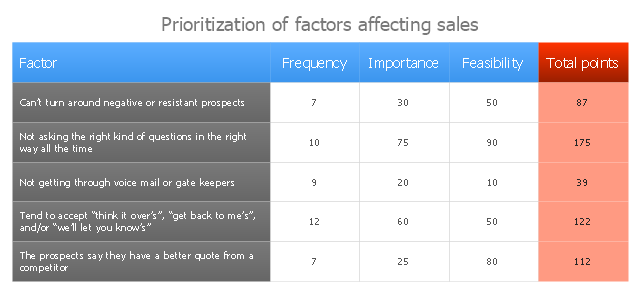
The sales activity prioritization matrix example was created using the ConceptDraw PRO diagramming and vector drawing software extended with the solution "Seven Management and Planning Tools" from the Management area of ConceptDraw Solution Park.
7 Management & Planning Tools
The 7 Management and Planning Tools solution available from ConceptDraw Solution Park implements well-known methodologies and provides the comprehensive set of tools for problems' analysis and solving. Different products from multifunctional ConceptDraw Office suite may be used as a complete solution for any of methodologies offered by this solution and provide a visual communication during every stage of work. Use the MINDMAP 7 Management & Planning Tools for step-by-step identification and analysis the problems, for planning solving and corrective actions, and also countermeasures to address the risks. 7 Management and Planning Tools solution is perfect for managers in medium to large companies, who require effective tools to address the management issue, for business consultants, trainers and coaches to help visualize the problem's solving by using 7 MP Tools methodology, to structure the problem's affecting factors, analyze their root causes and cause and effect relations, to highlight drivers and indicators factors, to prioritize factors using ranking by criteria set.CORRECTIVE ACTIONS PLANNING. Risk Diagram (PDPC)
Risk Diagram (PDPC) - ConceptDraw Office suite is a software for Risks Diagram making. This diagram identifies possible risks in accomplishing corrective actions. With the Risks Diagram, one analyzes each action separately in a tree of all actions and develops a preventive action in response of each potential obstacles or circumstances which may be a risk.
 Decision Making
The Decision Making solution offers the set of professionally developed examples, powerful drawing tools and a wide range of libraries with specific ready-made vector decision icons, decision pictograms, decision flowchart elements, decision tree icons, decision signs arrows, and callouts, allowing the decision maker (even without drawing and design skills) to easily construct Decision diagrams, Business decision maps, Decision flowcharts, Decision trees, Decision matrix, T Chart, Influence diagrams, which are powerful in questions of decision making, holding decision tree analysis and Analytic Hierarchy Process (AHP), visual decomposition the decision problem into hierarchy of easily comprehensible sub-problems and solving them without any efforts.
 eLearning for Skype
This solution extends ConceptDraw MINDMAP software with the ability to prepare and run remote learning sessions by using Skype
 Website Wireframe
The innovative Website Wireframe solution enhances the ConceptDraw PRO v10 functionality with newest wireframe tools, libraries with variety of predesigned icons, symbols, buttons, graphics, forms, boxes, and many other vector elements, templates and professionally designed samples, which make it the best wireframing software. Website Wireframe solution gives you significant advantages when designing and maintaining websites, creating skeletal and content-free depictions of website structure, making website prototypes and planning the content arrangement before committing to design, also speeds up the processes of sketching, producing and sharing wireframe examples of website style and interface design.
 SYSML
SYSML
The SysML solution helps to present diagrams using Systems Modeling Language; a perfect tool for system engineering.
 Comparison Dashboard
Comparison dashboard solution extends ConceptDraw PRO software with samples, templates and vector stencils library with charts and indicators for drawing the visual dashboard comparing data.
- PROBLEM ANALYSIS. Prioritization Matrix | Prioritization Matrix ...
- SWOT Matrix | SWOT Matrix Template | Swot Analysis Examples ...
- Prioritization Matrix | Opportunity prioritization matrix | Sales activity ...
- Prioritization Matrix | PROBLEM ANALYSIS. Prioritization Matrix ...
- Prioritization Matrix | Sales activity prioritization matrix | How To ...
- How To Create a Prioritization Matrix | Prioritization Matrix ...
- PROBLEM ANALYSIS. Prioritization Matrix | Cause and Effect ...
- Prioritization Matrix | PROBLEM ANALYSIS. Prioritization Matrix ...
- PROBLEM ANALYSIS. Prioritization Matrix | Root Cause Analysis ...
- 25 Typical Orgcharts | How to Draw a Matrix Organizational Chart ...


