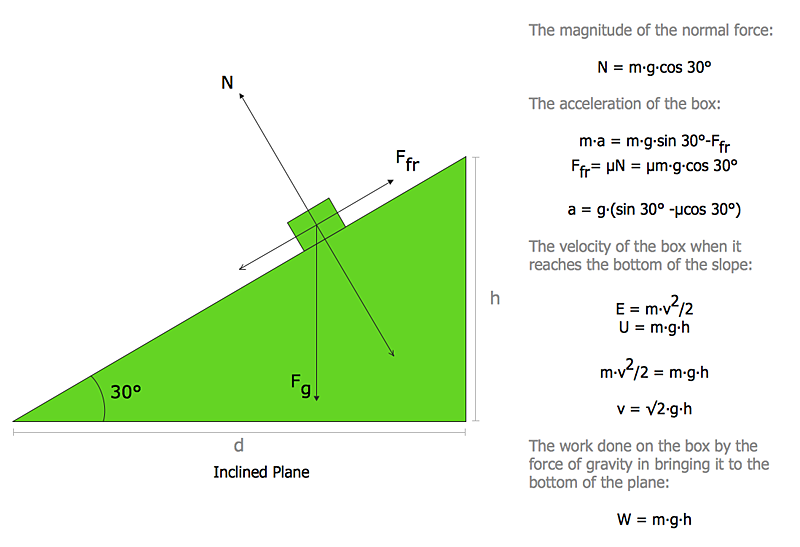
Physics Diagrams
ConceptDraw PRO diagramming and vector drawing software extended with Physics solution from the Science and Education area is the best for creating: physics diagrams, pictures which describe various physical facts and experiments, illustrations of various electrical, mechanical and optic processes, of any complexity quick and easy.
 ConceptDraw Solution Park
ConceptDraw Solution Park collects graphic extensions, examples and learning materials
HelpDesk
How to Draw Physics Diagrams in ConceptDraw PRO
Physics charts can be helpful when you learn Physics, perform experiments, or solve any other tasks regarding Physics. ConceptDraw PRO allows you to draw physical diagrams of mechanical, nuclear, optical and electrical processes using the set of vector physics symbols and physics diagram templates. Nothing is more helpful in the study of physics as a visual representation of the physical processes: physics schemes, diagrams and illustrations.
 Physics
Physics solution extends ConceptDraw PRO software with templates, samples and libraries of vector stencils for drawing the physical illustrations, diagrams and charts.
Sketching Software
ConceptDraw PRO is a powerful diagramming, vector drawing and sketching software that can be successfully used for creating various sketches, illustrations, drawing in any field of science and life activity. In particular, ConceptDraw PRO offers the Astronomy solution from the Science and Education area to help you design the astronomy pictures, sun solar system drawings, constellation chart quick and easy.
 Cross-Functional Flowcharts
Cross-functional flowcharts are powerful and useful tool for visualizing and analyzing complex business processes which requires involvement of multiple people, teams or even departments. They let clearly represent a sequence of the process steps, the order of operations, relationships between processes and responsible functional units (such as departments or positions).
 Fault Tree Analysis Diagrams
This solution extends ConceptDraw PRO v9.5 or later with templates, fault tree analysis example, samples and a library of vector design elements for drawing FTA diagrams (or negative analytical trees), cause and effect diagrams and fault tree diagrams.
 Audit Flowcharts
Audit flowcharts solution extends ConceptDraw PRO software with templates, samples and library of vector stencils for drawing the audit and fiscal flow charts.
 Basic Diagramming
This solution extends ConceptDraw PRO software with the specific tools you need to easily draw flowcharts, block diagrams, histograms, pie charts, divided bar diagrams, line graphs, circular arrows diagrams, Venn diagrams, bubble diagrams and concept maps
 Education
This solution extends ConceptDraw PRO and ConceptDraw MINDMAP with specific content that helps illustrate educational documents, presentations, and websites quickly and easily with astronomy, chemistry, math and physics vector pictures and clip art.
 Flowcharts
The Flowcharts Solution for ConceptDraw PRO v10 is a comprehensive set of examples and samples in several different color themes for professionals that need to graphically represent a process. Solution value is added by basic flow chart template and shapes' library of Flowchart notation. ConceptDraw PRO flow chart creator lets one depict a processes of any complexity and length, as well design of the flowchart either vertically or horizontally.
 Universal Diagramming Area
This area collects solutions for drawing diagrams, charts, graphs, matrices, geographic and road maps for education, science, engineering, business.
 Accounting Flowcharts
Accounting Flowcharts solution extends ConceptDraw PRO software with templates, samples and library of vector stencils for drawing the accounting flow charts.
 Entity-Relationship Diagram (ERD)
Entity-Relationship Diagram (ERD) solution extends ConceptDraw PRO software with templates, samples and libraries of vector stencils from drawing the ER-diagrams by Chen's and crow’s foot notations.
 Event-driven Process Chain Diagrams
Event-driven Process Chain (EPC) Diagram is a type of flowchart widely used for modeling in business engineering and reengineering, business process improvement, and analysis. EPC method was developed within the Architecture of Integrated Information Systems (ARIS) framework.
- Physics Diagrams | Mechanical Engineering | Basic Flowchart ...
- Physics Diagrams | Chemical Engineering | Mechanical Engineering ...
- Process Flowchart | Simple Flow Chart | Physics Diagrams ...
- Best Physics Diagram
- Electrical Engineering | Mechanical Engineering | Physics Diagrams ...
- Mechanical Charts Can Or For Drawing
- Process Flowchart | Mechanical Design Software | Flowchart ...
- Process Flowchart | Physics Diagrams | Engineering | Mechanical ...
- Mechanical Engineering Symbol Chart Pdf
- Technical Drawing Software | How to Draw Physics Diagrams in ...
- Mechanical Design Software | Mechanical Engineering | Mechanical ...
- Mathematics | Physics Symbols | Physics Diagrams | Mechanical ...
- How to Draw Physics Diagrams in ConceptDraw PRO | Simple Flow ...
- Mechanical Drawing Symbols | How to Create a Mechanical ...
- Mechanical Drawing Symbols | Mechanical Design Software ...
- Mechanical Engineering | Mechanical Drawing Software | Physics ...
- Best Diagrams Of Physics To Draw On Chart
- How to Draw Physics Diagrams in ConceptDraw PRO | Mechanical ...
- Mechanical Engineering | Engineering | How to Create a ...
- How to Draw Physics Diagrams in ConceptDraw PRO | Line Chart ...


