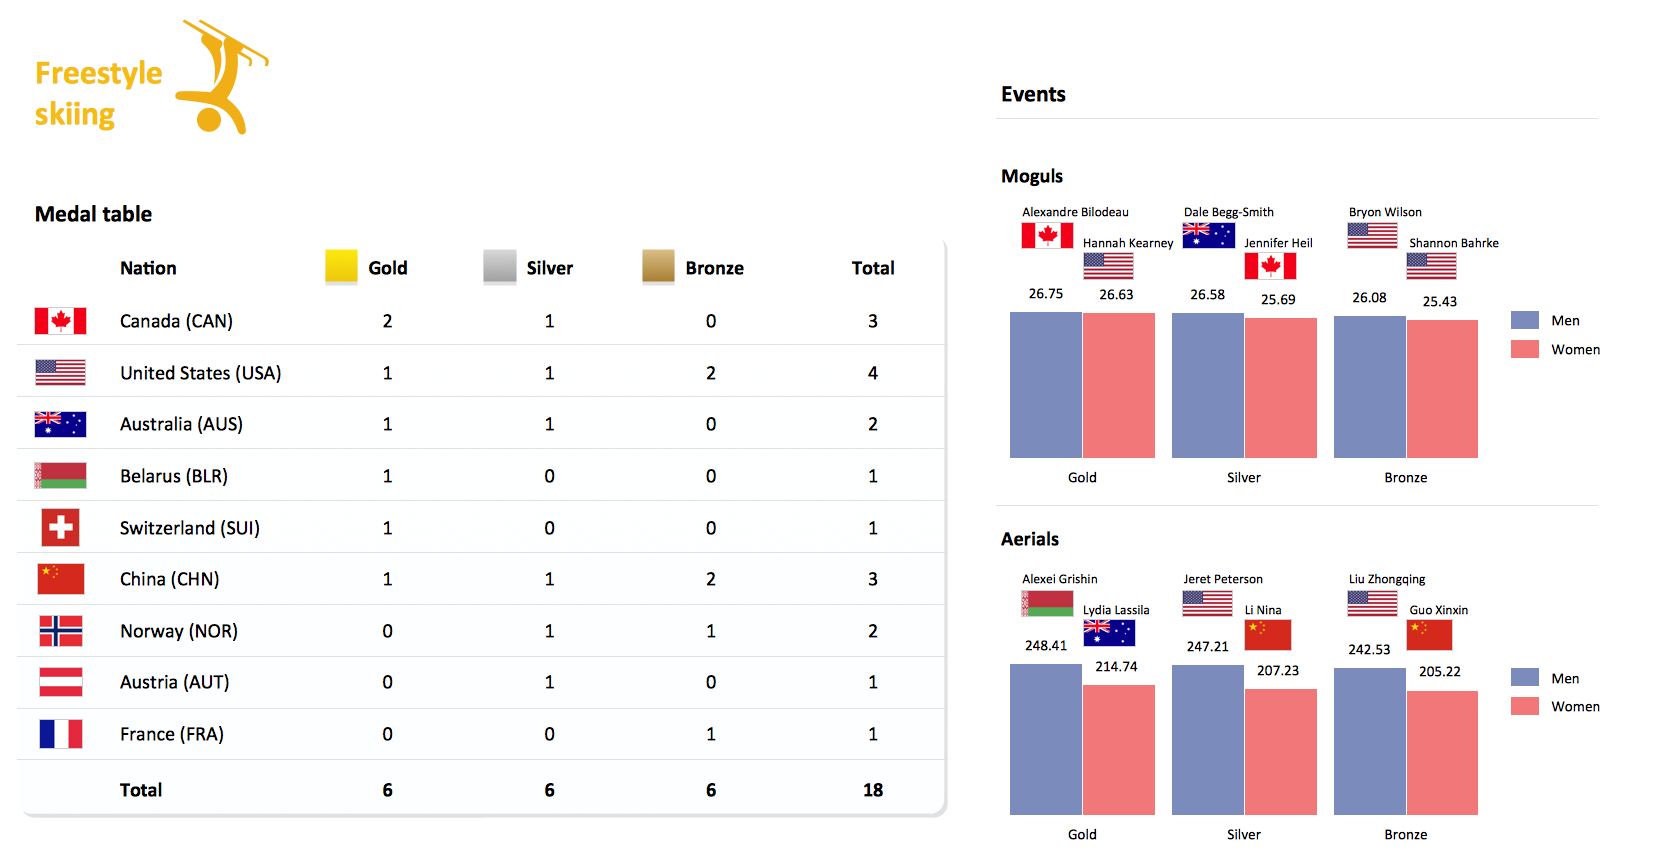
Winter Sports. Olympic Games Illustrations. Medal Summary
Winter Sports Vector Clipart. Medal Map. Spatial Infographics

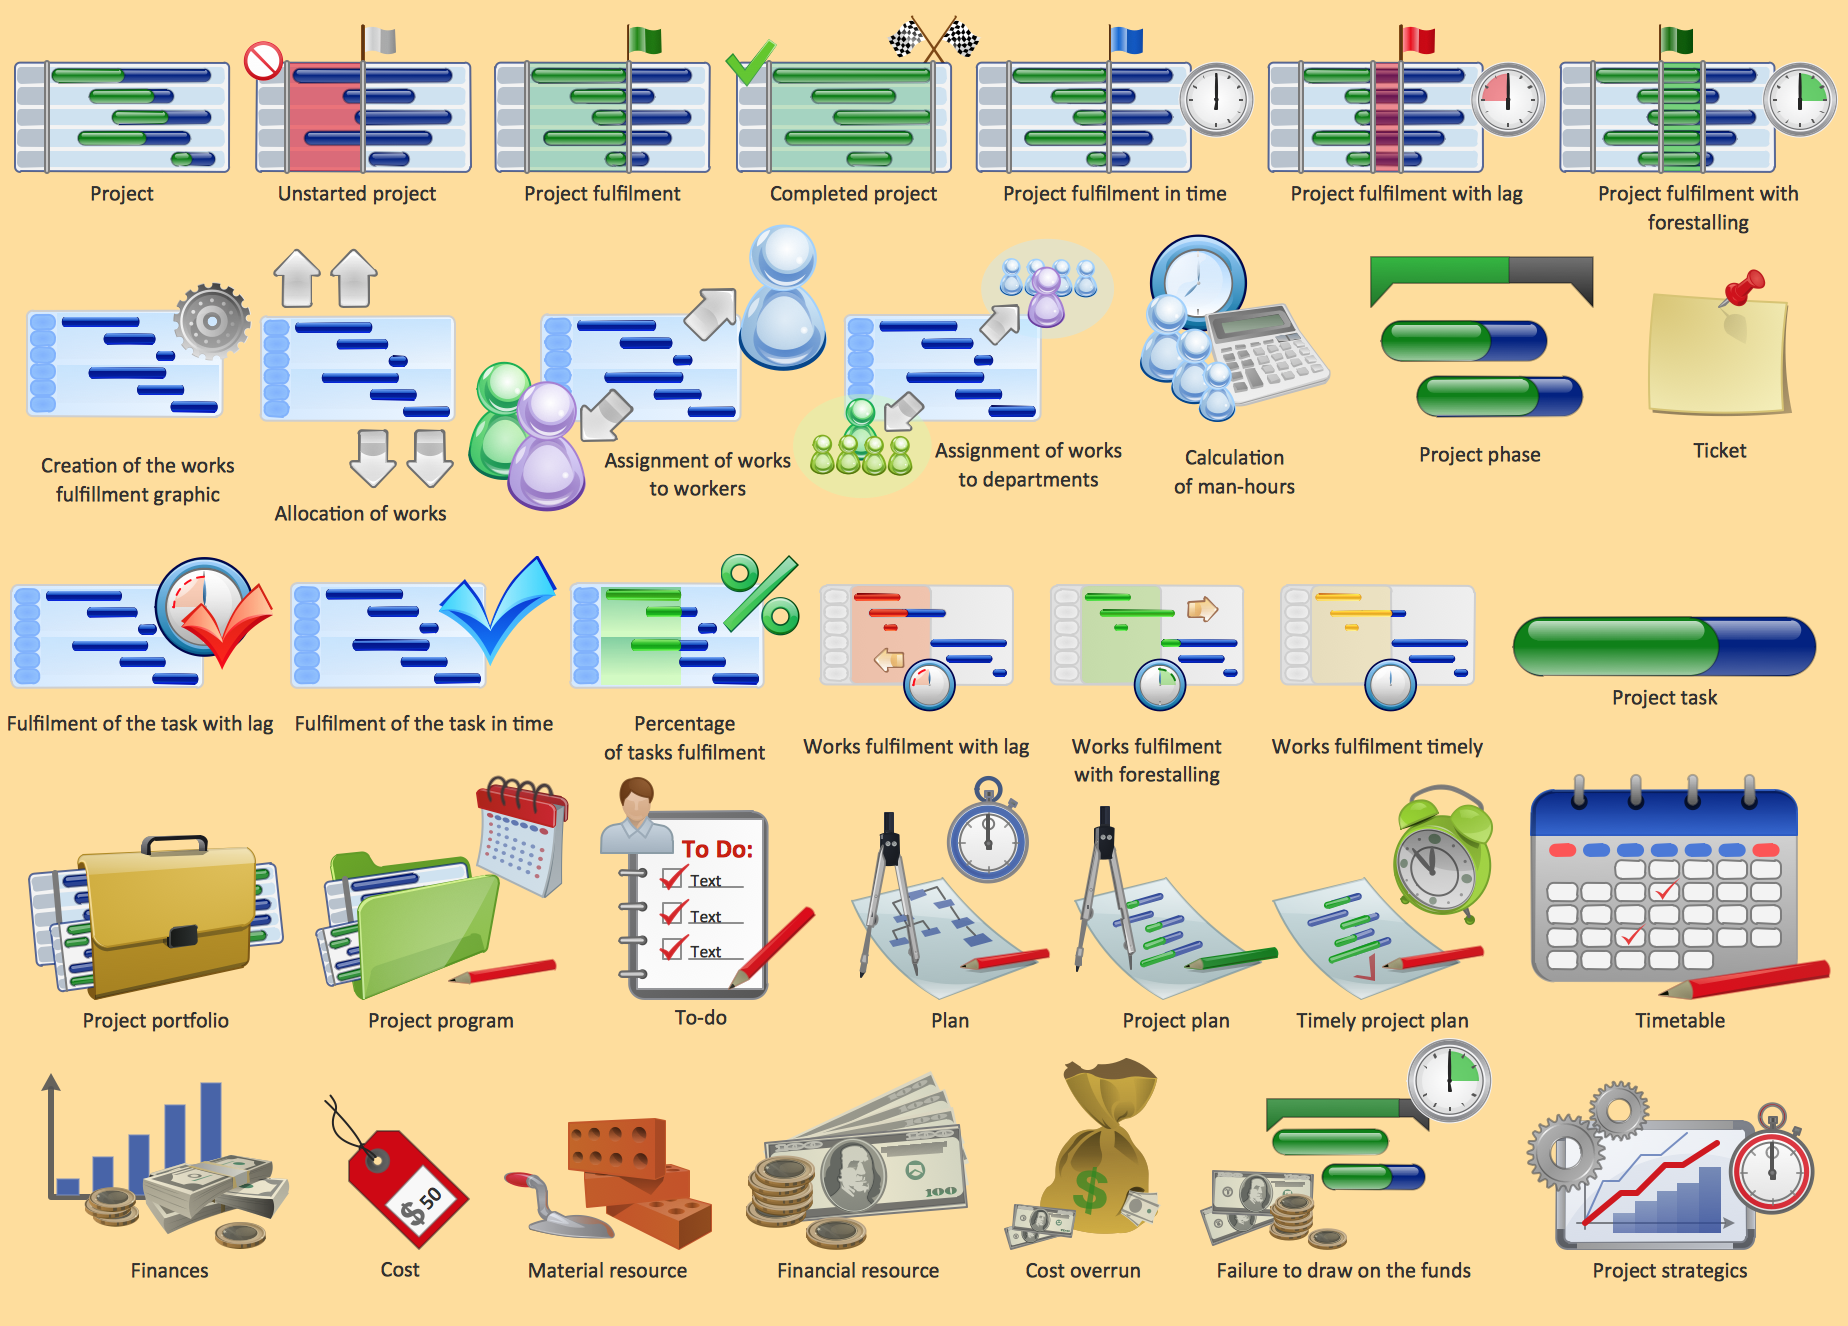
Project management - Design Elements
Clipart School

Four Dimensions Bubble Plot

Design Pictorial Infographics. Design Infographics

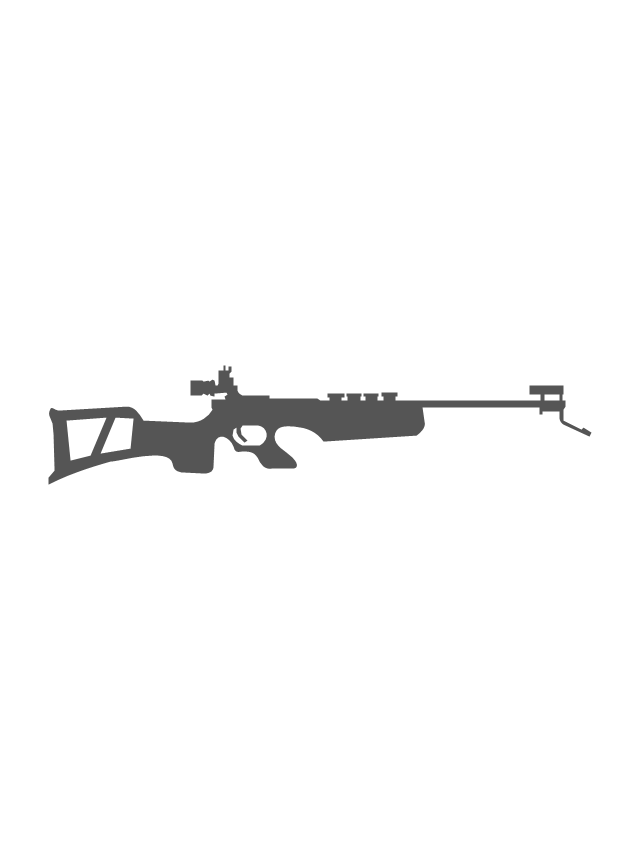
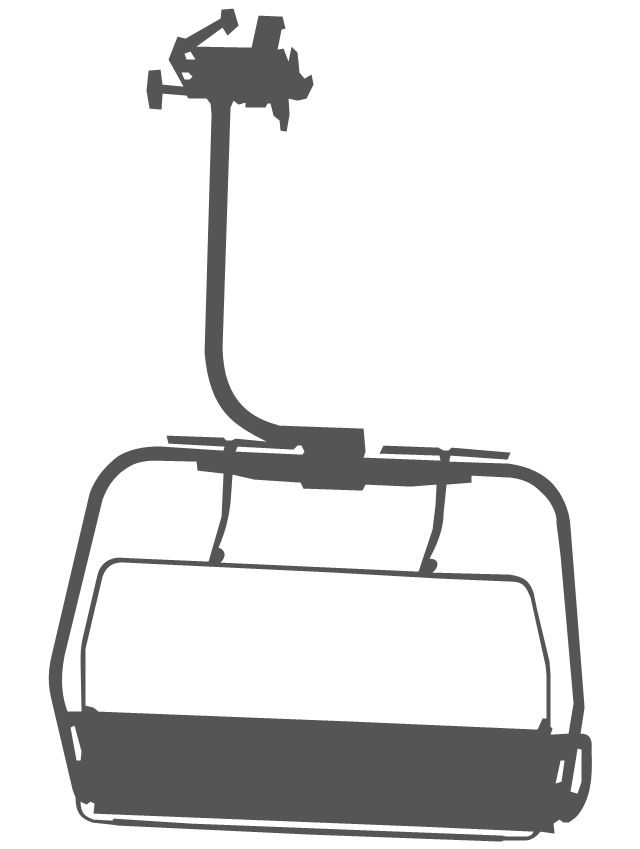
The vector stencils library "Winter Olympics pictograms" contains 29 pictograms and silhouettes: Olympic rings, Olympic torch, medal pedestal, gold medal, silver medal, bronze medal, medals with ribbon, skis, ski poles, biathlon rifle, snowboard, ski goggles, ski gloves, ice hockey helmet, hockey stick, hockey puck, ice hockey skates, ice skates, luge, bobsleigh sled, curling stone, mountains, snowflake, fir-tree, ski lift.
Use it to create your own winter sports diagrams, infographics and illustrations.
The example "Design elements - Winter Olympics pictograms" is included in the Winter Sports solution from the Sport area of ConceptDraw Solution Park.
Use it to create your own winter sports diagrams, infographics and illustrations.
The example "Design elements - Winter Olympics pictograms" is included in the Winter Sports solution from the Sport area of ConceptDraw Solution Park.
Winter Olympics pictograms
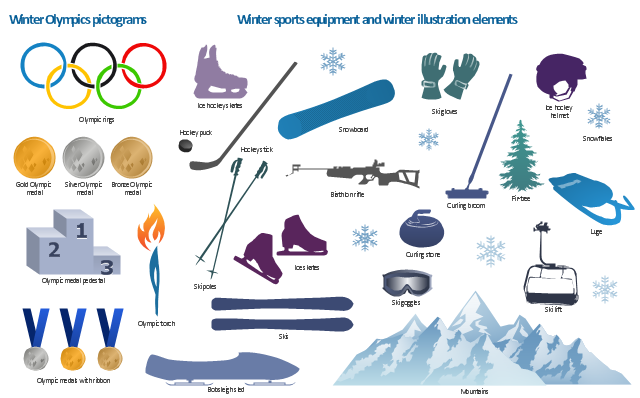
The vector stencils library "Winter Olympics pictograms" contains 29 pictograms and silhouettes.
Use it for drawing Winter Olympics diagrams, infographics and illustrations in the ConceptDraw PRO diagramming and vector drawing software extended with the Winter Sports solution from the Sport area of ConceptDraw Solution Park.
Use it for drawing Winter Olympics diagrams, infographics and illustrations in the ConceptDraw PRO diagramming and vector drawing software extended with the Winter Sports solution from the Sport area of ConceptDraw Solution Park.
Olympic rings
Olympic torch

Olympic medal pedestal

Olympic medal, gold

Olympic medal, silver

Olympic medal, bronze

Olympic medal with ribbon, gold

Olympic medal with ribbon, silver

Olympic medal with ribbon, bronze

Skis

Ski poles

Biathlon rifle
Snowboard

Ski goggles

Ski gloves

Ice hockey helmet

Hockey stick

Hockey puck

Ice hockey skates

Ice skates

Luge

Bobsleigh sled

Curling stone

Curling broom

Mountains

Mountains 2

Snowflake

Fir-tree

Ski lift
Flowchart Example: Flow Chart of Marketing Analysis

 Winter Sports
The Winter Sports solution from Sport area of ConceptDraw Solution Park contains winter sports illustration examples, templates and vector clipart libraries.
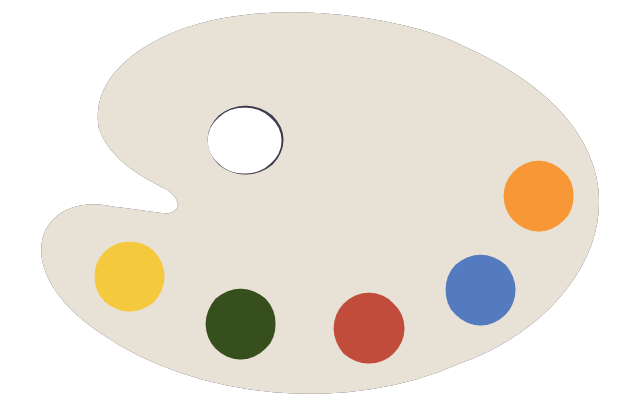
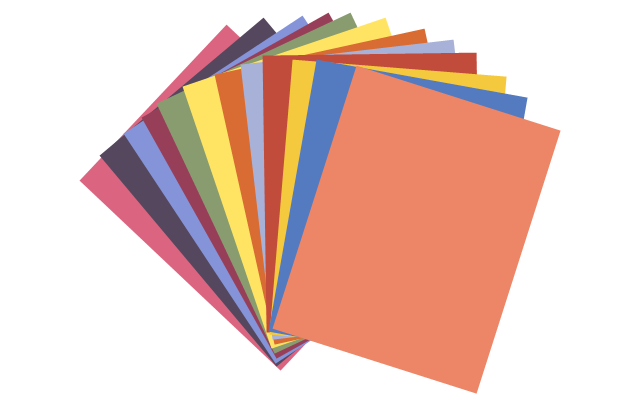
The vector stencils library "Education pictograms" contains 128 education pictograms. Use this flat icon set to design your educational infogram in ConceptDraw PRO diagramming and vector drawing software.
The vector stencils library "Education pictograms" is included in the Education Infographics solution from the Business Infographics area of ConceptDraw Solution Park.
The vector stencils library "Education pictograms" is included in the Education Infographics solution from the Business Infographics area of ConceptDraw Solution Park.
ABC

Apple

Artist oil colors

Artists paint palette
Atom

Baseball

Basketball

Beaker

Bell

Bicycle

Book - open

Books

Brushes

Bunsen burner

Calculator

Calendar

CD

Cell model

Chemical flask

Cloud

Colored paper
Colored pencils

Compass

Compasses

Dinosaur skeleton

Diploma

DNA double helix

Drop

Dumbbells

Earth

Earth's internal structure

Easel

Email

Eraser

Exercise book

Felt tip pens

Folders

Football

Funnel

Gears

Globe

Gouache

Graduation cap

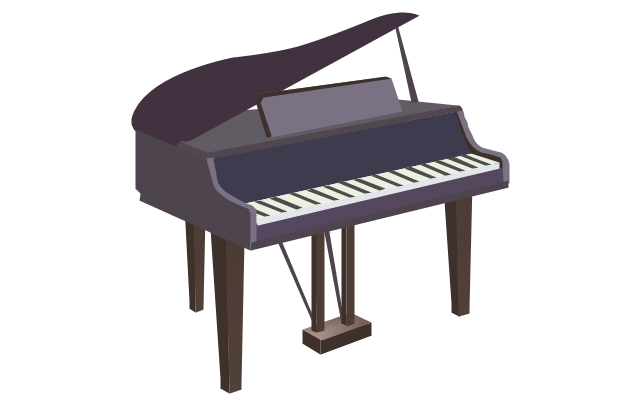
Grand piano

Grand piano - clipart
Green blackboard

Hourglass

Laptop

Laptop mouse

Light bulb

Magnet

Magnifier

Marker - black

Marker - blue

Marker - green

Marker - red

Marker - white

Marker - yellow

Medal with ribbon

Metronome

Microscope

Moon

Music notes

Notebook

Notepad

Paper clips

Paper sheet

Paper sheet - grid

Paper sheet - lined

Paper stickers

Parthenon

Pen

Pen - fountain

Pencil

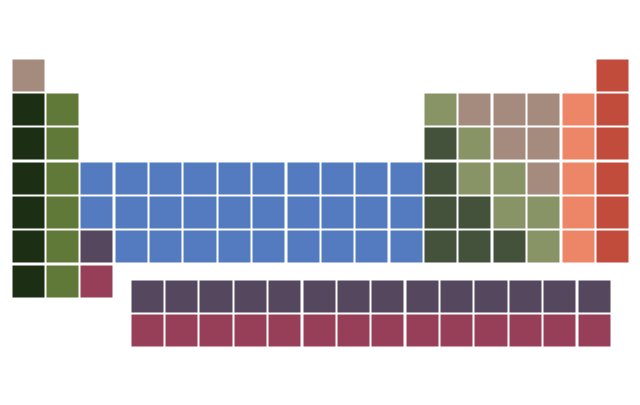
Periodic table
Protractor

Push pins

Robot

Round bottom flask

Rugby ball

Ruler

Scales

School backpack

School bus

School satchel

Schoolboy - african

Schoolboy - asian

Schoolboy - caucasian

Schoolboy - indian

Schoolgirl - african

Schoolgirl - asian

Schoolgirl - caucasian

Schoolgirl - indian

Scissors and a bottle of glue

Scroll

Snowflake

Sport cup

Star

Stickers
Stopwatch

Sun

Tablet computer

Teacher with a pointer

Teacher - african

Teacher - asian

Teacher - caucasian

Teacher - indian

Teacher - woman, african

Teacher - woman, asian

Teacher - woman, caucasian

Teacher - woman, indian

Telescope

Test tube

Thermometer

To-Do list

Tree leaf - acacia

Tree leaf - birch

Tree leaf - chestnut

Tree leaf - maple

Tree leaf - oak

Tree leaf - walnut

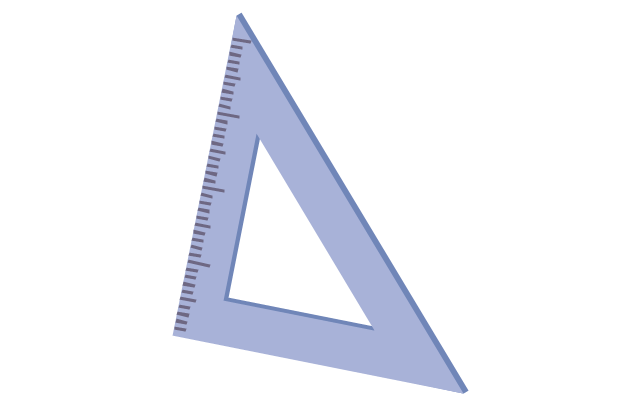
Triangle ruler
Volleyball

Violin
Violin - clipart

Wall clock

Watercolor set
World map

 Area Charts
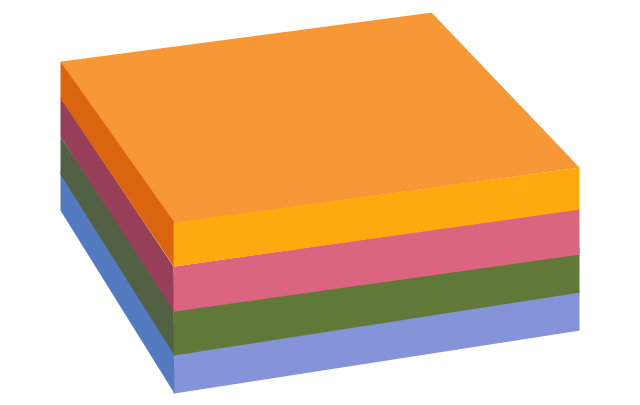
Area Charts are used to display the cumulative totals over time using numbers or percentages; or to show trends over time among related attributes. The Area Chart is effective when comparing two or more quantities. Each series of data is typically represented with a different color, the use of color transparency in an object’s transparency shows overlapped areas and smaller areas hidden behind larger areas.
Mind Map Making Software

CORRECTIVE ACTIONS PLANNING. Involvement Matrix


Design Data Flow. DFD Library

- Winter Sports. Olympic Games Illustrations . Medal Summary | Winter ...
- Winter Sports. Olympic Games Illustrations . Medal Summary | Winter ...
- Winter Sports. Olympic Games Illustrations . Medal Summary | Food ...
- Winter Sports. Olympic Games Infographics. Medal Table | Winter ...
- Winter Sports. Olympic Games Illustrations . Medal Summary | Winter ...
- Winter Sports. Olympic Games Illustrations . Medal Summary | Winter ...
- Winter Olympics - Freestyle skiing | Winter Sports | Winter Sports ...
- Winter Sports | Winter Sports. Olympic Games Illustrations . Medal ...
- Winter Sports. Olympic Games Infographics. Medal Table | Winter ...
- Winter Sports. Olympic Games Illustrations . Medal Summary | Sport ...
- Curling Broom Illustration
- Winter Sports | Winter Sports Vector Clipart. Medal Map. Spatial ...
- Winter Sports. Olympic Games Illustrations . Medal Summary | Winter ...
- Winter Sports. Illustrations and Visualize Statistics | Winter Sports ...
- Energy-efficient game console | Winter Sports. Olympic Games ...
- Winter Sports | Area Charts | Infographics Illustration A Comparison ...
- Winter Sports. Olympic Games Infographics. Medal Table | Winter ...
- Winter Sports Vector Clipart. Medal Map. Spatial Infographics ...
- Winter Sports. Olympic Games Infographics. Medal Table | Sport ...
- Winter Sports Vector Clipart. Medal Map. Spatial Infographics ...