Mind Mapping in the Quality Management
ConceptDraw MINDMAP has a addition to the ConceptDraw Solution Park that provides a creative approach to visualizing quality processes, Quality Mind Map Solution.
 Quality Mind Map
This solution extends ConceptDraw MINDMAP software with Quality Management Mind Maps (Presentations, Meeting Agendas, Problem to be solved).
How To Do A Mind Map In PowerPoint
ConceptDraw MINDMAP - an excellent tool for exporting mind maps to PowerPoint to visualize and presenting your project. You can simply generate, change, update your mindmap and then make a presentation in PowerPoint.Mind Map Making Software
The power, economy, and versatility of ConceptDraw MINDMAP takes personnel and team productivity to another level. Discover today what this means to you.Mind Map Food
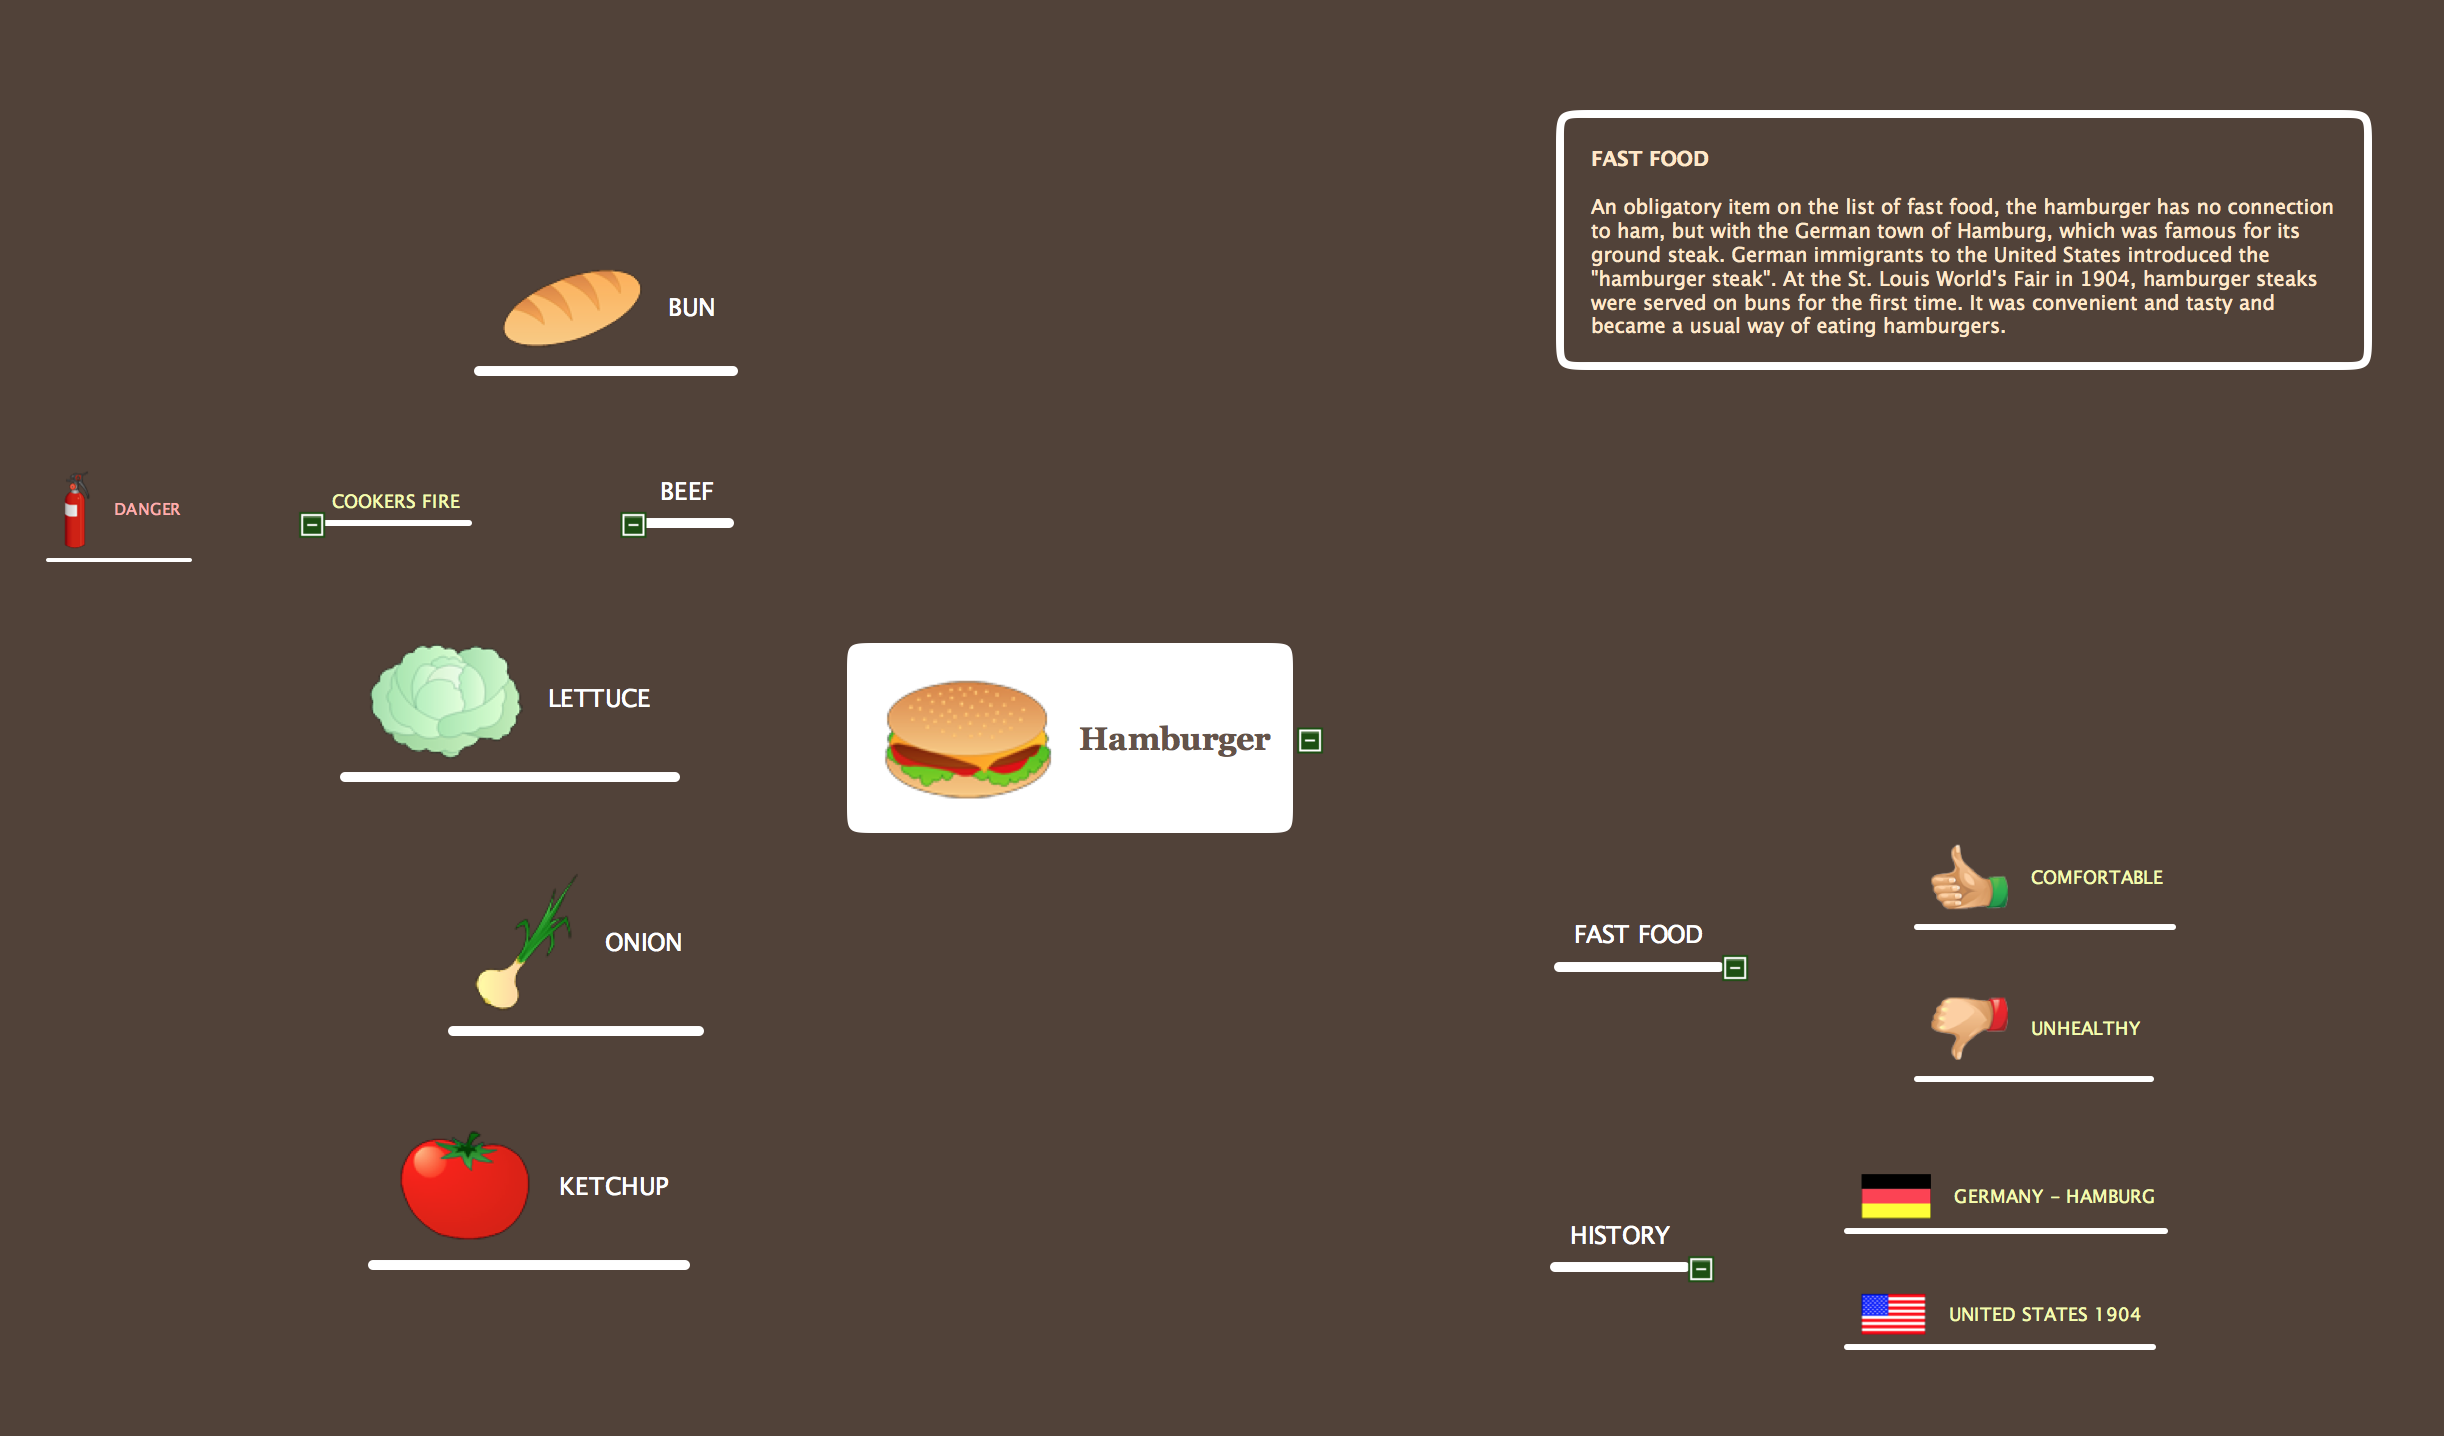
Mind Map Food - This sample was created with ConceptDraw MINDMAP mind mapping software. This sample shows the mind map about the such fast food as Hamburger. This sample narrates about the hamburger’s history, ingredients and preparation. You can use this sample at the cooking, in the fast food cafes, on the factories of the fast preparation products.HelpDesk
How to Input Data from MS Excel Into a Mind Map
Many people apply Excel documents to store data in the form of hierarchical lists. With ConceptDraw MINDMAP you can easily turn the linear structure of an Excel table in a radial structure of mind map ConceptDraw MINDMAP will create a mind map file (CDMZ) from your Excel (XLS) file. If you keep your information in the Microsoft Excel files, you can import them into ConceptDraw MINDMAP, converting the columns and rows to a hierarchical structured mind map. If you have multiple individual sheets in your Excel workbook, ConceptDraw MINDMAP will turn them into a single multi-page mind map. ConceptDraw MINDMAP lets you import an entire Microsoft® Excel file as well as insert data from the selected cells.HelpDesk
How to Create a Fishbone (Ishikawa) Diagram Quickly
A Fishbone (Ishikawa) diagram is also called cause-and-effect diagram. Fishbone diagram is often used in business to determine the cause of some problem. The diagram illustrates the main causes and sub-causes leading to an event. The main goal of the Fishbone diagram is to illustrate in a graphical way the relationship between a given outcome and all the factors that influence this outcome. The complete diagram resembles a fish skeleton as its name implies. The ability to create a Fishbone Diagram is supported by the Fishbone Diagram solution. Use ConceptDraw MINDMAP for structuring data and then ConceptDraw PRO for generating a Fishbone Diagram from mind map structure.Enhancing maps using ConceptDraw MINDMAP′s Theme Gallery
Video tutorials on ConceptDraw products. Try it today!Enhancing maps using ConceptDraw MINDMAP′s Theme Gallery for Macintosh
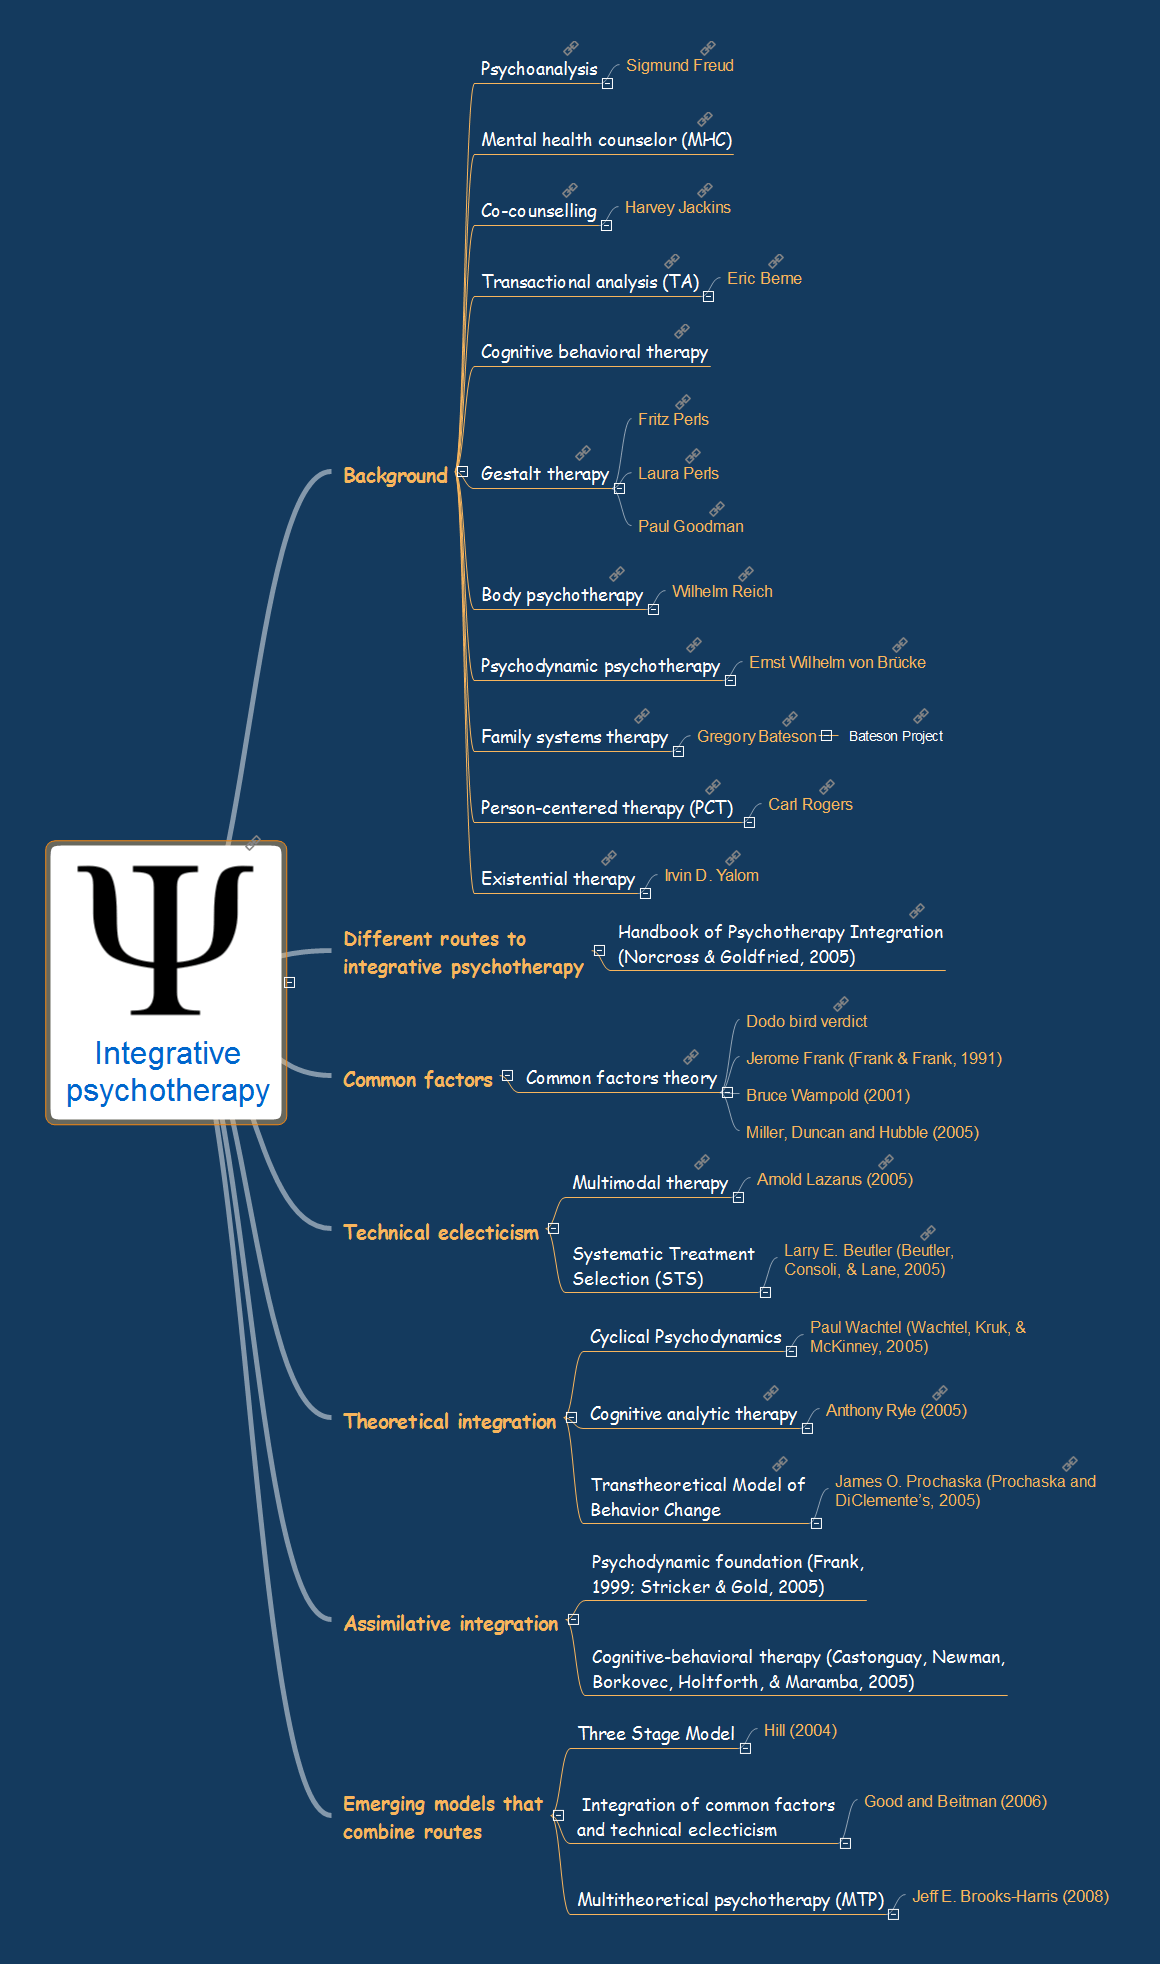
Video tutorials on ConceptDraw products. Try it today!Integrative Psychotherapy
This mind map is an interactive learning brochure which contains topics of integrative psychotherapy with the associated affirmations.- Conceptdraw.com: Mind Map Software, Drawing Tools | Project ...
- Total Quality Management Value | Quality Mind Map | Probability ...
- PM Easy | Mind Map Exchange | Quality Mind Map | Mindmap ...
- Management Concepts With Mind Map
- How To Do A Mind Map In PowerPoint | Quality visualization in your ...
- Mind Map Making Software | One formula of professional mind ...
- Personal Planning
- Mind Map Food | One formula of professional mind mapping : input ...
- How To Create Restaurant Floor Plan in Minutes | Mind Mapping in ...
- Block diagram - Total solution process | Process Flowchart ...
- How To Do A Mind Map In PowerPoint | One formula of professional ...
- How To Do A Mind Map In PowerPoint | Professional & Powerful ...
- Root cause analysis tree diagram - Template | PROBLEM ...
- Metro Map | Maps | How to draw Metro Map style infographics ...
- Project Management Big Picture Concept Map
- Project Management Project Schedule
- How To Do A Mind Map In PowerPoint
- PROBLEM ANALYSIS. Root Cause Analysis Tree Diagram | Cause ...
- Export Mind Maps Into Word


